. 2015 Jun 5;290(23):14567-81.
doi: 10.1074/jbc.M114.622191. Epub 2015 Apr 23.

A Novel Peroxisome Proliferator-activated Receptor (PPAR)α Agonist and PPARγ Antagonist, Z-551, Ameliorates High-fat Diet-induced Obesity and Metabolic Disorders in Mice

Affiliations

A Novel Peroxisome Proliferator-activated Receptor (PPAR)α Agonist and PPARγ Antagonist, Z-551, Ameliorates High-fat Diet-induced Obesity and Metabolic Disorders in Mice

Yoshihiro Shiomi et al. J Biol Chem. .

Abstract

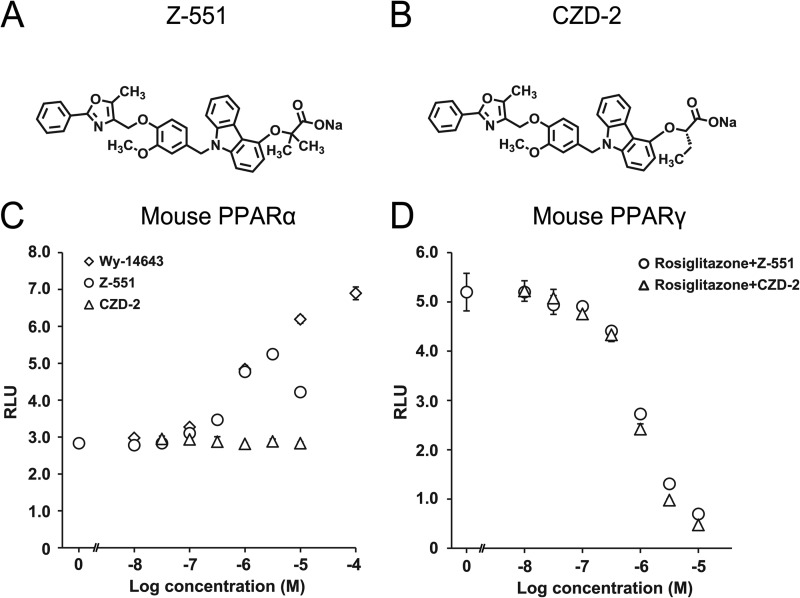
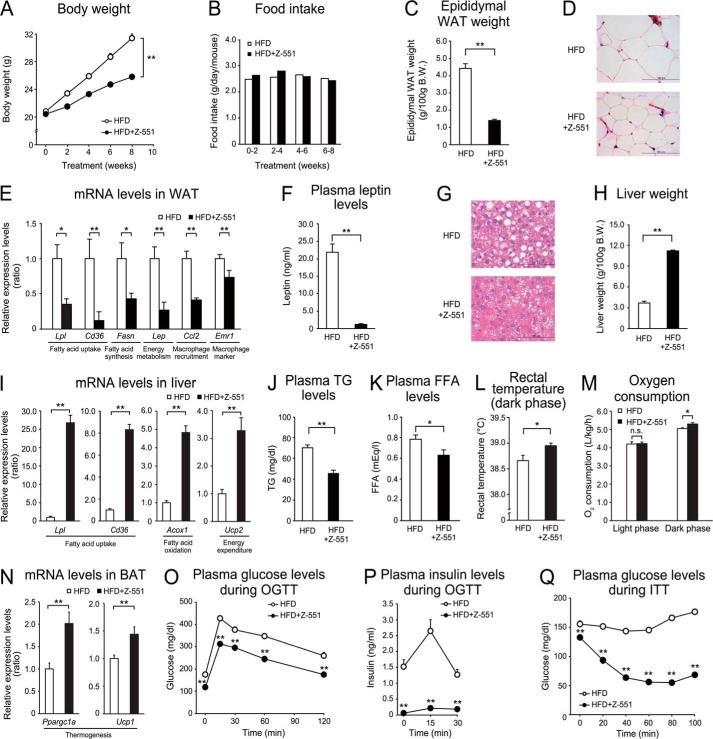
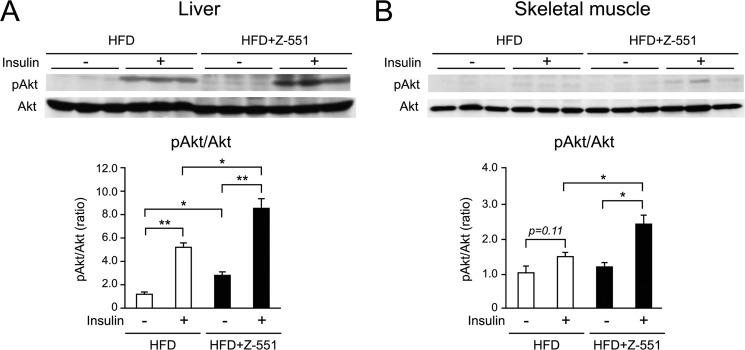
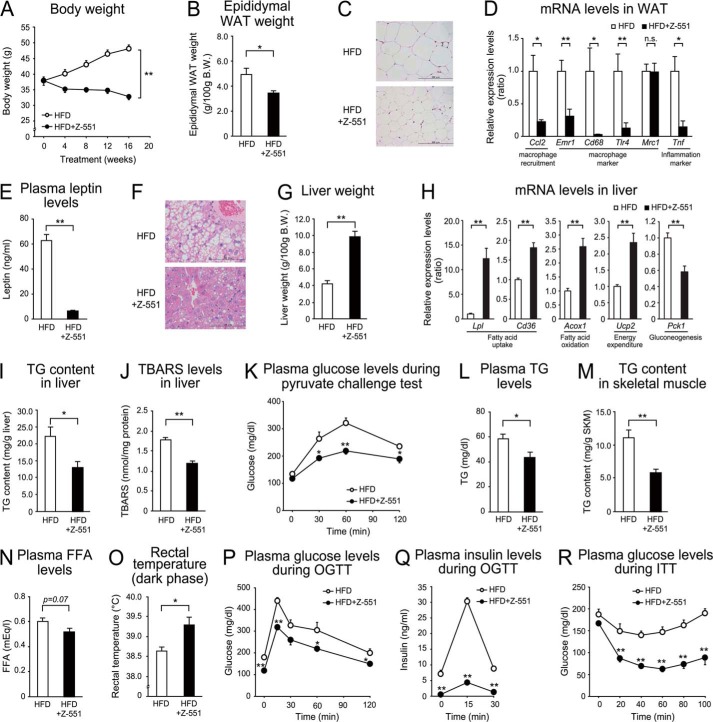
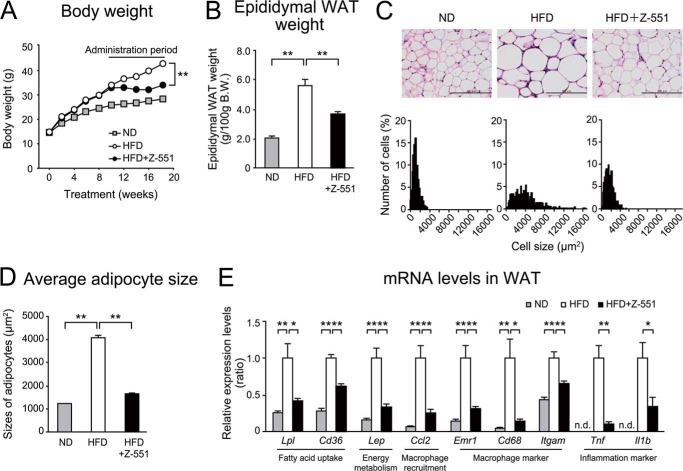
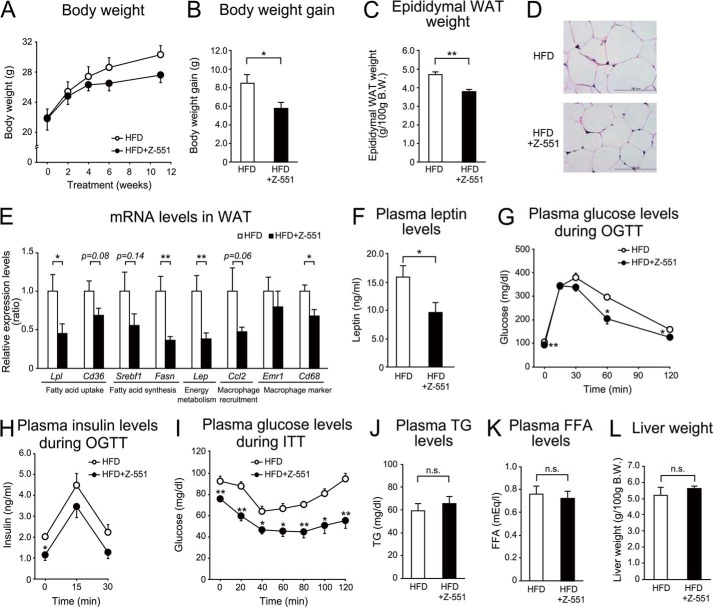
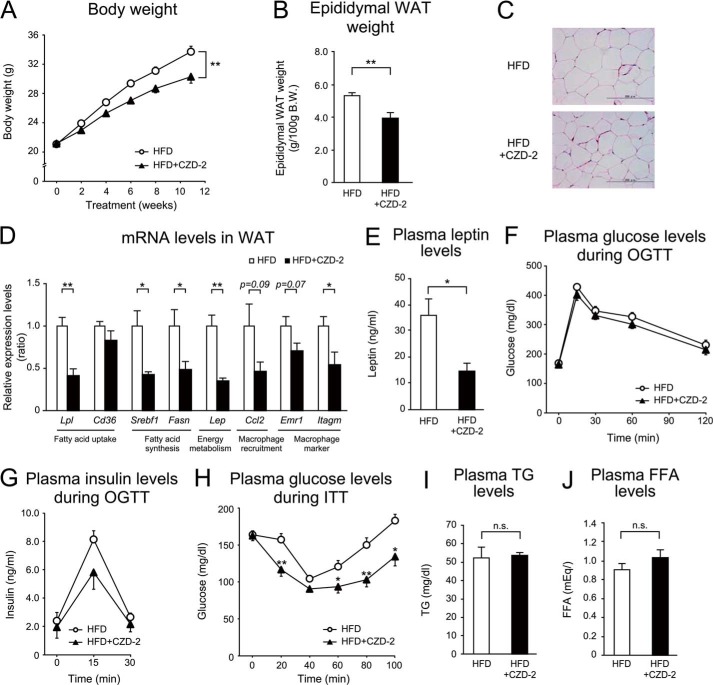
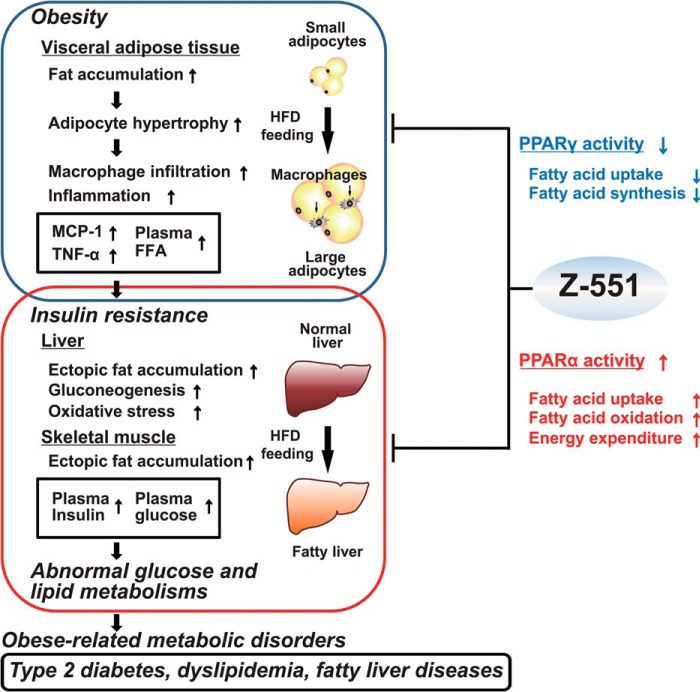
A novel peroxisome proliferator-activated receptor (PPAR) modulator, Z-551, having both PPARα agonistic and PPARγ antagonistic activities, has been developed for the treatment of obesity and obesity-related metabolic disorders. We examined the effects of Z-551 on obesity and the metabolic disorders in wild-type mice on the high-fat diet (HFD). In mice on the HFD, Z-551 significantly suppressed body weight gain and ameliorated insulin resistance and abnormal glucose and lipid metabolisms. Z-551 inhibited visceral fat mass gain and adipocyte hypertrophy, and reduced molecules involved in fatty acid uptake and synthesis, macrophage infiltration, and inflammation in adipose tissue. Z-551 increased molecules involved in fatty acid combustion, while reduced molecules associated with gluconeogenesis in the liver. Furthermore, Z-551 significantly reduced fasting plasma levels of glucose, triglyceride, free fatty acid, insulin, and leptin. To elucidate the significance of the PPAR combination, we examined the effects of Z-551 in PPARα-deficient mice and those of a synthetic PPARγ antagonist in wild-type mice on the HFD. Both drugs showed similar, but weaker effects on body weight, insulin resistance and specific events provoked in adipose tissue compared with those of Z-551 as described above, except for lack of effects on fasting plasma triglyceride and free fatty acid levels. These findings suggest that Z-551 ameliorates HFD-induced obesity, insulin resistance, and impairment of glucose and lipid metabolisms by PPARα agonistic and PPARγ antagonistic activities, and therefore, might be clinically useful for preventing or treating obesity and obesity-related metabolic disorders such as insulin resistance, type 2 diabetes, and dyslipidemia.

Keywords: adipose tissue; diabetes; dyslipidemia; insulin resistance; liver; metabolic disorders; obesity; peroxisome proliferator-activated receptor (PPAR).


Figures

FIGURE 1.
FIGURE 1.
Z-551 is a novel PPAR modulator having both PPARα agonistic and PPARγ antagonistic activities. A and B, chemical structures of Z-551 (A) and CZD-2 (B). C and D, effects of Z-551 and CZD-2 on transcriptional activities for mouse PPARα (C) and PPARγ (D). All results are expressed as mean ± S.E. (n = 4). EC50 values for PPARα are calculated on the assumption that the maximum transcriptional activity induced by Wy-14643 is 100%. IC50 values for PPARγ are calculated on the assumption that the transcriptional activity induced by 100 nm rosiglitazone is 100%.
FIGURE 2.
FIGURE 2.
Z-551 indicates preventive effects on diet-induced obesity and metabolic disorders in WT mice. 4-week-old male WT mice were acclimatized to the HFD for 1 week followed by administration of Z-551 for 9 weeks. A–C, changes in body weight (A), food intake (B), and epididymal WAT weight (C) in WT mice on the HFD (white) or HFD+Z-551 (black). D, morphology of epididymal WAT. Scale bars indicate 100 μm. E, mRNA expression levels in epididymal WAT. F, plasma leptin Week 8 after Z-551 administration. G, morphology of liver. Scale bars indicate 100 μm. H, liver weight, I, mRNA expression levels in the liver. J and K, plasma TG (J) and FFA (K) Week 4 after Z-551 administration. L, rectal temperature. Rectal temperature was measured during the dark phase Week 9 after Z-551 administration. M, oxygen consumption. Oxygen consumption was measured Week 3 after Z-551 administration. N, mRNA expression levels in BAT. O and P, plasma glucose (O) and insulin (P) in the OGTT Week 5 after Z-551 administration. Q, plasma glucose in the ITT Week 8 after Z-551 administration. In the OGTT, glucose (1.0 g/kg body weight (BW)) was orally administered after 6-h fasting. In the ITT, insulin (0.75 unit/kg BW) was intraperitoneally injected. Blood samples were obtained at the indicated times. All results are expressed as mean ± S.E. (n = 7–10). *, p < 0.05; **, p < 0.01; n.s., not significant.
FIGURE 3.
FIGURE 3.
Z-551 improves insulin sensitivity in the liver and skeletal muscle of WT mice. 4-week-old male WT mice were acclimatized to the HFD for 1 week followed by administration of Z-551 for 15 weeks. A and B, insulin-stimulated Akt (Ser-473) phosphorylation in the liver (A) and skeletal muscle (B) of WT mice on the HFD (white) or HFD+Z-551 (black). The phosphorylation and amount of Akt were analyzed by Western blot (upper panel) and the ratio of phosphorylated Akt to Akt (pAkt/Akt) is calculated (lower panel). All results are expressed as mean ± S.E. (n = 3). *, p < 0.05; **, p < 0.01.
FIGURE 4.
FIGURE 4.
Z-551 indicates therapeutic effects on diet-induced obesity and metabolic disorders in WT DIO mice-Experiment 1. 4-week-old male WT mice were given the HFD for 14 weeks followed by administration of Z-551 for 16 weeks. A and B, changes in body weight (A), and epididymal WAT weight (B) in WT DIO mice on the HFD (white) or HFD+Z-551 (black). C, morphology of epididymal WAT. Scale bars indicate 200 μm. D, mRNA expression levels of in epididymal WAT. E, plasma leptin week 12 after Z-551 administration. F, morphology of the liver. Scale bars indicate 100 μm. G, liver weight. H, mRNA expression levels in the liver. I and J, TG content (I) and TBARS levels (J) in the liver. K, plasma glucose in the pyruvate challenge test Week 9 after Z-551 administration. In the pyruvate challenge test, sodium pyruvate (1.5 g/kg BW) was intraperitoneally injected after 6-h fasting and blood samples were obtained at the indicated times. L and N, plasma TG (L) and FFA (N) Week 13 after Z-551 administration. M, TG content in skeletal muscle. O, rectal temperature. Rectal temperature was measured during the dark phase Week 15 after Z-551 administration. P and Q, plasma glucose Week 7 after Z-551 administration. In the OGTT, glucose (1.5 g/kg BW) was orally administered after 6-h fasting. In the ITT, insulin (0.5 unit/kg BW) was intraperitoneally injected. Blood samples were obtained at the indicated times. All results are expressed as mean ± S.E. (n = 6). *, p < 0.05; **, p < 0.01; n.s., not significant.
FIGURE 5.
FIGURE 5.
Z-551 indicates therapeutic effects on diet-induced obesity and metabolic disorders in WT DIO mice-Experiment 2. 4-week-old WT mice were given the HFD for 10 weeks and then administered Z-551 for 8 weeks. A and B, changes in body weight (A), and epididymal WAT weight (B) in WT mice on the ND (gray), and WT DIO mice on the HFD (white) or HFD+Z-551 (black). C and D, morphology of epididymal WAT (upper panel) and histogram of adipocyte size from epididymal WAT (lower panel) (C), and average size of adipocytes from epididymal WAT (D). Scale bars indicate 200 μm. E, mRNA expression levels in epididymal WAT. All results are expressed as mean ± S.E. (n = 8–10). *, p < 0.05; **, p < 0.01 compared with the obese mice on the HFD; n.d., not detected.
FIGURE 6.
FIGURE 6.
Z-551 indicates a part of the preventive effects on diet-induced obesity and metabolic disorders in PPARα-deficient mice. 4-week-old male PPARα-deficient mice were acclimated to the HFD for 1 week followed by administration of Z-551 for 11 weeks. A–C, changes in body weight (A), body weight gain (B), and epididymal WAT weight (C) in PPARα-deficient mice on the HFD (white) or HFD+Z-551 (black). D, morphology of epididymal WAT. Scale bars indicate 100 μm. E, mRNA expression levels in epididymal WAT of PPARα-deficient mice. F, plasma leptin Week 10 after Z-551 administration. G and H, plasma glucose (G) and insulin (H) in the OGTT Week 7 after Z-551 administration. I, plasma glucose in the ITT Week 8 after Z-551 administration. In the OGTT, glucose (2.0 g/kg BW) was orally administered after 6-h fasting. In the ITT, insulin (0.75 unit/kg BW) was intraperitoneally injected. Blood samples were obtained at the indicated times. J and K, plasma TG (J) and FFA (K) Week 10 after Z-551 administration. L, liver weight. All results are expressed as mean ± S.E. (n = 5–8). *, p < 0.05; **, p < 0.01; n.s., not significant.
FIGURE 7.
FIGURE 7.
PPARγ antagonist, CZD-2, indicates a part of the preventive effects of Z-551 on diet-induced obesity and metabolic disorders in WT mice. 4-week-old male WT mice were acclimated to the HFD for 1 week followed by administration of CZD-2 for 11 weeks. A and B, changes in body weight (A), and epididymal WAT weight (B) in WT mice on the HFD (white) or HFD+CZD-2 (black). C, morphology of epididymal WAT. Scale bars indicate 200 μm. D, mRNA expression levels in epididymal WAT. E, plasma leptin Week 11 after CZD-2 administration. F and G, plasma glucose (F) and insulin (G) in the OGTT Week 10 after CZD-2 administration. H, plasma glucose in the ITT Week 9 after CZD-2 administration. In the OGTT, glucose (1.5 g/kg BW) was orally administered after 6-h fasting. In the ITT, insulin (0.75 unit/kg BW) was intraperitoneally injected. Blood samples were obtained at the indicated times. I and J, plasma TG (I) and FFA (J) Week 10 after CZD-2 administration. All results are expressed as mean ± S.E. (n = 6). *, p < 0.05; **, p < 0.01; n.s., not significant.
FIGURE 8.
FIGURE 8.
Z-551 shows no effect on bone loss in WT mice. 4-week-old male WT mice were acclimatized to the HFD for 1 week followed by administration of Z-551 or rosiglitazone for 16 weeks. Z-551 and rosiglitazone were given as a food admixture at 0.01%, 0.03%, or 0.1% (w/w). A, bone morphology of femur. B and C, total (B) and trabecular (C) bone mineral densities of the proximal femur in WT mice on the HFD (white), HFD+Z-551 (black), or HFD+rosiglitazone (Rosi) (gray). Results are expressed as mean ± S.E. (n = 12). D, MRIs of vertical section of the proximal femur. E, 1H-MR spectra obtained from the proximal femur (red square). The downward arrows in the spectra indicate signals of lipids. *, p < 0.05; **, p < 0.01.
FIGURE 9.
FIGURE 9.
Putative mechanisms of action for Z-551 having both PPARα agonistic and PPARγ antagonistic activities.

Similar articles

Cited by

References

    1. Flegal K. M., Carroll M. D., Ogden C. L., Curtin L. R. (2010) Prevalence and trends in obesity among US adults, 1999–2008. JAMA 303, 235–241 - PubMed
    1. Kopelman P. G. (2000) Obesity as a medical problem. Nature 404, 635–643 - PubMed
    1. Ahima R. S. (2006) Adipose tissue as an endocrine organ. Obesity 14, 242S–249S - PubMed
    1. Hotamisligil G. S., Arner P., Caro J. F., Atkinson R. L., Spiegelman B. M. (1995) Increased adipose tissue expression of tumor necrosis factor-α in human obesity and insulin resistance. J. Clin. Invest. 95, 2409–2415 - PMC - PubMed
    1. Weisberg S. P., McCann D., Desai M., Rosenbaum M., Leibel R. L., Ferrante A. W., Jr. (2003) Obesity is associated with macrophage accumulation in adipose tissue. J. Clin. Invest. 112, 1796–1808 - PMC - PubMed

Publication types