. 2015 Jun 19;290(25):15670-15678.
doi: 10.1074/jbc.M115.646422. Epub 2015 Apr 23.

The Us3 Protein of Herpes Simplex Virus 1 Inhibits T Cell Signaling by Confining Linker for Activation of T Cells (LAT) Activation via TRAF6 Protein

Affiliations

The Us3 Protein of Herpes Simplex Virus 1 Inhibits T Cell Signaling by Confining Linker for Activation of T Cells (LAT) Activation via TRAF6 Protein

Yin Yang et al. J Biol Chem. .

Abstract

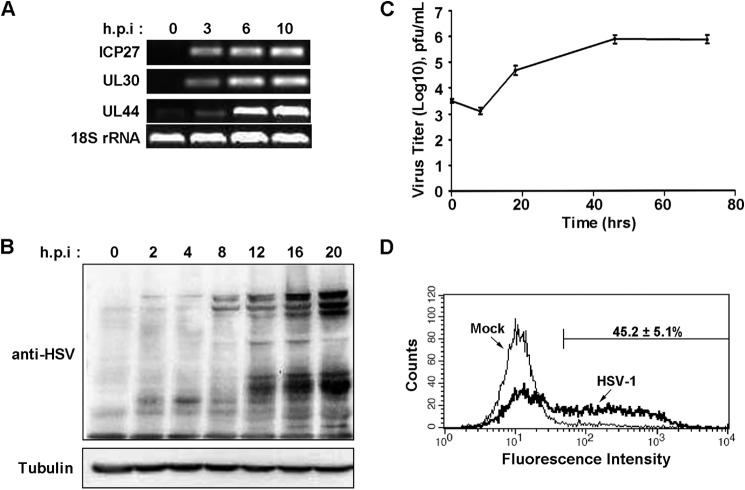
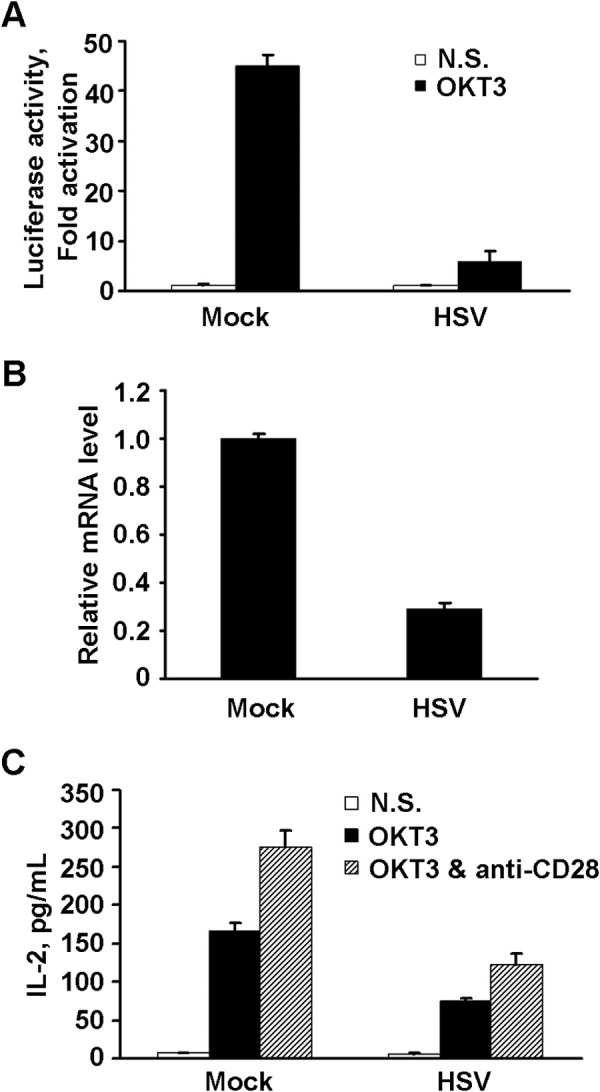
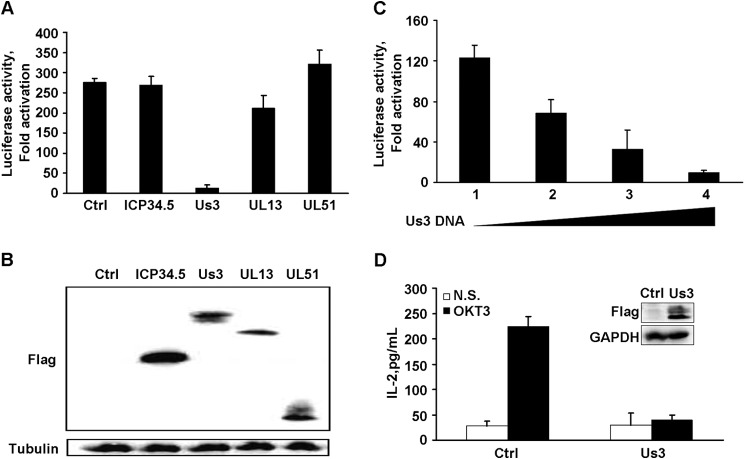
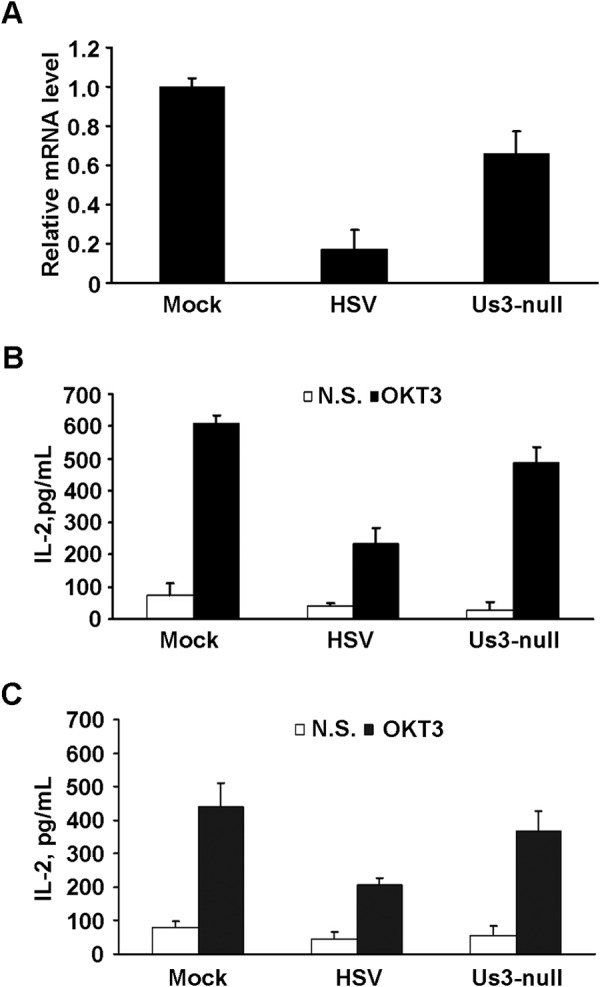
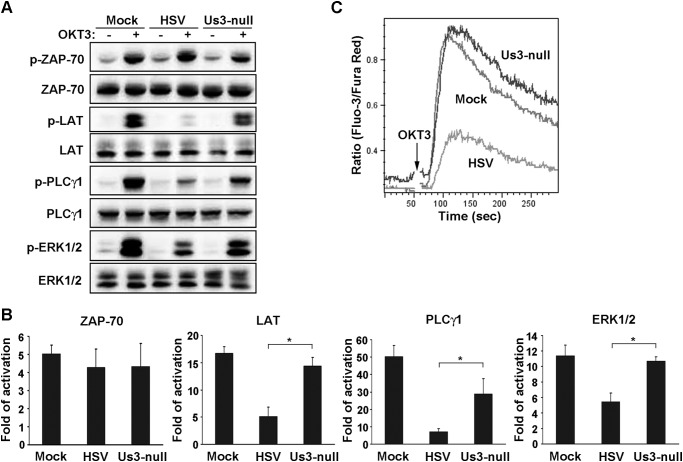
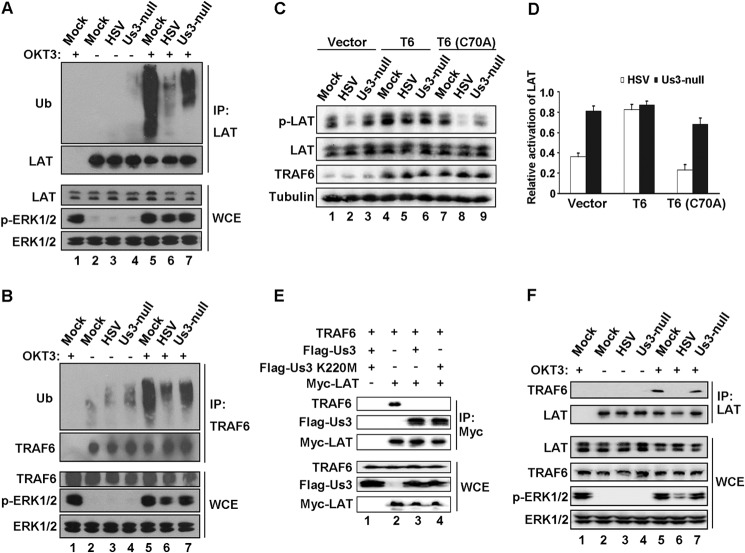
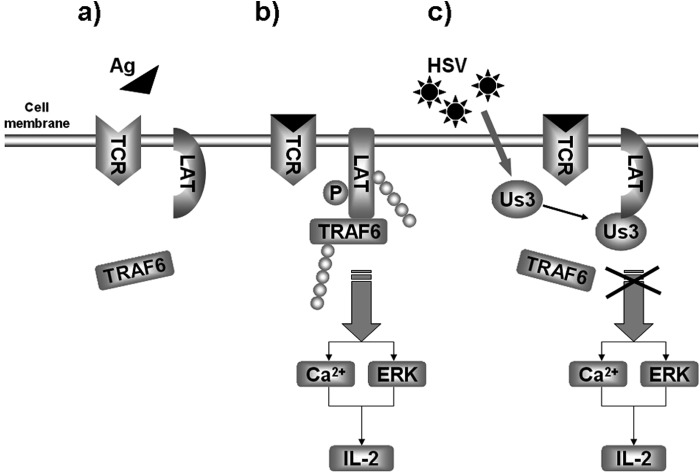
Herpes simplex virus 1 (HSV-1) is the most prevalent human virus and causes global morbidity because the virus is able to infect multiple cell types. Remarkably, HSV infection switches between lytic and latent cycles, where T cells play a critical role. However, the precise way of virus-host interactions is incompletely understood. Here we report that HSV-1 productively infected Jurkat T-cells and inhibited antigen-induced T cell receptor activation. We discovered that HSV-1-encoded Us3 protein interrupted TCR signaling and interleukin-2 production by inactivation of the linker for activation of T cells. This study unveils a mechanism by which HSV-1 intrudes into early events of TCR-mediated cell signaling and may provide novel insights into HSV infection, during which the virus escapes from host immune surveillance.

Keywords: HSV-1; LAT; TCR; TRAF6; Us3; interleukin; signaling; ubiquitination.


Figures

FIGURE 1.
FIGURE 1.
Productive infection of Jurkat T-cells by HSV-1. A, Jurkat T-cells were infected with HSV-1 at 1 pfu/cell. At the indicated hours post-infection, cells were collected, and total RNA was extracted for RT-PCR amplification of viral genes: ICP27 (IE gene), UL30 (E gene), UL44 (L gene), and cellular 18S rRNA as an internal control. B, whole cell lysates were prepared for Western blot analysis using polyclonal antibody against HSV-1 or tubulin. C, virus was titrated at the indicated hours post-infection, and the growth curve was plotted with the log (10) plaque-forming units as the vertical axis and the time as the horizontal axis. Data are mean ± S.D. of three independent experiments. D, Jurkat T cells were mock-infected or infected with HSV-1 at 1 pfu/cell for 8 h and collected for flow cytometry analysis using anti-HSV-1 antibody. The plot is representative of three experiments, and the percentage of HSV-1 positive cells is expressed as mean ± S.D.
FIGURE 2.
FIGURE 2.
Inhibition of TCR stimulation by HSV-1. A, Jurkat T cells were transfected with pIL2-Luc and pRL-TK and mock-infected or infected with HSV (1 pfu/cell). At 8 h.p.i, cells were stimulated with anti-CD3 antibody (OKT3) or left unstimulated for an additional 4 h, followed by a luciferase assay. Data are presented as -fold of activation, and the ratio is that of OKT3-stimulated luciferase activity (closed columns) relative to an unstimulated sample (open columns). N.S., not stimulated. B, mock-infected or infected cells were collected at 8 h.p.i, and IL-2 mRNA was quantitated by real-time PCR. The mRNA level was normalized to that of 18S rRNA, and the level of IL-2 mRNA of each sample was calculated and is presented relative to the mock sample. C, the infected cells were left unstimulated (open columns) or stimulated for 24 h with OKT3 alone (closed columns) or with OKT3 plus anti-CD28 (hatched columns). The medium of each sample was collected, and IL-2 was determined by ELISA as described under “Experimental Procedures.” The above data were obtained from three independent experiments and are expressed as mean ± S.D.
FIGURE 3.
FIGURE 3.
The effect of HSV-1 proteins on TCR stimulated IL-2. A, plasmids encoding the indicated viral proteins with a FLAG tag, together with pIL2-Luc and pRL-TK, were transfected into Jurkat T cells, and the cells were stimulated with OKT3 or remained non-stimulated. IL-2 promoter activity is presented as -fold of activation; namely, the ratio of the reporter in activated cells to that of non-stimulated cells. Data are mean ± S.D. (n = 3). Ctrl, control. B, the expression of viral proteins was determined by Western blot analysis with antibodies against FLAG and tubulin. C, Jurkat T cells were transfected with increasing amounts of Us3-encoding plasmid (samples 1–4 are 0, 50, 200, and 900 ng, respectively) together with the pIL2-Luc and pRL-TK reporter constructs. IL-2 promoter activity is presented as -fold of activation as described in A and is the mean ± S.D. (n = 3). D, Jurkat T cells stably expressing FLAG-Us3 fusion protein were left unstimulated (N.S., open columns) or stimulated with OKT3 plus anti-CD28 (closed columns), and the secreted IL-2 was determined and is presented as mean ± S.D. (n = 3). The inset represented the expression of Us3 protein and the internal control, GAPDH.
FIGURE 4.
FIGURE 4.
The effect of HSV-1 Us3 on T cell activation. Jurkat T cells were mock-infected or infected with wild-type or Us3-null HSV-1, followed by stimulation with OKT3. A, IL-2 mRNA was measured by real-time PCR and normalized to that of 18S rRNA. The level of IL-2 mRNA of each sample was calculated and is presented relative to the mock sample. B, the medium was collected, and secreted IL-2 was monitored by ELISA as described above. Non-stimulated sample (N.S., open columns) and OKT3-stimulated (closed columns) IL-2 measurements are presented as mean ± S.D. of three independent experiments. C, human CD3+ T cells were infected with the indicated viruses, and secretion of IL-2 was determined as described in B.
FIGURE 5.
FIGURE 5.
Inhibition of TCR-mediated signaling by HSV-1. Jurkat T cells were mock-infected or infected with HSV-1 and the recombinant Us3-null virus. A, the phosphorylation of the indicated proteins was resolved by Western blot analysis with the corresponding total proteins. B, each band was quantified by densitometer, and the -fold of activation of each protein was calculated by the ratio of each phosphorylated band density to that of the non-stimulated band. Data are mean ± S.D. (n = 3). *, p < 0.05 by Student's t test. C, the infected cells were loaded with fluorescent dyes, and intracellular calcium was monitored as described under “Experimental Procedures.” The vertical axis displays the relative free calcium concentration, and the plot represents three independent experiments.
FIGURE 6.
FIGURE 6.
HSV-1 inhibition of LAT by blocking the binding of TRAF6. Jurkat T-cells were mock-infected or infected with HSV-1 or Us3-null virus and treated with (+) or without (−) OKT3 as indicated. The cell lysates were subjected to immunoprecipitation (IP) using anti-LAT antibody (A and F) or anti-TRAF6 antibody (B). The immobilized proteins were resolved by Western blot analysis with the indicated antibodies. The cognate IgG was used as a negative control (lane 1 in A, B, and F). The expression of those proteins in whole cell extract (WCE) was monitored (bottom panels). C, Jurkat T cells transduced lentivirally with vector, wild-type TRAF6 (T6), or inactive mutant TRAF6 (T6 C70A) were infected as indicated and stimulated with OKT3. p-LAT, total LAT, TRAF6, and tubulin were analyzed by Western blot and quantitated by densitometry. D, the relative activation of LAT is presented by the ratio of infected samples to that of the mock-infected sample in the same transduction group. E, HEK293T cells were transiently transfected with the indicated plasmids, and cell extracts normalized to an equal amount of protein were applied to immunoprecipitation by anti-Myc antibody. The immobilized proteins (top panels) and whole cell extracts (bottom panels) were subjected to SDS-PAGE and Western blot analysis. F, Jurkat T cells were infected as indicated and stimulated with (+) or without (−) OKT3. Cell lysates were subjected to immunoprecipitation with anti-LAT antibody and Western blot analysis with the indicated antibodies.
FIGURE 7.
FIGURE 7.
Proposed model for the inhibition of TCR signaling by HSV-1. In quiescent T cells, the signal molecules stay in their inactive form (a) until the TCR is engaged by antigen or the agonist antibody OKT3 (in context) (b). b, LAT interacts with and recruits TRAF6. The latter is required for the ubiquitination and optimal tyrosine phosphorylation of LAT. Upon HSV-1 infection (c), the viral protein Us3 associates with LAT and interferes with the interaction between LAT and TRAF6. Therefore, the ubiquitination and phosphorylation of LAT are impaired so that TCR-mediated signal transduction and IL-2 production are blocked.

Similar articles

Cited by

References

    1. Whitley R. J., Roizman B. (2001) Herpes simplex virus infections. Lancet 357, 1513–1518 - PubMed
    1. Melroe G. T., DeLuca N. A., Knipe D. M. (2004) Herpes simplex virus 1 has multiple mechanisms for blocking virus-induced interferon production. J. Virol. 78, 8411–8420 - PMC - PubMed
    1. Lin R., Noyce R. S., Collins S. E., Everett R. D., Mossman K. L. (2004) The herpes simplex virus ICP0 RING finger domain inhibits IRF3- and IRF7-mediated activation of interferon-stimulated genes. J. Virol. 78, 1675–1684 - PMC - PubMed
    1. Taylor K. E., Chew M. V., Ashkar A. A., Mossman K. L. (2014) Novel roles of cytoplasmic ICP0: proteasome-independent functions of the RING finger are required to block interferon-stimulated gene production but not to promote viral replication. J. Virol. 88, 8091–8101 - PMC - PubMed
    1. Ma Y., Jin H., Valyi-Nagy T., Cao Y., Yan Z., He B. (2012) Inhibition of TANK binding kinase 1 by herpes simplex virus 1 facilitates productive infection. J. Virol. 86, 2188–2196 - PMC - PubMed

Publication types

MeSH terms