. 2015 May 29;290(22):14245-66.
doi: 10.1074/jbc.M115.645580. Epub 2015 Apr 23.

MicroRNA-26a/-26b-COX-2-MIP-2 Loop Regulates Allergic Inflammation and Allergic Inflammation-promoted Enhanced Tumorigenic and Metastatic Potential of Cancer Cells

Affiliations

MicroRNA-26a/-26b-COX-2-MIP-2 Loop Regulates Allergic Inflammation and Allergic Inflammation-promoted Enhanced Tumorigenic and Metastatic Potential of Cancer Cells

Yoojung Kwon et al. J Biol Chem. .

Abstract

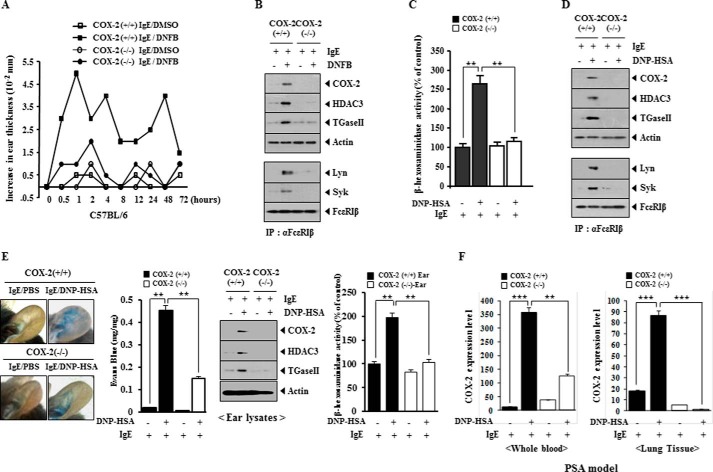
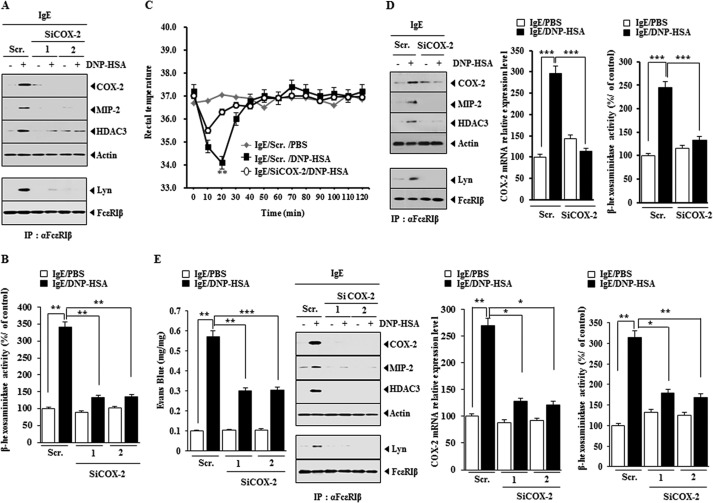
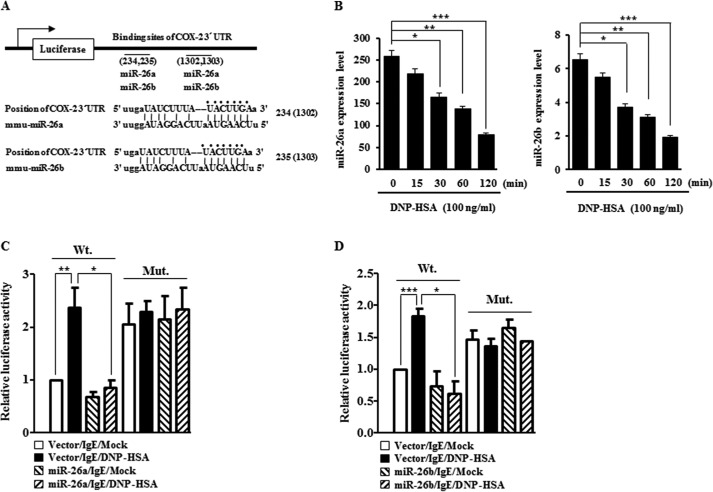
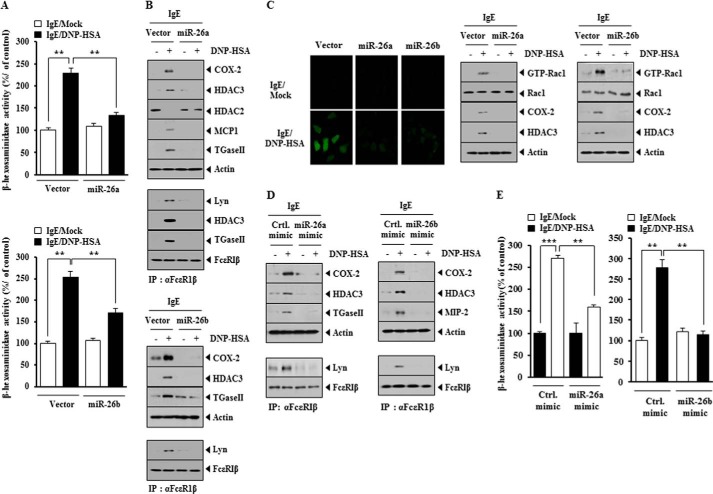
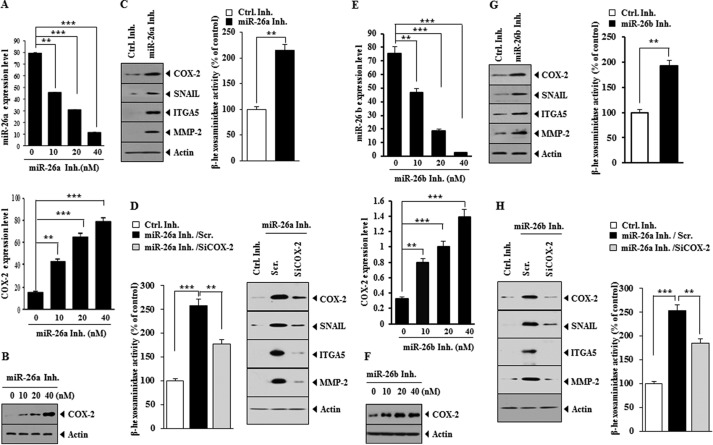
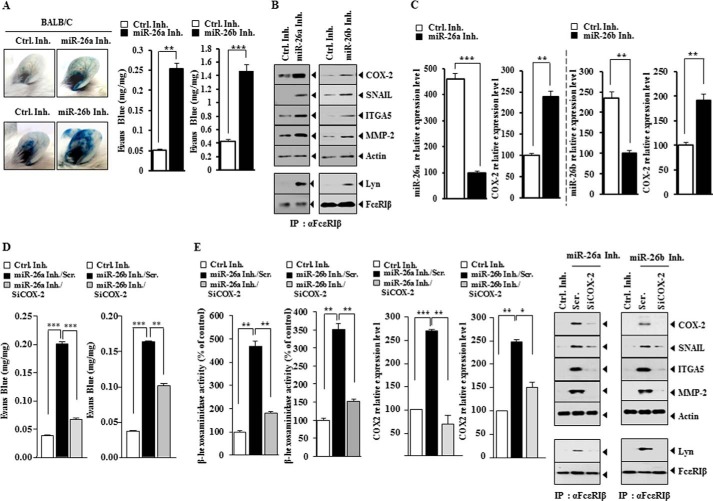
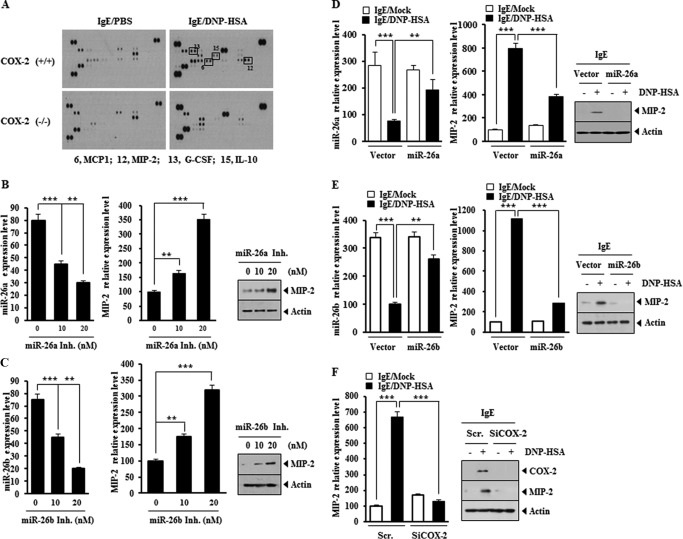
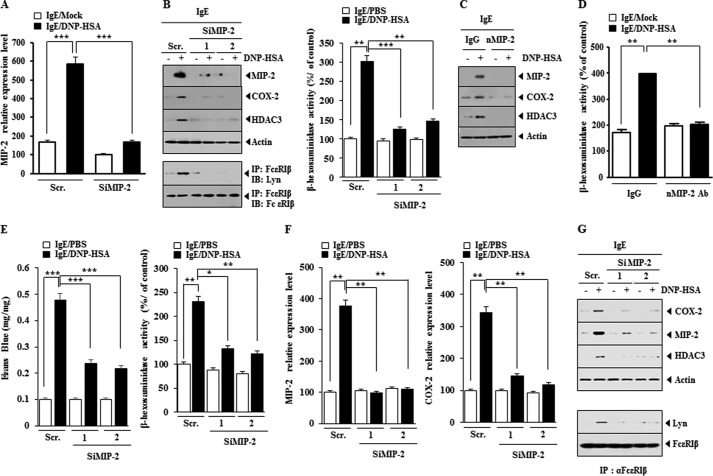
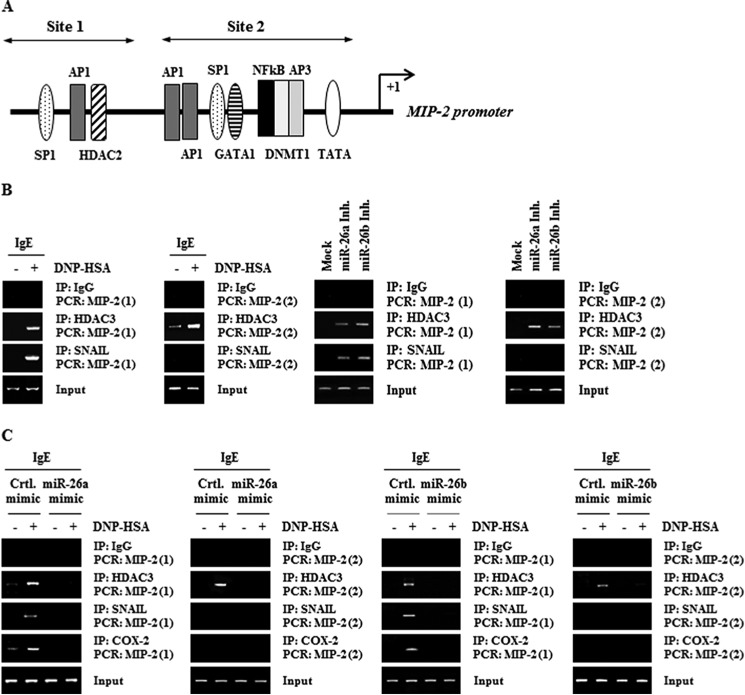
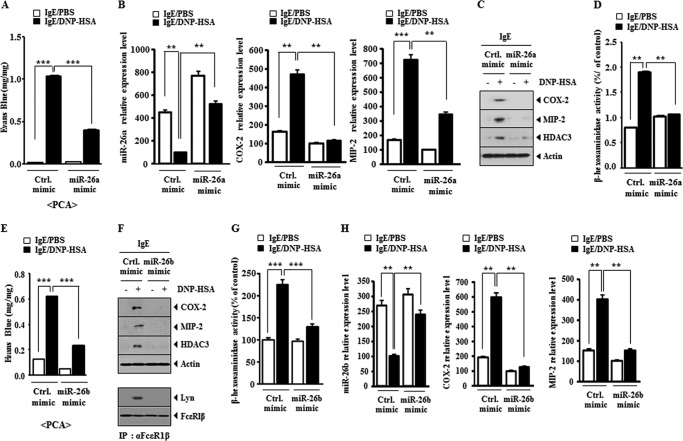
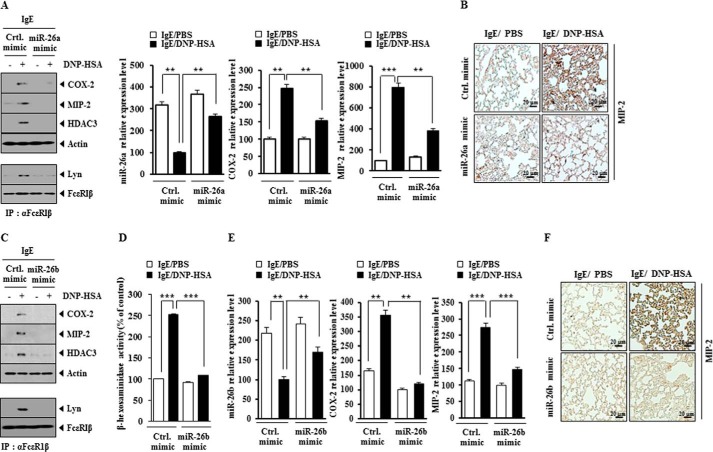
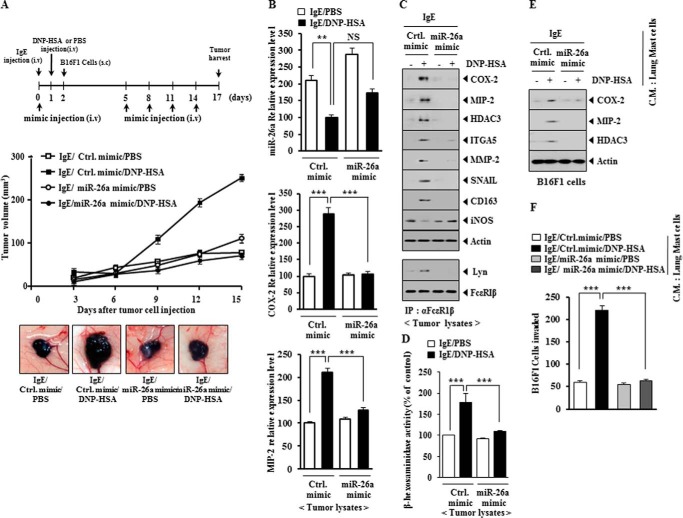
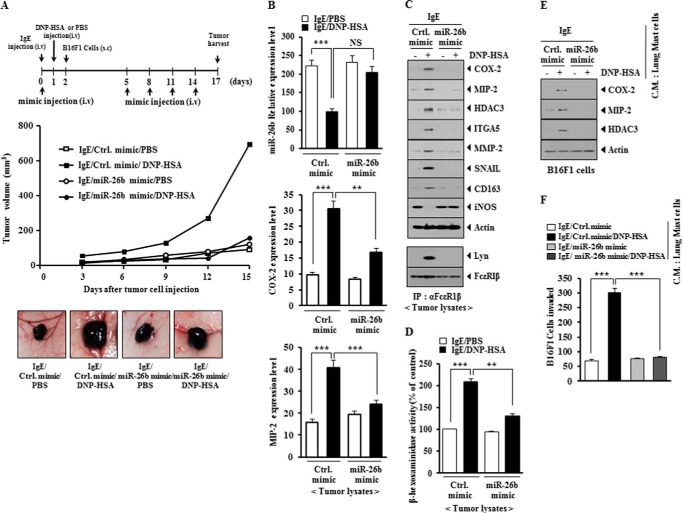
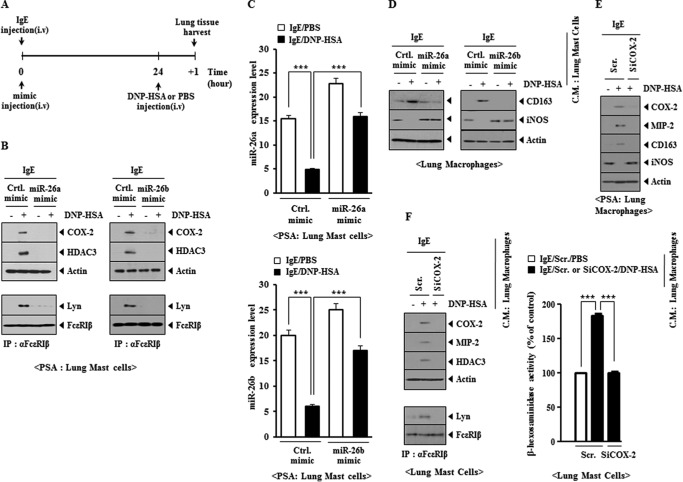
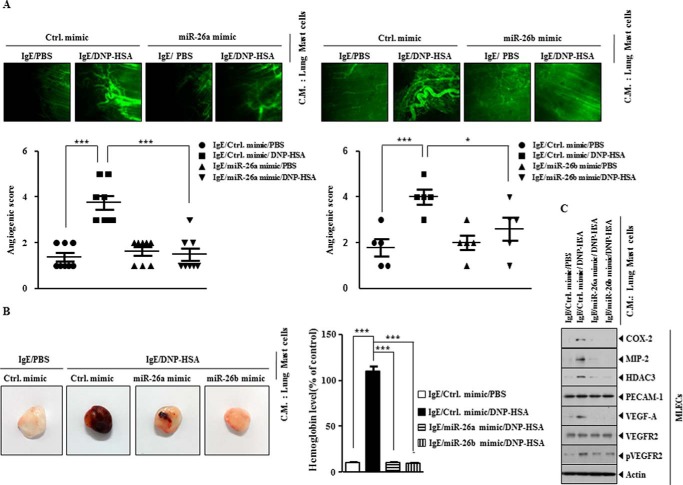
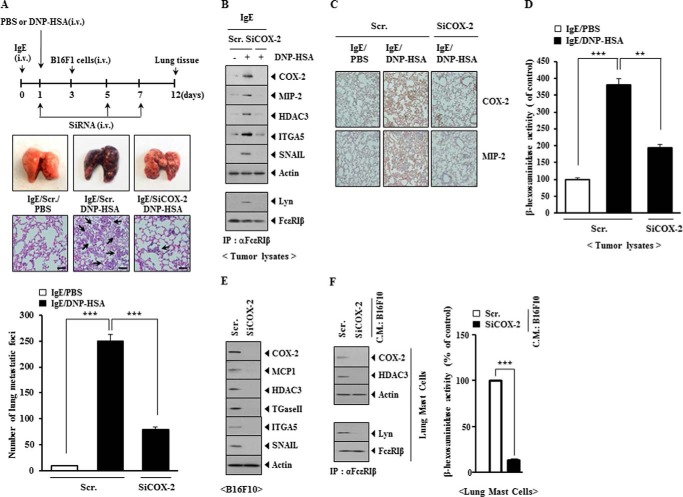
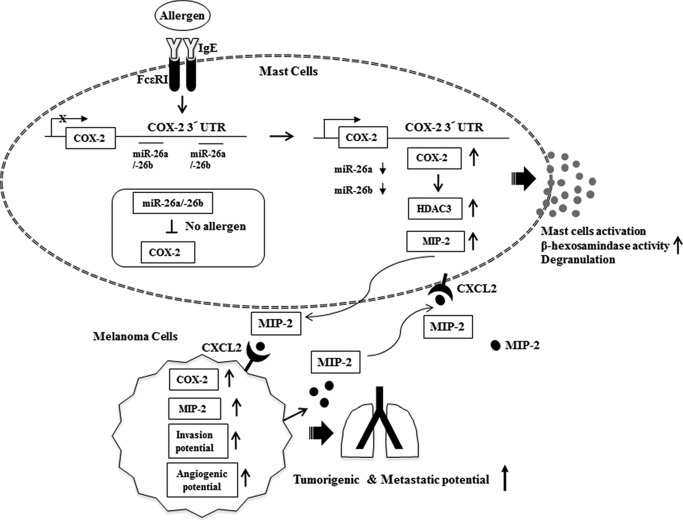
Cyclooxgenase-2 (COX-2) knock-out mouse experiments showed that COX-2 was necessary for in vivo allergic inflammation, such as passive cutaneous anaphylaxis, passive systemic anaphylaxis, and triphasic cutaneous allergic reaction. TargetScan analysis predicted COX-2 as a target of miR-26a and miR-26b. miR-26a/-26b decreased luciferase activity associated with COX-2-3'-UTR. miR-26a/-26b exerted negative effects on the features of in vitro and in vivo allergic inflammation by targeting COX-2. ChIP assays showed the binding of HDAC3 and SNAIL, but not COX-2, to the promoter sequences of miR-26a and miR-26b. Cytokine array analysis showed that the induction of chemokines, such as MIP-2, in the mouse passive systemic anaphylaxis model occurred in a COX-2-dependent manner. ChIP assays showed the binding of HDAC3 and COX-2 to the promoter sequences of MIP-2. In vitro and in vivo allergic inflammation was accompanied by the increased expression of MIP-2. miR-26a/-26b negatively regulated the expression of MIP-2. Allergic inflammation enhanced the tumorigenic and metastatic potential of cancer cells and induced positive feedback involving cancer cells and stromal cells, such as mast cells, macrophages, and endothelial cells. miR-26a mimic and miR-26b mimic negatively regulated the positive feedback between cancer cells and stromal cells and the positive feedback among stromal cells. miR-26a/-26b negatively regulated the enhanced tumorigenic potential by allergic inflammation. COX-2 was necessary for the enhanced metastatic potential of cancer cells by allergic inflammation. Taken together, our results indicate that the miR26a/-26b-COX-2-MIP-2 loop regulates allergic inflammation and the feedback relationship between allergic inflammation and the enhanced tumorigenic and metastatic potential.

Keywords: COX-2; MIP-2; allergic inflammation; allergy; angiogenesis; metastasis; miR-26; microRNA (miRNA); tumor microenvironment; tumorigenic potential.


Figures

FIGURE 1.
FIGURE 1.
COX-2 is necessary for in vivo allergic inflammation. A, the indicated C57BL/6 mice were sensitized to DNP-specific IgE (0.5 μg/kg) by an intravenous injection. The next day, both ears of mice were painted with 2,4-dinitrofluorobenzene (DNFB) or DMSO. At each time point after 2,4-dinitrofluorobenzene stimulation, ear thickness was measured. Each experimental group consisted of five mice. Means ± S.E. (error bars) of three independent experiments are shown. B, ear tissue lysates isolated from each mouse were subjected to Western blot analysis (top) immunoprecipitation (IP) with the indicated antibody (2 μg/ml), followed by Western blot analysis (bottom). C, cell lysates isolated from ear skin mast cells of each mouse were subjected to β-hexosaminidase activity assays. **, p < 0.005. D, lysates isolated from ear skin mast cells of each mouse were subjected to Western blot analysis (top) and were immunoprecipitated with the indicated antibody, followed by Western blot analysis (bottom). E, PCA employing the C57BL/6 mice was performed as described. In brief, the indicated C57BL/6 mice were given an intradermal injection of DNP-specific IgE antibody (0.5 μg/kg) or DNP-specific IgG (0.5 μg/kg). The next day, the mice were given an intravenous injection of PBS or DNP-HSA (250 μg/kg) along with 2% (v/v) Evans Blue solution. One hour after the injection, the extent of vascular permeability was determined as described. Each experimental group consisted of four mice. Means ± S.E. of three independent experiments are depicted. Representative images from four animals of each experimental group are shown. Ear tissue lysates isolated from each mouse were subjected to Western blot analysis and β-hexosaminidase activity assays. **, p < 0.005. F, PSA employing the indicated C57BL/6 mice was performed. In brief, the indicated C57BL/6 mice were sensitized to DNP-specific IgE (0.5 μg/kg) by an intravenous injection. The next day, the indicated mice were given an intravenous injection of DNP-HSA (250 μg/kg). The mRNAs from whole blood and lung tissues were isolated and subjected to qRT-PCR analysis. **, p < 0.005; ***, p < 0.0005.
FIGURE 2.
FIGURE 2.
The down-regulation of COX-2 negatively regulates allergic inflammation in vitro and in vivo. A, RBL2H3 cells were transfected with the indicated siRNA (each at 10 nm) prior to sensitization with DNP-specific IgE (100 ng/ml). The IgE-sensitized RBL2H3 cells were then stimulated with DNP-HSA (100 ng/ml) for 1 h. Cell lysates were subjected to Western blot analysis. IP, immunoprecipitation; Scr., scrambled siRNA. B, same as A except that β-hexosaminidase activity assays were performed. **, p < 0.005. C, BALB/c mice were injected with scrambled (100 nm) or COX-2 siRNA (100 nm) via the tail vein. The next day, BALB/c mice were injected with DNP-specific IgE (0.5 μg/kg) via the tail vein. The following day, BALB/c mice were injected intravenously with DNP-HSA (250 μg/kg) or PBS, and rectal temperatures were measured. Each experimental group consisted of five mice. The means ± S.E. (error bars) of three independent experiments are depicted. D, 2 h after the injection of DNP-HSA, lung tissue lysates were isolated and subjected to Western blot analysis. Lung tissue lysates were also immunoprecipitated with the indicated antibody, followed by Western blot analysis. Lung tissue lysates were also subjected to qRT-PCR analysis and β-hexosaminidase activity assays. ***, p < 0.0005. E, BALB/c mice were given an intradermal injection of DNP-specific IgE (0.5 μg/kg). The next day, BALB/c mice were given an intravenous injection of scrambled (100 nm) or COX-2 siRNA (100 nm). One hour after the injection of siRNA, BALB/c mice were given an intravenous injection of PBS or DNP-HSA (250 μg/kg) along with 2% (v/v) Evans Blue solution. One hour after the injection of Evans Blue solution, the dye was eluted from the ear in 700 μl of formamide at 63 °C. The absorbance was measured at 620 nm. Ear lysates were subjected to β-hexosaminidase activity assays, qRT-PCR analysis, immunoprecipitation, and Western blot. *, p < 0.05; **, p < 0.005; ***, p < 0.005.
FIGURE 3.
FIGURE 3.
miR-26a and miR-26b target COX-2. A, potential binding of miR-26a and miR-26b to the 3′-UTR of COX-2. B, the IgE-sensitized RBL2H3 cells were stimulated with DNP-HSA (100 ng/ml) for various time intervals. miRNA isolated at each time point was subjected to qRT-PCR. *, p < 0.05; **, p < 0.005; ***, p < 0.0005. C, RBL2H3 cells were transfected with control vector (1 μg) or miR-26a construct (1 μg) along with wild type 3′-COX-2- UTR-luciferase construct or mutant 3′-COX-2-UTR-luciferase construct (Mut.) prior to sensitization with DNP-specific IgE (100 ng/ml). The IgE-sensitized RBL2H3 cells were then stimulated with DNP-HSA (100 ng/ml) for 1 h. Luciferase activity assays were performed as described. *, p < 0.05; **, p < 0.005. D, same as C except that miR-26b construct (1 μg) was transfected into RBL2H3 cells. *, p < 0.05; ***, p < 0.0005. Error bars, S.E.
FIGURE 4.
FIGURE 4.
miR-26a and miR-26b negatively regulate the in vitro allergic inflammation. A, RBL2H3 cells were transfected with control vector (1 μg), miR-26a construct (1 μg), or miR-26b construct (1 μg) prior to sensitization with DNP-specific IgE (100 ng/ml). The IgE-sensitized RBL2H3 cells were then stimulated with DNP-HSA (100 ng/ml) for 1 h. Cell lysates were subjected to β-hexosaminidase activity assays. **, p < 0.005. B, same cell lysates were subjected to Western blot analysis (top). Cell lysates were also subjected to immunoprecipitation (IP) employing the indicated antibody, followed by Western blot analysis (bottom). C, the level of reactive oxygen species was measured by employing DCFH-DA (left). Rac1 activity assays employing cell lysates were performed as described (right). D, RBL2H3 cells were transfected with control mimic (10 nm), miR-26a mimic (10 nm), or miR-26b mimic (10 nm) prior to sensitization with DNP-specific IgE (100 ng/ml). The IgE-sensitized RBL2H3 cells were then stimulated with DNP-HSA (100 ng/ml) for 1 h. Cell lysates were subjected to Western blot analysis (top). Cell lysates were also subjected to immunoprecipitation (IP) employing the indicated antibody, followed by Western blot analysis (bottom). E, same as D except that β-hexosaminidase activity assays were performed. **, p < 0.005; ***, p < 0.0005. Error bars, S.E.
FIGURE 5.
FIGURE 5.
miR-26a inhibitor and miR-26b inhibitor target COX-2 to regulate in vitro allergic inflammation. A, RBL2H3 cells were treated with various concentrations of miR-26a inhibitor for 8 h. qRT-PCR analysis for determination of expression level of miR-26a and COX-2 mRNA was performed. **, p < 0.005; ***, p < 0.0005. B, RBL2H3 cells were treated with various concentrations of miR-26a inhibitor for 8 h. Cell lysates were subjected to Western blot analysis. C, RBL2H3 cells were transfected with the indicated inhibitor (each at 10 nm). At 24 h after transfection, cell lysates were prepared and subjected to Western blot analysis. C, RBL2H3 cells were treated with the indicated inhibitor (10 nm each) for 8 h. Cell lysates were subjected to β-hexosaminidase activity assays. **, p < 0.005. D, RBL2H3 cells were transfected with the indicated inhibitor (10 nm) along with the indicated siRNA (10 nm). At 48 h after transfection, cell lysates were subjected to Western blot analysis and β-hexosaminidase activity assays. **, p < 0.005; ***, p < 0.0005. E, same as A except that RBL2H3 cells were treated with various concentrations of miR-26b inhibitor for 8 h. **, p < 0.005; ***, p < 0.0005. F, same as B except that RBL2H3 cells were transfected with miR-26b inhibitor (10 nm). G, same as C except that RBL2H3 cells were treated with miR-26b inhibitor (10 nm) for 8 h. **, p < 0.005. H, same as D except that RBL2H3 cells were transfected with miR-26b inhibitor (10 nm). **, p < 0.005; ***, p < 0.0005. Error bars, S.E.
FIGURE 6.
FIGURE 6.
miR-26a inhibitor and miR-26b inhibitor target COX-2 to regulate features of in vivo allergic inflammation. A, control inhibitor (100 nm), miR-26a inhibitor (100 nm), or miR-26b inhibitor (100 nm) was injected into the ears of the indicated mice. At 8 h after injection, Evans Blue solution was injected, and the extent of vascular permeability was measured as described. Each experimental group consisted of five mice. **, p < 0.005; ***, p < 0.0005. B, ear lysates isolated from ear of each mouse were subjected to Western blot analysis or immunoprecipitation employing the indicated antibody, followed by Western blot analysis. C, ear lysate isolated was subjected to qRT-PCR analysis for determination of expression levels of miR-26a, miR-26b, or COX-2. **, p < 0.005; ***, p < 0.0005. D, the indicated inhibitor (100 nm) was injected along with the indicated siRNA (100 nm) into the ears of the indicated mice. At 8 h after injection, Evans Blue solution was injected, and the extent of vascular permeability was measured as described. **, p < 0.005; ***, p < 0.0005. E, ear lysates were subjected to Western blot analysis or immunoprecipitation employing the indicated antibody, followed by Western blot analysis. Ear lysates were also subjected to β-hexosaminidase activity assays and qRT-PCR analysis. *, p < 0.05; **, p < 0.005; ***, p < 0.0005. Error bars, S.E. Scr., scrambled siRNA.
FIGURE 7.
FIGURE 7.
MIP-2 is regulated by miR-26, miR-26b and COX-2. A, the indicated mice were given an intravenous injection of DNP-specific IgE (0.5 μg/kg). The next day, the indicated mice were given an intravenous injection of DNP-HSA (250 μg/kg). One hour after stimulation with DNP-HSA (250 μg/kg), serum was isolated from each mouse of each experimental group of mice and subjected to cytokine array analysis. B, RBL2H3 cells were transfected with various concentrations of miR-26a inhibitor for 8 h. Cell lysates were subjected to qRT-PCR analysis (left). **, p < 0.005; ***, p < 0.0005. Cell lysates were also subjected to Western blot analysis (right). C, same as B except that RBL2H3 cells were transfected with miR-26b inhibitor. **, p < 0.005; ***, p < 0.0005. D, RBL2H3 cells were transfected with the indicated construct (each at 1 μg) prior to sensitization with DNP-specific IgE (100 ng/ml). The IgE-sensitized RBL2H3 cells were then stimulated with DNP-HSA (100 ng/ml) for 1 h. Cell lysates were subjected to qRT-PCR analysis (left) and Western blot analysis (right). **, p < 0.005; ***, p < 0.0005. E, same as D except that RBL2H3 cells were transfected with miR-26b construct (1 μg). **, p < 0.005; ***, p < 0.0005. F, RBL2H3 cells were transfected with the indicated siRNA (10 nm each) prior to sensitization with DNP-specific IgE (100 ng/ml). The IgE-sensitized RBL2H3 cells were then stimulated with DNP-HSA (100 ng/ml) for 1 h. Cell lysates were subjected to qRT-PCR analysis (left) and Western blot analysis (right). ***, p < 0.0005. Error bars, S.E. Scr., scrambled siRNA.
FIGURE 8.
FIGURE 8.
MIP-2 regulates in vitro allergic inflammation. A, RBL2H3 cells were transfected with the indicated siRNA (10 nm each) prior to sensitization with DNP-specific IgE (100 ng/ml). The IgE-sensitized RBL2H3 cells were then stimulated with DNP-HSA (100 ng/ml) for 1 h. Cell lysates were subjected to qRT-PCR analysis. *, p < 0.05; **, p < 0.005; ***, p < 0.0005. B, same as A except that Western blot, immunoprecipitation, and β-hexosaminidase activity assays were performed. **, p < 0.005; ***, p < 0.0005. C, the IgE-sensitized RBL2H3 cells were preincubated with neutralizing nMCP1 antibody (10 μg/ml) or isotype-matched IgG (10 μg/ml) for 2 h, followed by stimulation with DNP-HSA (100 ng/ml) for 2 h. Cell lysates were subjected to Western blot analysis. D, same as C except that β-hexosaminidase activity assays were performed. **, p < 0.005. E, BALB/c mice were given an intradermal injection of DNP-specific IgE (0.5 μg/kg). The next day, BALB/c mice were given an intravenous injection of scrambled (Scr.) (100 nm) or MIP-2 siRNA (100 nm). One hour after the injection of siRNA, BALB/c mice were given an intravenous injection of PBS or DNP-HSA (250 μg/kg) along with 2% (v/v) Evans Blue solution. One hour after the injection of Evans Blue solution, the dye was eluted from the ear in 700 μl of formamide at 63 °C. The absorbance was measured at 620 nm. Ear tissue lysates were isolated and subjected to β-hexosaminidase activity assays. *, p < 0.05; **, p < 0.005; ***, p < 0.0005. F, ear tissue lysates were subjected to qRT-PCR to determine the expression of MIP-2 mRNA and COX-2 mRNA. **, p < 0.005. G, ear tissue lysate were subjected to Western blot analysis (top) or immunoprecipitated with the indicated antibody, followed by Western blot analysis (bottom). Error bars, S.E.
FIGURE 9.
FIGURE 9.
The expression regulation of MIP-2. A, potential binding sites of transcriptional factors in the promoter sequences of MIP-2. B, the IgE-sensitized RBL2H3 cells were stimulated with DNP-HSA (100 ng/ml) for 1 h. Cell lysates were subjected to ChIP assays employing the indicated antibody. RBL2H3 cells were transfected with control inhibitor (10 nm), miR-26a inhibitor (10 nm), or miR-26b inhibitor (10 nm). At 48 h after transfection, cell lysates were subjected to ChIP assays. C, RBL2H3 cells were transfected with the indicated mimic (10 nm each) prior to sensitization with DNP-specific IgE (100 ng/ml). The IgE-sensitized RBL2H3 cells were then stimulated with DNP-HSA (100 ng/ml) for 1 h. Cell lysates were subjected to ChIP assays. IP, immunoprecipitation.
FIGURE 10.
FIGURE 10.
miR-26a mimic and miR-26b mimic negatively regulate passive cutaneous anaphylaxis. A, BALB/c mice were given an intradermal injection of DNP-specific IgE antibody (0.5 μg/kg) along with an intravenous injection of control mimic (100 nm) or miR-26a mimic (100 nm). The next day, BALB/C mice were given an intravenous injection of PBS or DNP-HSA (250 μg/kg) along with 2% (v/v) Evans Blue solution. One hour after the injection, the extent of vascular permeability was determined as described. Means ± S.E. (error bars) of three independent experiments are depicted. Each experimental group consisted of five mice. ***, p < 0.0005. B, ear tissue lysates were subjected to qRT-PCR analysis to determine the expression of miR-26a, COX-2, and MIP-2. **, p < 0.005; ***, p < 0.0005. C, ear tissue lysates were subjected to Western blot analysis. D, same as C except that β-hexosaminidase activity assays were performed. **, p < 0.005. E, BALB/c mice were given an intradermal injection of DNP-specific IgE antibody (0.5 μg/kg) along with an intravenous injection of control mimic (100 nm) or miR-26b mimic (100 nm). The next day, BALB/c mice were given an intravenous injection of PBS or DNP-HSA (250 μg/kg) along with 2% (v/v) Evans Blue solution. One hour after the injection, the extent of vascular permeability was determined as described. Means ± S.E. of three independent experiments are depicted. Each experimental group consisted of five mice. ***, p < 0.0005. F, ear tissue lysates were subjected to Western blot analysis (top). Ear tissue lysates were also subjected to immunoprecipitation (IP), followed by Western blot analysis (bottom). G, same as F except that β-hexosaminidase activity assays were performed. ***, p < 0.0005. H, ear tissue lysates were subjected to qRT-PCR analysis to determine the expression of miR-26b, MIP-2, and COX-2. **, p < 0.005.
FIGURE 11.
FIGURE 11.
miR-26a mimic and miR-26b mimic negatively regulate passive systemic anaphylaxis. A, BALB/c mice were given intravenous injection of DNP-specific IgE (0.5 μg/kg) along with control mimic (100 nm) or miR-26a mimic (100 nm). The next day, BALB/c mice were given an intravenous injection of DNP-HSA (250 μg/kg). One hour after stimulation with DNP-HSA (250 μg/kg), lung tissue lysates were isolated from each mouse of each experimental group and were subjected to Western blot analysis or immunoprecipitated (IP) with the indicated antibody, followed by Western blot analysis. Lung tissue lysates were also subjected to qRT-PCR analysis to determine the expression of miR-26a and COX-2. **, p < 0.005; ***, p < 0.0005. B, immunohistochemistry staining employing lung tissue was performed as described. C, BALB/c mice were given intravenous injection of DNP-specific IgE (0.5 μg/kg) along with control mimic (100 nm) or miR-26b mimic (100 nm). The next day, BALB/c mice were given an intravenous injection of DNP-HSA (250 μg/kg). One hour after stimulation with DNP-HSA (250 μg/kg), lung tissue lysates were isolated from each mouse of each experimental group and were subjected to Western blot analysis (top) or immunoprecipitated with the indicated antibody, followed by Western blot analysis (bottom). D, lung tissue lysates were subjected to β-hexosaminidase activity assays. ***, p < 0.0005. E, lung tissue lysates were subjected to qRT-PCR to determine the expression level of miR-26b, MIP-2, and COX-2. **, p < 0.005; ***, p < 0.0005. F, immunohistochemistry staining employing anti-MIP-2 antibody was performed as described. Error bars, S.E.
FIGURE 12.
FIGURE 12.
miR-26a mimic negatively regulates PSA-promoted enhanced tumorigenic potential of B16F1 melanoma cells. A, BALB/c mice were sensitized to DNP-specific IgE (0.5 μg/kg) by an intravenous (i.v.) injection. The next day, BALB/c mice were given an intravenous injection of DNP-HSA (250 μg/kg). Each mouse received an injection of B16F1 melanoma cells (2 × 10⁵) on day 2 of the time line. BALB/c mice were given an intravenous injection with control mimic (100 nm) or miR-26a mimic (100 nm) on days 0, 5, 8, 11, and 14 of the time line. Fifteen days after the injection of B16F1 cells, the tumorigenic potential of B16F1 cells was determined. B, qRT-PCR analysis employing tumor tissue lysates was performed to determine the expression of miR-26a, COX-2, and MIP-2. **, p < 0.005; ***, p < 0.0005. NS, not significant. C, tumor tissue lysates from each experimental group were subjected to Western blot analysis and were also subjected to immunoprecipitation (IP) (2 μg/ml), followed by Western blot analysis. D, tumor tissue lysates were subjected to β-hexosaminidase activity assays. ***, p < 0.0005. E, the conditioned medium of lung mast cells after PSA induction was added to B16F1 cells for 24 h. Cell lysates were subjected to Western blot analysis. F, the conditioned medium of lung mast cells after PSA induction was added to B16F1 melanoma cells. An invasion assay was performed as described. ***, p < 0.0005. Error bars, S.E.
FIGURE 13.
FIGURE 13.
miR-26b mimic negatively regulates PSA-promoted enhanced tumorigenic potential of B16F1 melanoma cells. A, BALB/c mice were sensitized to DNP-specific IgE (0.5 μg/kg) by an intravenous (i.v.) injection. The next day, BALB/c mice were given an intravenous injection of DNP-HSA (250 μg/kg). Each mouse received an injection of B16F1 melanoma cells (subcutaneously; s.c.) (2 × 10⁵) on day 2 of the time line. BALB/c mice were given an intravenous injection with control mimic (100 nm) or miR-26b mimic (100 nm) on days 0, 5, 8, 11, and 14 of the time line. Fifteen days after the injection of B16F1 cells, the tumorigenic potential of B16F1 cells was determined. B, qRT-PCR analysis employing tumor tissue lysates was performed to determine the expression of miR-26b, COX-2, and MIP-2. **, p < 0.005; ***, p < 0.0005. C, tumor tissue lysates from each experimental group were subjected to Western blot analysis and were also subjected to immunoprecipitation (2 μg/ml), followed by Western blot analysis. D, tumor tissue lysates were subjected to β-hexosaminidase activity assays. **, p < 0.005; ***, p < 0.0005. E, the conditioned medium of lung mast cells after PSA induction was added to B16F1 melanoma cells for 24 h. Cell lysates were subjected to Western blot analysis. F, the conditioned medium of lung mast cells after PSA induction was added to B16F1 cells. An invasion assay was performed as described. ***, p < 0.0005. Error bars, S.E.
FIGURE 14.
FIGURE 14.
miR-26a mimic and miR-26b mimic prevent an interaction between mast cells and macrophages during allergic inflammation. A, BALB/c mice were given an intravenous (i.v.) injection of DNP-specific IgE (0.5 μg/kg) along with miR-26a mimic (100 nm) or miR-26b mimic (100 nm). The next day, BALB/c mice were given an intravenous injection of DNP-HSA (250 μg/kg). One day after the injection of DNP-HSA, lung tissue was harvested. B, lung mast cells were isolated from lung tissue, and cell lysates were subjected to Western blot analysis or immunoprecipitated (IP) with the indicated antibody, followed by Western blot analysis. C, the expression level of miR-26a or miR-26b was also determined by qRT-PCR. ***, p < 0.0005. D, the conditioned medium of lung mast cells, isolated from each mouse of the experimental group, was added to lung macrophages for 24 h, and Western blot analysis was performed. E, BALB/c mice were injected with scrambled (Scr.) (100 nm) or COX-2 siRNA (100 nm) via the tail vein. The next day, BALB/c mice were injected with DNP-specific IgE (0.5 μg/kg) via the tail vein. The following day, BALB/c mice were injected intravenously with DNP-HSA (250 μg/kg) or PBS. Two hours after the injection of DNP-HSA, lung macrophage lysates were isolated and subjected to Western blot analysis. F, the conditioned medium of lung macrophages after PSA induction was added to lung mast cells for 24 h, followed by Western blot, immunoprecipitation, and β-hexosaminidase activity assays in lung mast cells. ***, p < 0.0005. Error bars, S.E.
FIGURE 15.
FIGURE 15.
miR-26a mimic and miR-216b mimic negatively regulate PSA-promoted enhanced angiogenic potential of mast cells. A, PSA employing BALB/c mouse was performed in the absence or presence of miR-26a mimic (100 nm) or miR-26 mimic (100 nm). Lung mast cells were isolated from lung tissue. The conditioned medium of lung mast cells was mixed with Matrigel, followed by intravital microscopy performed as described. *, p < 0.05; ***, p < 0.0005. B, same as A except that Matrigel plug assays were performed. Hemoglobin content was determined as described. ***, p < 0.0005. C, the conditioned medium of lung mast cells isolated after PSA in the absence or presence of miR-26a mimic or miR-26 mimic was added to mouse lung endothelial cells (MLECs) for 1 h, followed by Western blot analysis. Error bars, S.E.
FIGURE 16.
FIGURE 16.
COX-2 is necessary for PSA-promoted enhanced metastatic potential of B16F1 melanoma cells and is necessary for an interaction between cancer cells and mast cells. A, BALB/c mice were sensitized to DNP-specific IgE (0.5 μg/kg) by an intravenous (i.v.) injection. The next day, BALB/c mice were given an intravenous injection of DNP-HSA (250 μg/kg). Each mouse received an injection of B16F1 melanoma cells (2 × 10⁵) on day 3 of the time line. BALB/c mice were given an intravenous injection with the indicated siRNA (100 nm) on days 1, 5, and 7 of the time line. On day 12 of the time line, lung tissues were harvested. Formalin-fixed lung sections were stained with H&E. Black arrows, lung metastatic foci (scale bar, 100 μm). The extent of lung metastasis was determined as described. ***, p < 0.0005. B, lung tumor tissue lysates were isolated from each mouse of each experimental group of mice and were subjected to Western blot analysis (top). Lung tumor lysates isolated from each mouse of each experimental group of mice were immunoprecipitated (IP) with the indicated antibody, followed by Western blot analysis (bottom). C, immunohistochemistry staining employing lung tumor tissues was performed as described. D, lung tumor tissue lysates were isolated and subjected to β-hexosaminidase activity assays. **, p < 0.005; ***, p < 0.0005. E, B16F10 cells were transfected with the indicated siRNA (each at 10 nm). At 48 h after transfection, cell lysates were subjected to Western blot analysis. F, the conditioned medium of B16F10 cells obtained after transfection with the indicated siRNA was added to lung mast cells. At 24 h after the addition of the conditioned medium, β-hexosaminidase activity assay, Western blot analysis, and immunoprecipitation were performed. ***, p < 0.0005. Error bars, S.E.
FIGURE 17.
FIGURE 17.
Regulatory role of the miR-26a/-26b-COX-2-MIP-2 loop in allergic inflammation.

Similar articles

Cited by

References

    1. Jeon C. M., Shin I. S., Shin N. R., Hong J. M., Kwon O. K., Kim H. S., Oh S. R., Myung P. K., Ahn K. S. (2014) Siegesbeckia glabrescens attenuates allergic airway inflammation in LPS-stimulated RAW 264.7 cells and OVA induced asthma murine model. Int. Immunopharmacol. 22, 414–419 - PubMed
    1. Huang W. C., Chai C. Y., Chen W. C., Hou M. F., Wang Y. S., Chiu Y. C., Lu S. R., Chang W. C., Juo S. H., Wang J. Y., Chang W. C. (2011) Histamine regulates cyclooxygenase 2 gene activation through Orai1-mediated NFκB activation in lung cancer cells. Cell Calcium 50, 27–35 - PubMed
    1. Shiraishi Y., Asano K., Niimi K., Fukunaga K., Wakaki M., Kagyo J., Takihara T., Ueda S., Nakajima T., Oguma T., Suzuki Y., Shiomi T., Sayama K., Kagawa S., Ikeda E., Hirai H., Nagata K., Nakamura M., Miyasho T., Ishizaka A. (2008) Cyclooxygenase-2/prostaglandin D2/CRTH2 pathway mediates double-stranded RNA-induced enhancement of allergic airway inflammation. J. Immunol. 180, 541–549 - PubMed
    1. Passos G. F., Medeiros R., Marcon R., Nascimento A. F., Calixto J. B., Pianowski L. F. (2013) The role of PKC/ERK1/2 signaling in the anti-inflammatory effect of tetracyclic triterpene euphol on TPA-induced skin inflammation in mice. Eur. J. Pharmacol. 698, 413–420 - PubMed
    1. Morin C., Fortin S., Cantin A. M., Rousseau É. (2013) MAG-EPA resolves lung inflammation in an allergic model of asthma. Clin. Exp. Allergy 43, 1071–1082 - PubMed

Publication types

MeSH terms