. 2015 Apr 24:6:6956.
doi: 10.1038/ncomms7956.

Enterobacteria-secreted particles induce production of exosome-like S1P-containing particles by intestinal epithelium to drive Th17-mediated tumorigenesis

Affiliations

Enterobacteria-secreted particles induce production of exosome-like S1P-containing particles by intestinal epithelium to drive Th17-mediated tumorigenesis

Zhongbin Deng et al. Nat Commun. .

Erratum in

Abstract

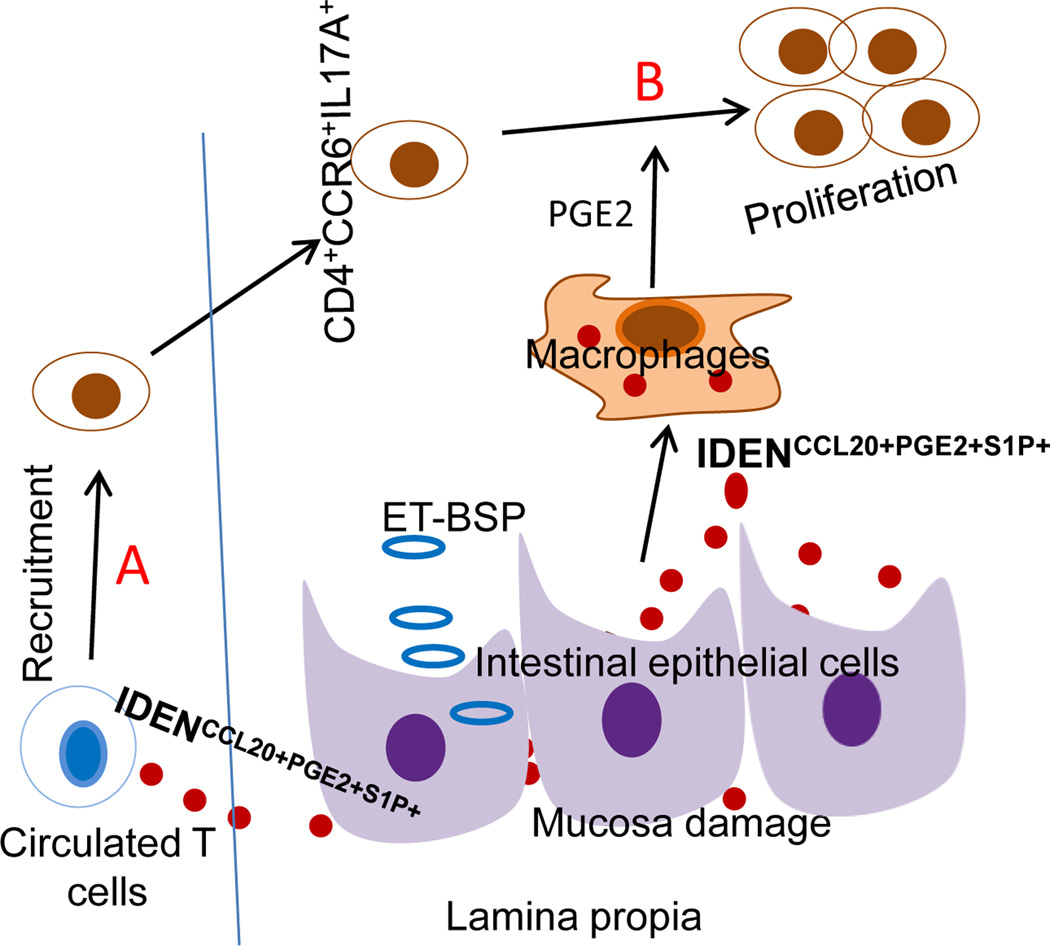
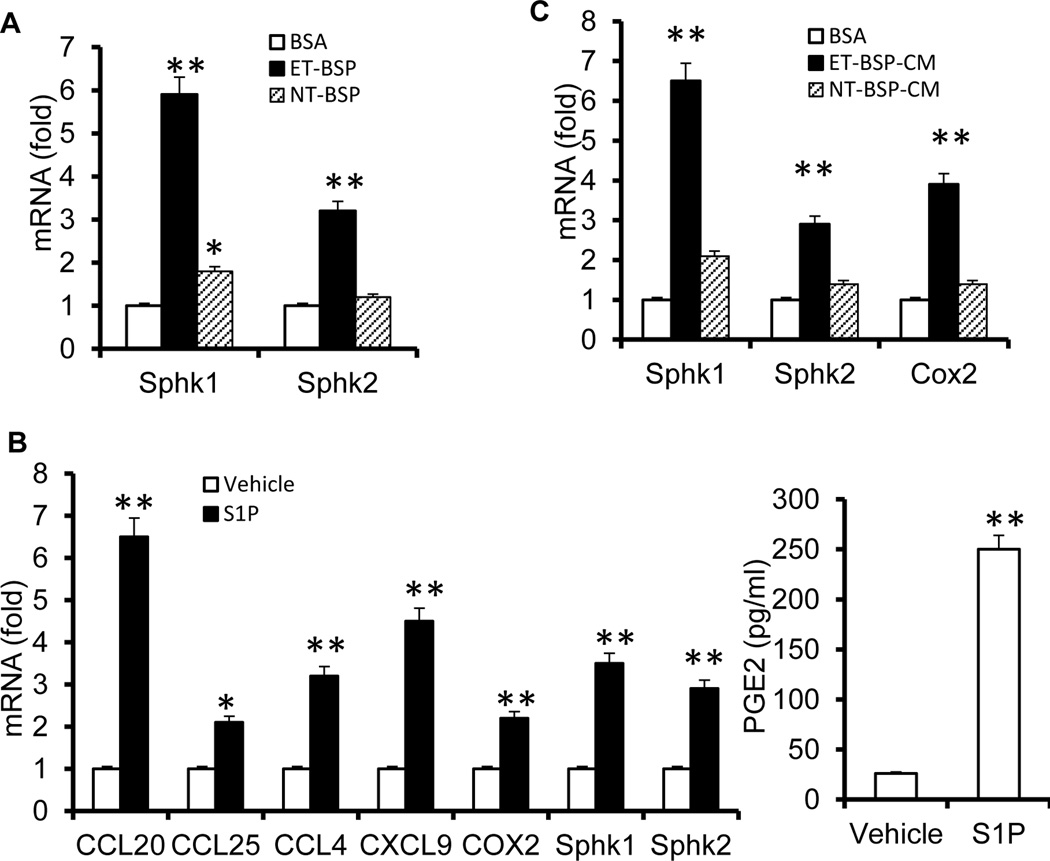
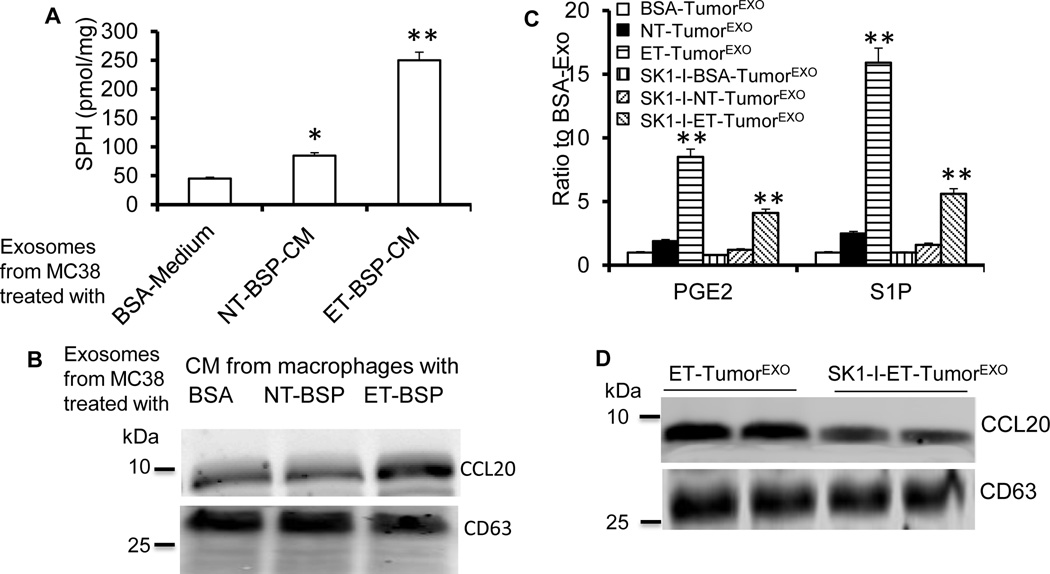
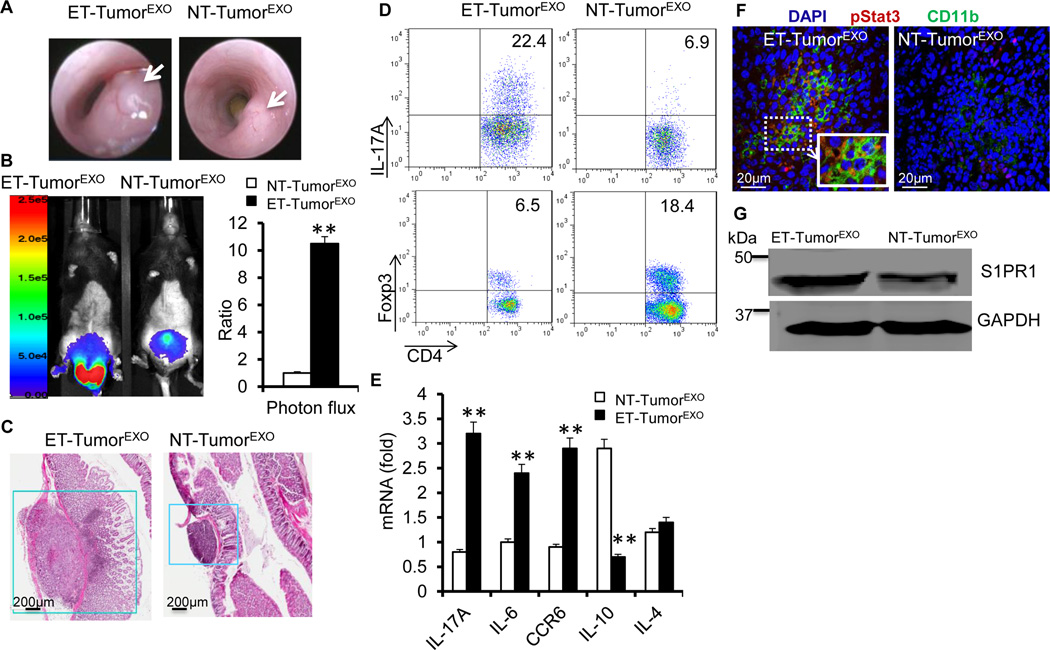
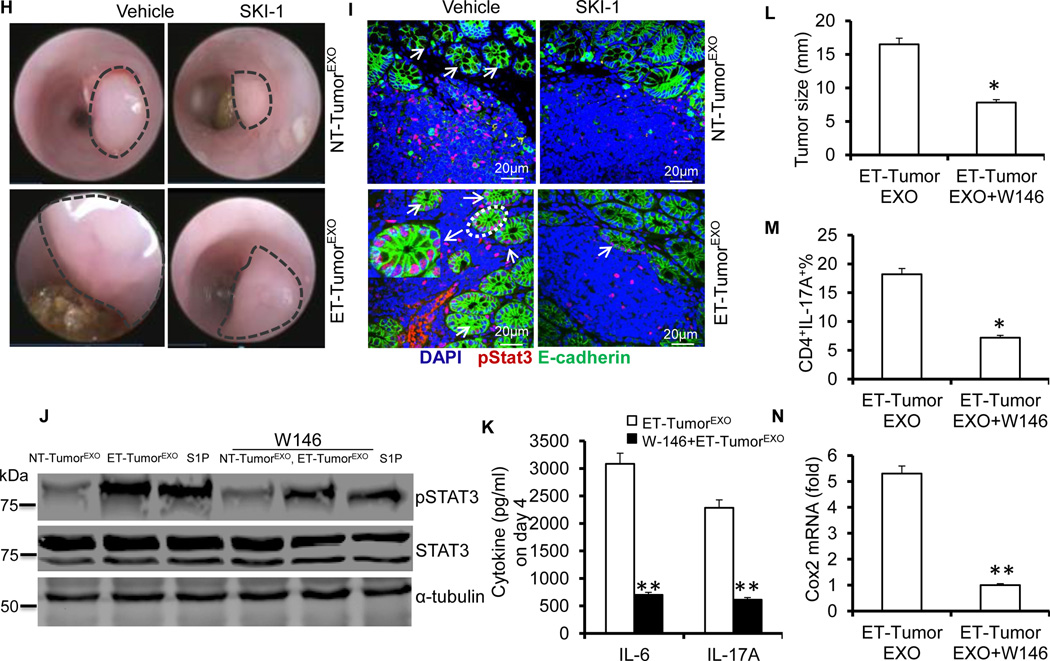
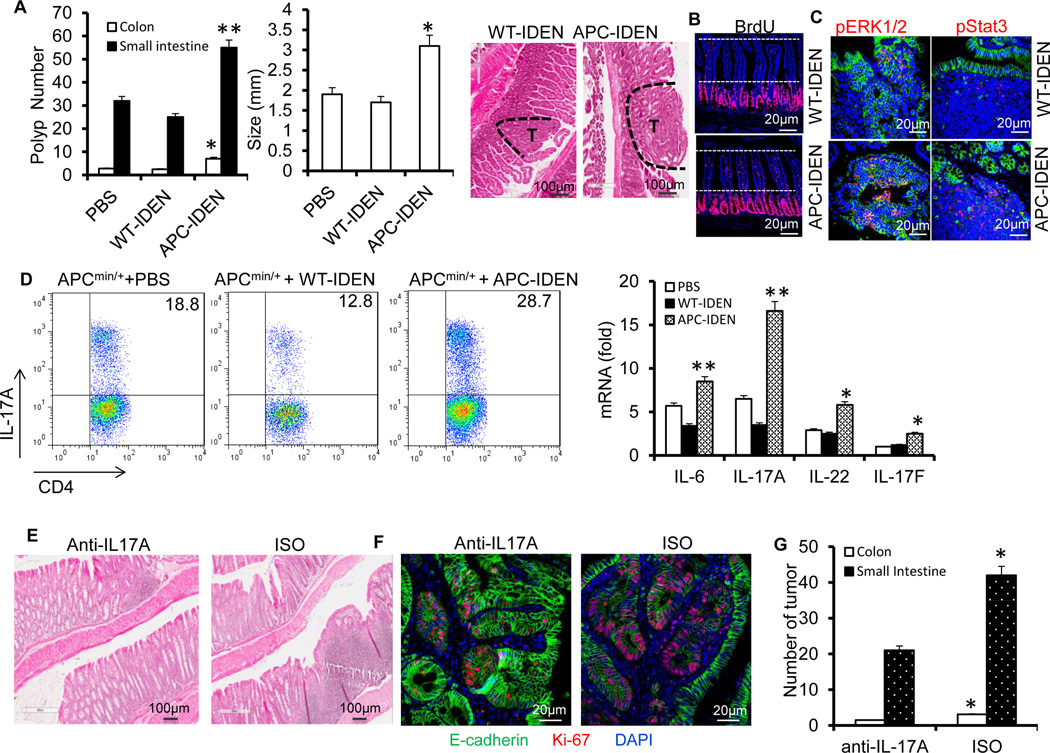
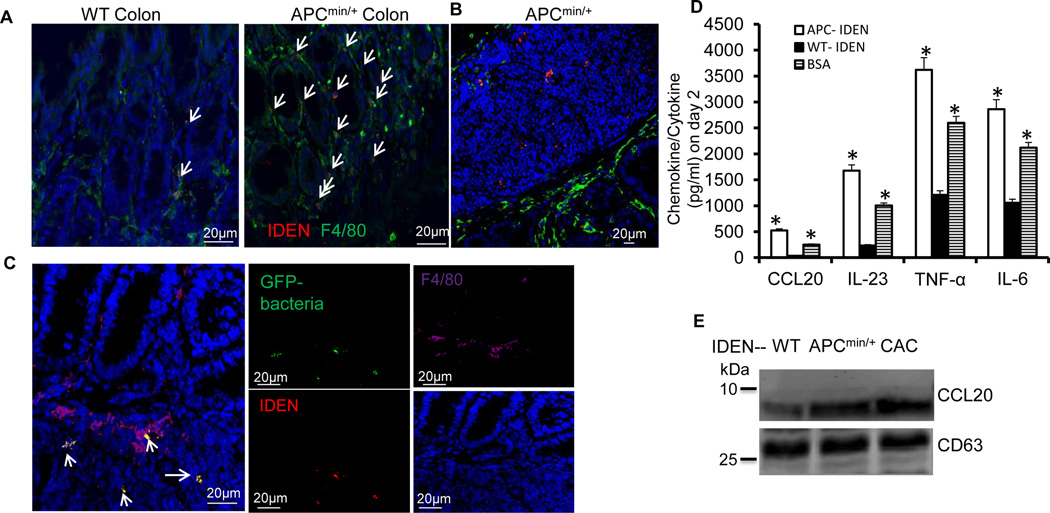
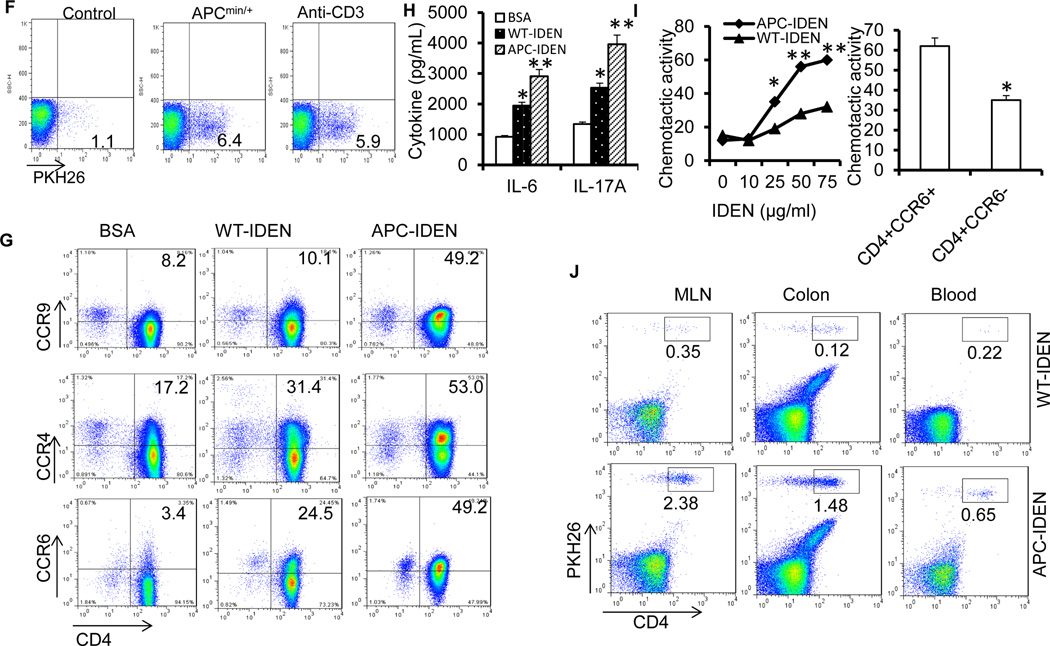
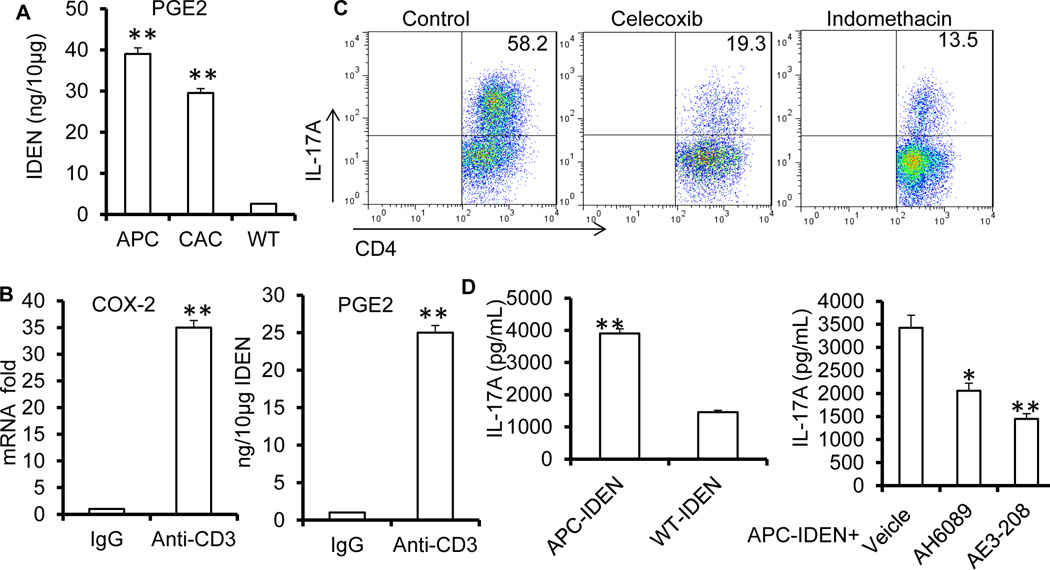
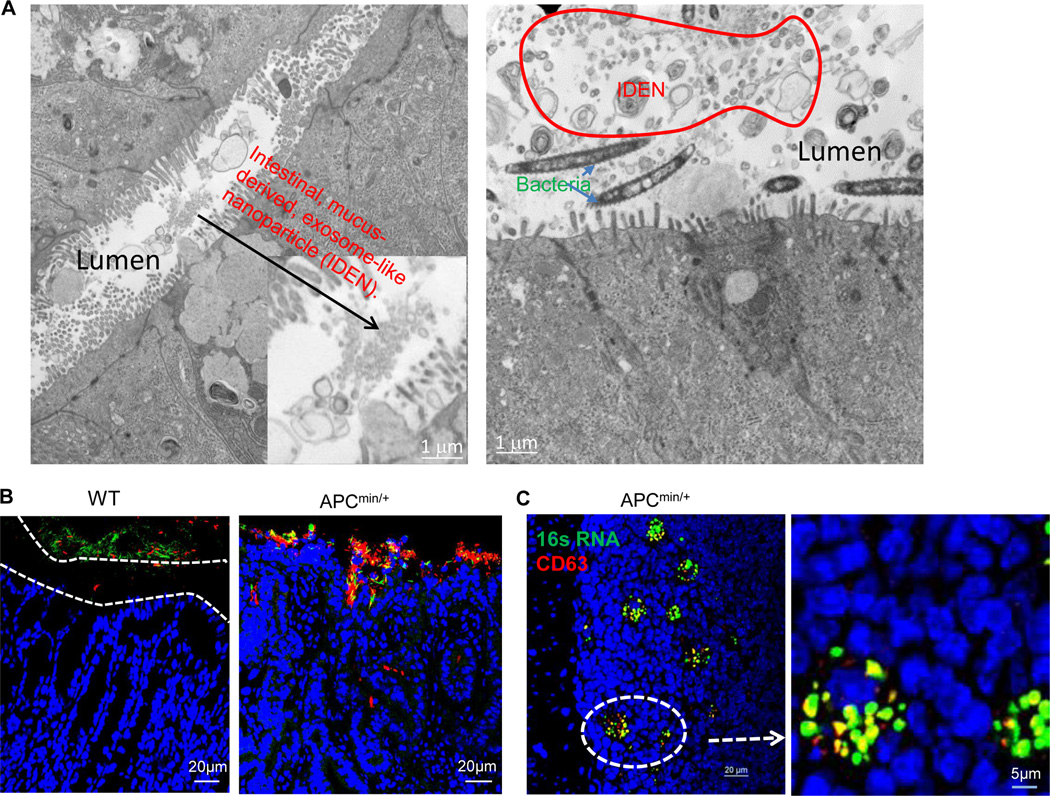
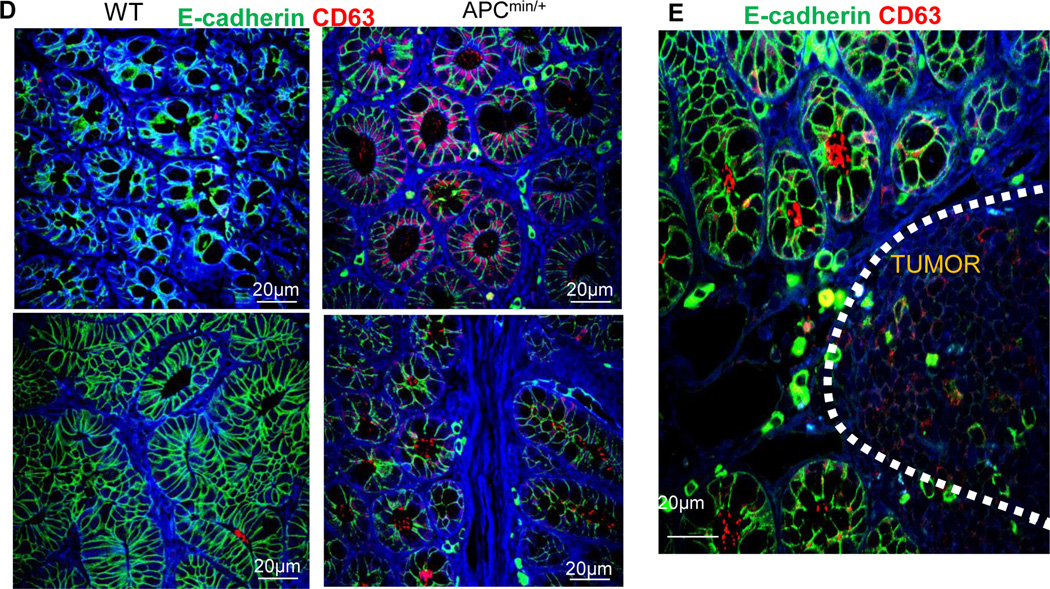
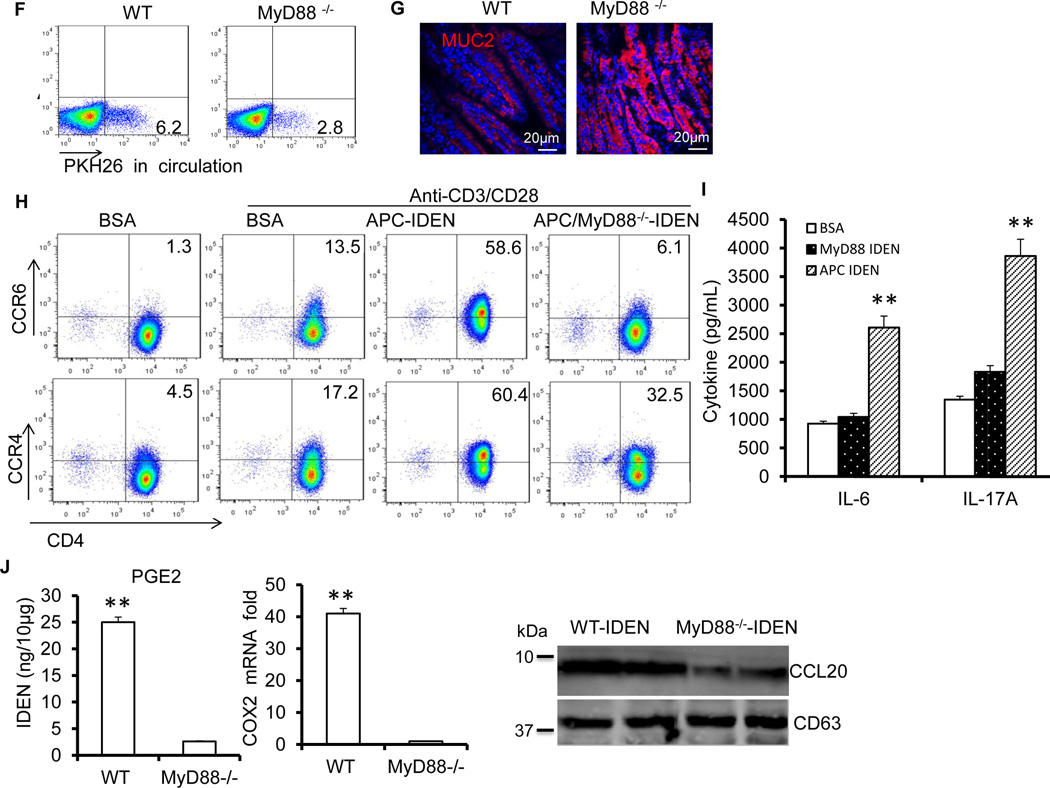
Gut-associated inflammation plays a crucial role in the progression of colon cancer. Here, we identify a novel pathogen-host interaction that promotes gut inflammation and the development of colon cancer. We find that enteropathogenic bacteria-secreted particles (ET-BSPs) stimulate intestinal epithelium to produce IDENs (intestinal mucosa-derived exosome-like nanoparticles) containing elevated levels of sphingosine-1-phosphate, CCL20 and prostaglandin E2 (PGE2). CCL20 and PGE2 are required for the recruitment and proliferation, respectively, of Th17 cells, and these processes also involve the MyD88-mediated pathway. By influencing the recruitment and proliferation of Th17 cells in the intestine, IDENs promote colon cancer. We demonstrate the biological effect of sphingosine-1-phosphate contained in IDENs on tumour growth in spontaneous and transplanted colon cancer mouse models. These findings provide deeper insights into how host-microbe relationships are mediated by particles secreted from both bacterial and host cells.


Figures

Figure 1
Figure 1. Proposed pathways lead to overproduction of CD4+CCR6+IL17A+
(A). ET-BSP uptake by intestinal epithelial cells leads to induction of IDENCCL20+PGE2+S1P+. Due to increasing gut permeability or mucosa damage, released IDENCCL20+PGE2+SIP+ subsequently migrate into the peripheral blood and induce CCR6 expression on CD4 T cells, which results in more CD4+CCR6+IL17A+ cells being recruited into intestinal tissue. (B) Uptake of IDENCCL20+PGE2+S1P+ by intestinal macrophages results in induction of PGE2, which then promotes more production of CD4+CCR6+IL17A+.
Figure 2
Figure 2. ET-BSPs and S1P upregulate genes that encode sphingolipids and chemokines
Molecules expressed in MC38 cells (A and B). MC38 colon cancer cells were cultured with BSA, NT-BSPs or ET-BSPs (20 µg/ml) (A) or with vehicle/S1P (B) for 18 h. Real-time PCR analysis of gene expression (A; B, left panel) and ELISA analysis of PGE2 (right panel) in the supernatants. The data represent means ± SEMs. *p < 0.05, **p < 0.01 (Student’s t-test). (C) MC38 cells were cultured with conditioned medium from colonic macrophages treated with BSA, NT-BSPs or ET-BSPs, and the expression of the indicated genes was measured by qPCR. The data represent means ± SEMs (n = 5). *p < 0.05, **p < 0.01 (Student’s t-test).
Figure 3
Figure 3. Bacteria-secreted particles mediate the induction of CCL20+PGE2+S1P+ exosomes
(A–B) MC38 cells were cultured with conditioned medium (CM) from macrophages treated with BSA, NT-BSPs or ET-BSPs (20 µg/ml), and the levels of SPH (A) and CCL20 (B) in tumor exosomes were assessed by LC-MS/MS (A) or Western blot (B). The data represent means ± SEMs (n = 5). *p < 0.05, **p < 0.01 (Student’s t-test). (C) Changes in the ratio of S1P and PGE2 in exosomes released from MC38 cells pre-treated with BSA, NT-BSPs or ET-BSPs in the absence or presence of SphK1 inhibitor (SK1-I, 5 µM) for 48 h. The data represent means ± SEMs. **p < 0.01 (Student’s t-test). (D) Western blot analysis of CCL20 in exosomes derived from (C).
Figure 4
Figure 4. ET-TumorEXO accelerates tumor growth by modulating Stat3 signaling
(A–C) C57BL/6 mice were orthotopically implanted with MC38-luc cells with exosomes by colonic submucosal injection. Colonoscopy image of implanted MC38-luc cells at day 18 after injection (A), photon flux from C57BL/6 mice harboring MC38-luc tumors (B), and H&E-stained colon sections (C). The data (B) represent means ± SEMs **p < 0.01 (Student’s t-test). (D) Colonic MC38 tumor leukocytes were isolated at day 18 post treatment from mice treated with ET-TumorEXO or NT-TumorEXO. TCRβ+ CD4+ IL-17A+ and FoxP3+ Treg cell populations were examined by FACS. (E) RT-PCR analysis of the gene expression in colonic MC38 tumor leukocytes isolated at day 18 from mice treated with ET-TumorEXO or NT-TumorEXO. (F–G) Confocal images of colon sections stained with p-Stat3 and CD11b from naïve mice treated with ET-TumorEXO or NT-TumorEXO (F); Western blotting the lysates of colonic CD11b+ cells for S1PR1 (G). (H and I) Mice were orthotopically implanted with MC38 cells mixed with exosomes from MC38 cells with or without SK1-I. Colonoscopy image of MC38 tumor size (H); confocal images of colon sections stained with p-Stat3 and E-cadherin (I). (J) Western blotting showing p-Stat3 proteins in LPLs stimulated by anti-CD3 (5 µg/ml) and CD28 (2 µg/ml) antibodies in the presence of NT-TumorEXO, ET-TumorEXO (50 µg/ml) or S1P (100 nM) with or without W146 (20 nM) for 24 h. (K) ELISA analysis of IL-6 and IL-17A in the supernatants of LPLs stimulated with anti-CD3 and CD28 antibodies in the presence of ET-TumorEXO (50 µg/ml) with or without W146 (20 nM) after 4 days in culture. (L–N) Mice were orthotopically implanted with MC38 cells mixed with ET-tumor exosomes and treated with or without W146. Tumor size (L), number of CD4+IL-17A+ cells in the colon (N), expression of COX2 in the colon (N). The data (E, K–N) represent means ± SEMs (n = 5). *p < 0.05, **p < 0.01 (Student’s t-test).
Figure 5
Figure 5. APC-IDENs promote tumor growth by inducing CCR6+CD4+Th17+ cells
(A–C) APCmin/+ mice at six weeks of age were gavaged with IDENs once every three days for eight weeks. (A) Number and size of tumors and H&E-stained sections from 3-month-old APCMin/+ mice. (B) Mice were injected intraperitoneally (i.p.) with 50mg/kg of 5’-bromo-2’-deoxyuridine (BrdU) in PBS 24 h before small intestine harvest. BrdU antibody–stained small intestine sections. (C) A sectioned tumor was stained with anti-phospho-ERK antibody (red) or phospho-STAT3 (red) and E-cadherin (green). The data (A) represent means ± SEMs (n = 8). *p < 0.05, **p < 0.01 (Student’s t-test). (D) FACS analysis of IL-17A+ on CCR6+CD4+ T cells and real-time PCR for cytokine mRNAs in LPL CCR6+CD4+ T cells. The data represent means ± SEMs (n = 5). *p < 0.05, **p < 0.01 (Student’s t-test). (E–G) APCmin/+ mice gavaged with IDENs were treated with an anti-IL17A antibody or isotype. Representative photomicrographs of HE-stained colon sections (E), immunofluorescent staining of colon sections with anti-E-cadherin and Ki67 (F), and number of tumors (G).
Figure 6
Figure 6. APC-IDENs and macrophageAPC-IDEN+ recruit CCR6+CD4+Th17+ to the gut
(A–C) Confocal images of F4/80 immuno-stained frozen colon sections prepared 5 h after gavaging mice with PKH26-labeled IDENs (red). Non-tumor (A) and tumor (B) colon sections from APCmin/+ mice. (C) Confocal images of the co-localization of macrophages (purple), IDENs (red), and bacteria (green) in SI tissue sections from APCmin/+ mice gavaged with IDENs and bacteria tagged with GFP. (D) ELISA analysis of CCL20, IL-23, TNF-α, and IL-6 in the supernatants of macrophages cultured for 2 days in the presence of bacterial lysate and WT-IDENs, APC-IDENs or BSA. (E) Western blot analysis of IDEN CCL20 from normal (WT), APCmin/+ or CAC mice. (F) FACS analysis of PKH26+ cells in peripheral blood from naïve mice, APCmin/+ mice or anti-CD3-treated mice after gavage with PKH26-labeled IDENs. (G) Chemokine receptors induced on naïve CD4+ T cells under Th17+ cell culture conditions in the presence of BSA or IDENs. (H) ELISA analysis of IL-6 and IL-17A in the supernatants from (G). (I) Chemotactic responses of APCmin/+ mouse CD4+ T cells to IDENs (left) or the migration of CCR6+/+ versus CCR6−/− CD4+ T cells to APC-IDENs (right) in vitro. (J) CD4+ T cells cultured under Th17+ cell culture conditions in the presence of IDENs were labeled with PKH26 and adoptively transferred intravenously into DSS-treated SCID mice. The cells were then isolated from the MLN, colon and blood for the FACS analysis of PKH26+CD4+ T cells. The data (D, H, I) represent means ± SEMs (n=5). *p < 0.05, **p < 0.01 (Student’s t-test).
Figure 7
Figure 7. APC-IDEN PGE2 plays a role in the accumulation of intestinal CD4+Th17+ cells
(A) ELISA analysis of PGE2 in IDENs isolated from WT, APCmin/+ or CAC mice. (B) COX2 expressed in the small intestine and the levels of IDEN PGE2 after anti-CD3 antibody treatment. (C) FACS analysis of CD4+Th17+ cells in the duodenum after treatment with CD3-specific antibody with or without the COX2 inhibitors celecoxib or indomethacin. (D) ELISA analysis of IL-17A in supernatants from naïve CD4+ T cells under Th17+ cell culture conditions in the presence of APC-IDENs with or without AH6809 or ONO-AE3-208. The data represent means ± SEMs (n=5). *p < 0.05, **p < 0.005 (Student’s t-test).
Figure 8
Figure 8. MyD88 plays a role in the APC-IDEN–mediated induction of CCR6+CD4+Th17+ cells
(A) Electron microscopy images of IDENs in the colons of wild-type B6 mice. (B–C) Confocal images of 16S RNA and CD63. CD63 (red) and bacterial 16S RNA (green) inhabiting loose mucous layers in colon tissue (B) and APCmin/+ lymphoid follicles (C). (D–E) Confocal images of APCmin/+ mouse CD63 in the epithelial lumen (D; top), the lumen of the crypts (D; bottom) and tumor tissue (E). (F–G) WT and MyD88−/− mice were treated with CD3-specific antibodies. FACS analysis of PKH26+ cells in the peripheral blood after gavage with PKH26-labeled IDENs (F), confocal images of small intestine sections stained with mucin-2-specific antibody (G). (H–I) Under Th17 cell culture conditions, naïve CD4+ T cells were cultured in the presence of BSA or IDENs. FACS analysis of the induced chemokine receptors (H) and ELISA of the production of cytokines (I). (J) ELISA analysis of IDEN PGE2 (Left panel) and real-time PCR analysis of COX2 (Middle panel) from the small intestine, and a Western blot analysis of CCL20 in IDENs from mice treated with CD3-specific antibody (Right panel). The data (I and J) represent means ± SEMs (n=3). **p < 0.01 (Student’s t-test).

References

    1. Esplugues E, et al. Control of TH17 cells occurs in the small intestine. Nature. 2011;475:514–518. - PMC - PubMed
    1. Webber JP, et al. Differentiation of tumour-promoting stromal myofibroblasts by cancer exosomes. Oncogene. 2014 - PubMed
    1. Zhang HG, Grizzle WE. Exosomes: a novel pathway of local and distant intercellular communication that facilitates the growth and metastasis of neoplastic lesions. The American journal of pathology. 2014;184:28–41. - PMC - PubMed
    1. Deng ZB, et al. Exosome-like nanoparticles from intestinal mucosal cells carry prostaglandin E2 and suppress activation of liver NKT cells. Journal of immunology. 2013;190:3579–3589. - PMC - PubMed
    1. Deng ZB, et al. Intestinal mucus-derived nanoparticle-mediated activation of Wnt/beta-catenin signaling plays a role in induction of liver natural killer T cell anergy in mice. Hepatology. 2013;57:1250–1261. - PMC - PubMed

Publication types

MeSH terms

LinkOut - more resources