. 2015 Apr 24;16(1):83.
doi: 10.1186/s13059-015-0628-y.

A depauperate immune repertoire precedes evolution of sociality in bees

Affiliations

A depauperate immune repertoire precedes evolution of sociality in bees

Seth M Barribeau et al. Genome Biol. .

Abstract

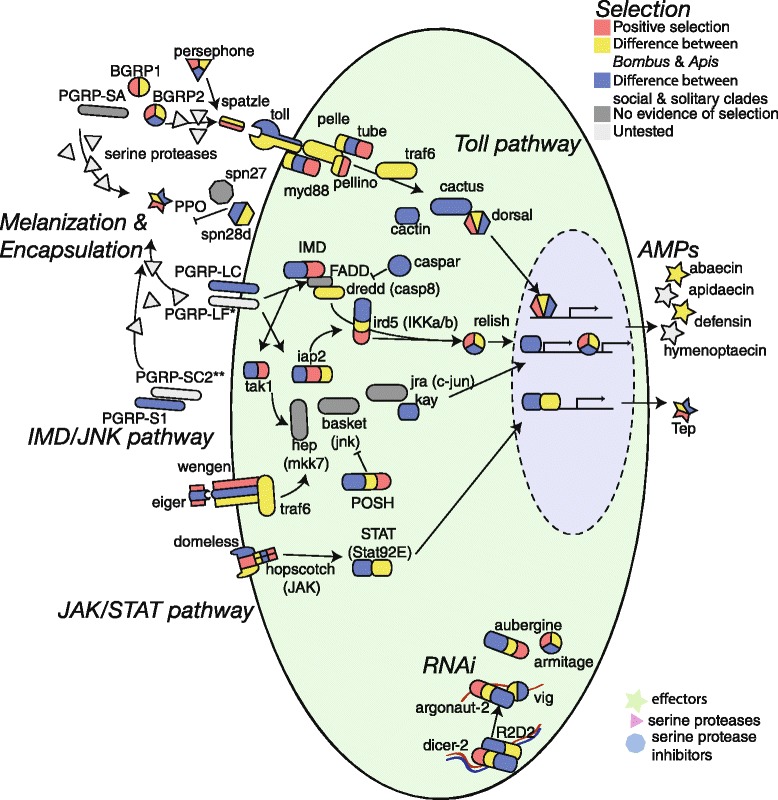
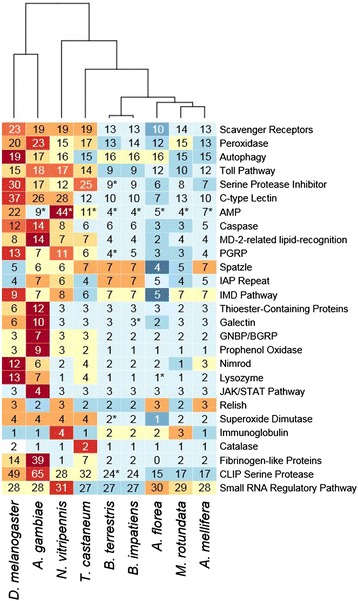
Background: Sociality has many rewards, but can also be dangerous, as high population density and low genetic diversity, common in social insects, is ideal for parasite transmission. Despite this risk, honeybees and other sequenced social insects have far fewer canonical immune genes relative to solitary insects. Social protection from infection, including behavioral responses, may explain this depauperate immune repertoire. Here, based on full genome sequences, we describe the immune repertoire of two ecologically and commercially important bumblebee species that diverged approximately 18 million years ago, the North American Bombus impatiens and European Bombus terrestris.

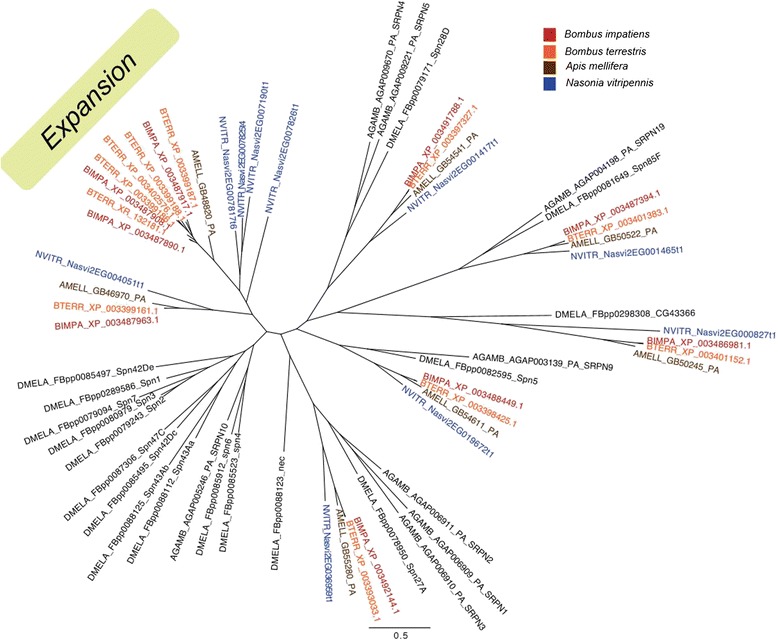
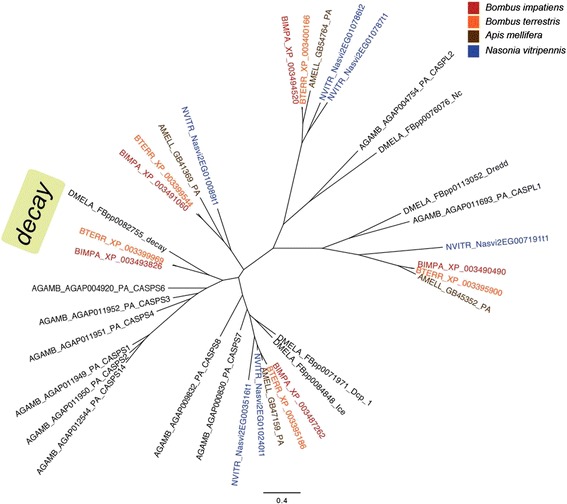
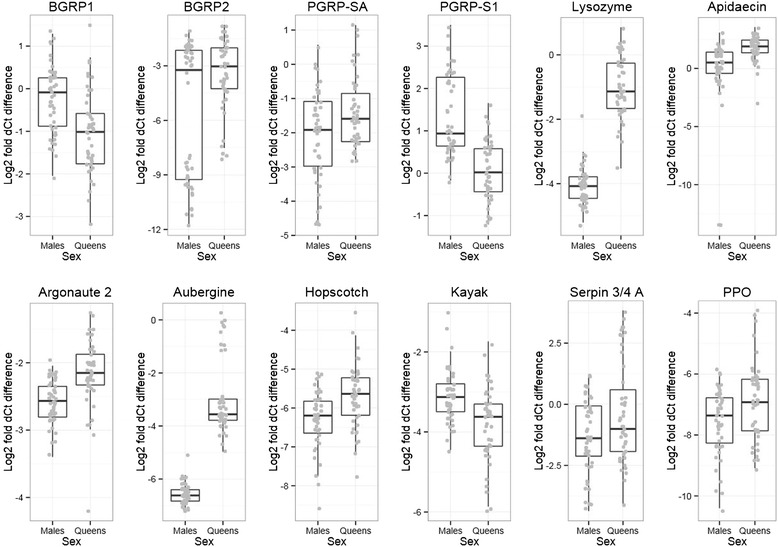
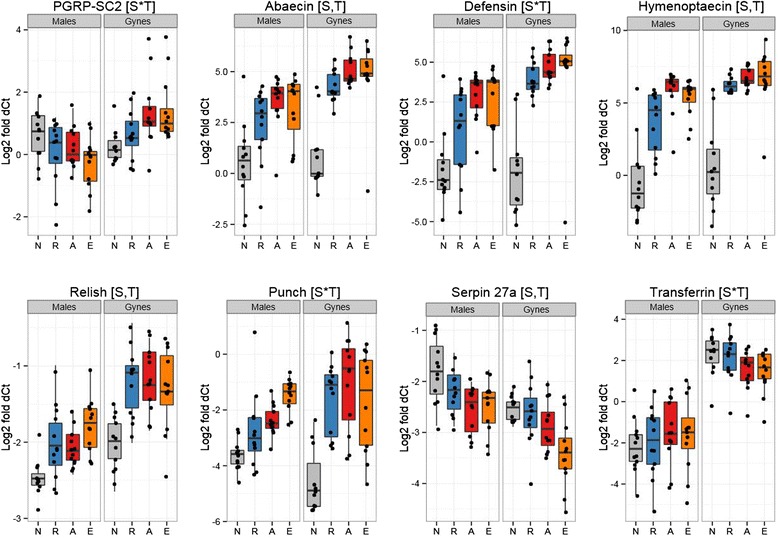
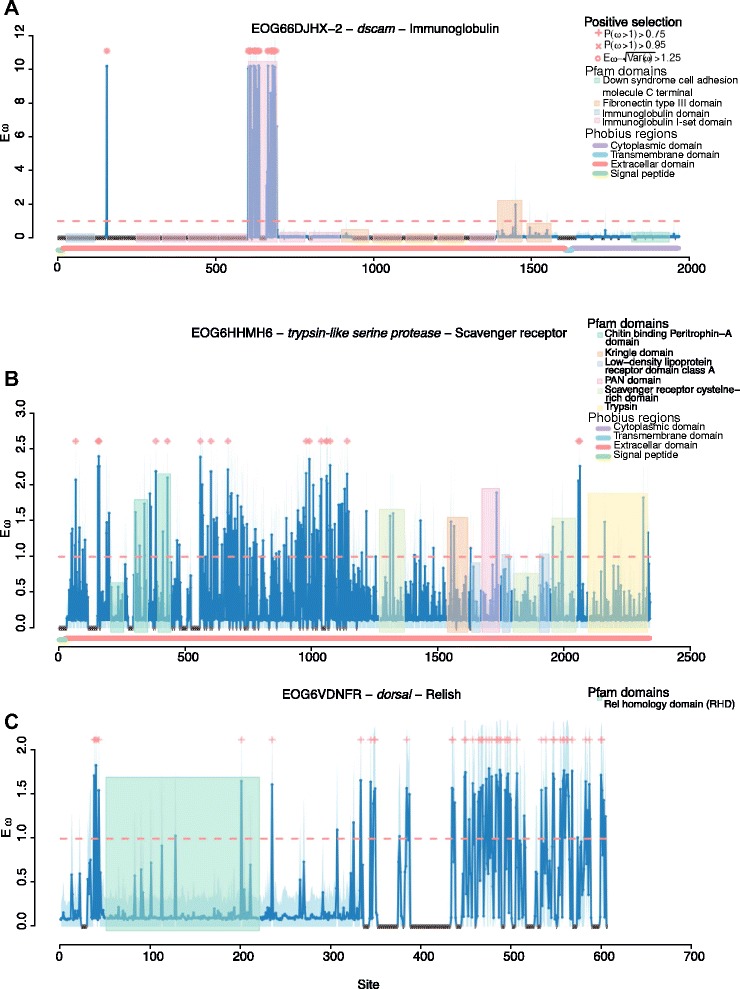
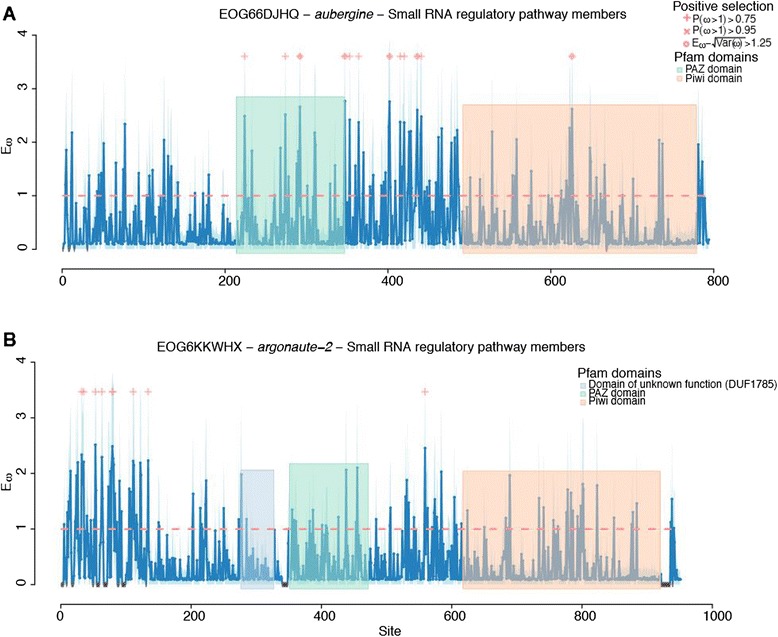
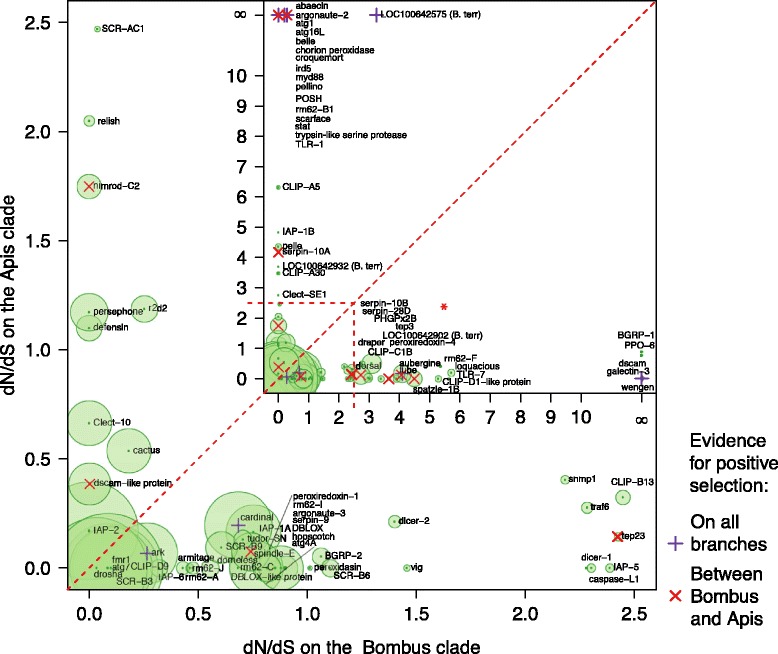
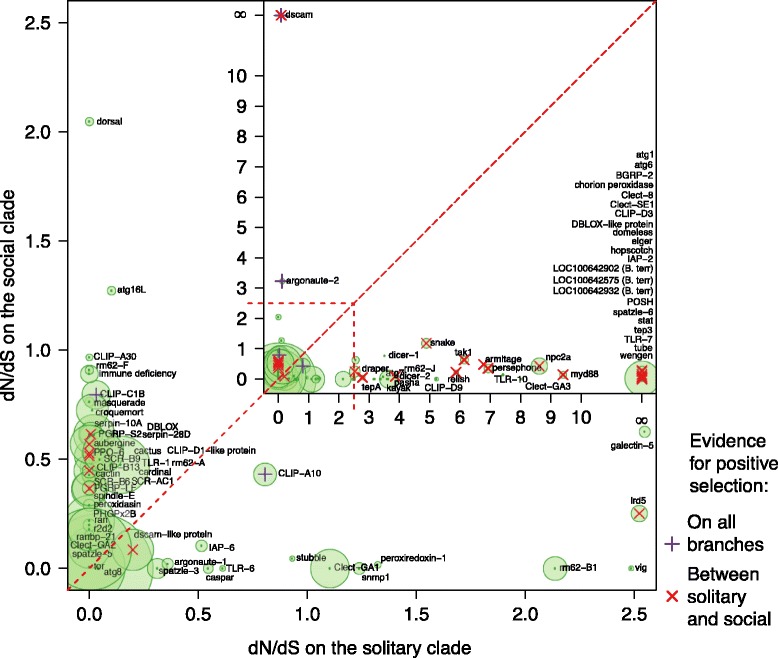
Results: We find that the immune systems of these bumblebees, two species of honeybee, and a solitary leafcutting bee, are strikingly similar. Transcriptional assays confirm the expression of many of these genes in an immunological context and more strongly in young queens than males, affirming Bateman's principle of greater investment in female immunity. We find evidence of positive selection in genes encoding antiviral responses, components of the Toll and JAK/STAT pathways, and serine protease inhibitors in both social and solitary bees. Finally, we detect many genes across pathways that differ in selection between bumblebees and honeybees, or between the social and solitary clades.

Conclusions: The similarity in immune complement across a gradient of sociality suggests that a reduced immune repertoire predates the evolution of sociality in bees. The differences in selection on immune genes likely reflect divergent pressures exerted by parasites across social contexts.


Figures

Figure 1
Figure 1
Diagram of the classical insect immune responses to parasites: Toll, IMD/JNK, JAK/STAT pathways and the melanization and antiviral RNA interference responses. Colors of the genes indicate evidence of selection as detected by either positive selection (across the four taxa phylogeny, on the branch between Bombus and Apis, the branch leading to Bombus, Apis, or Megachile) in red, or differences in selection between Bombus and Apis (yellow), or between the social and solitary clades (blue). More complete information about selection on these genes can be found in Additional files 8, 9, 10 and 11. *PGRP-LF is only found in B. impatiens. **PGRP-SC2 is not among the automated predictions for B. terrestris, although sequence in the trace archive suggests that it is present. We also detect expression of PGRP-SC2 in B. terrestris. AMP, anti-microbial peptide.
Figure 2
Figure 2
Number of genes belonging to 27 families of immune genes from OrthoDB. The colors in this heatmap reflect the number of genes in that category relative to the other species. Numbers with asterisks were manually adjusted according to our annotation efforts or the literature. The tree represents a clustering analysis using Euclidean distances based on the number of genes within these groups.
Figure 3
Figure 3
Gene tree of serine protease inhibitors showing the expansion within Bombus (green box). Hymenopteran species are labeled by color and Dipterans are labeled black.
Figure 4
Figure 4
Gene tree of caspases showing the Bombus genes that appear similar to D. melanogaster decay (green box). Hymenopteran species are labeled by color and Dipterans are labeled black.
Figure 5
Figure 5
Logfold gene expression relative to invariant housekeeping genes in males and young queens (gynes). All genes shown here are significantly differentially expressed between the sexes. Full details of these statistics can be found in the supplemental materials.
Figure 6
Figure 6
Logfold gene expression relative to invariant housekeeping genes in males and gynes according to treatment (x-axis: N, naïve; R, Ringer injection; A, Arthrobacter globiformis injection; E, Escherichia coli injection). Next to the gene name we depict whether the expression differed significantly according to sex (S), treatment (T), or the interaction between sex and treatment (S*T). Full details of these statistics can be found in the supplemental materials.
Figure 7
Figure 7
Sites under selection within the Apis, Bombus phylogeny for three genes of interest. The title for each gene presents the OrthoDB accession, the gene name, and the immune category. We only present a subset of the genes that showed an overall signature for selection highlighting codons at three different significance thresholds: Bayesian posterior probability >0.75 (plus signs along the top of each panel), >0.95 (x’s), and where Eω - sqrt(Var(ω)) > 1.25 (circles). The blue shadow indicates an estimate of error at each codon. We show Pfam domains in colored blocks and Phobius regions along the x-axis. Crosshatched regions were trimmed from the alignment.
Figure 8
Figure 8
Sites under selection within the Apis, Bombus phylogeny for two viral response genes. The title for each gene presents the OrthoDB accession, the gene name, and the immune category. We only present a subset of the genes that showed an overall signature for selection highlighting codons at three different significance thresholds: Bayesian posterior probability >0.75 (plus signs along the top of each panel), >0.95 ('x's), and where Eω - sqrt(Var(ω)) > 1.25 (circles). The blue shadow indicates an estimate of error at each codon. We show Pfam domains in colored blocks and Phobius regions along the x-axis. Crosshatched regions were trimmed from the alignment.
Figure 9
Figure 9
Differences in evolutionary pressure between Apis and Bombus across orthology groups. Names are taken from D. melanogaster when available. The size of the point is scaled according to the proportion of codons that are evolving under different selection in the two clades. Names were moved to improve legibility taking care to maintain x-axis position in the insert (denoted with an asterix). Full table of these results can be found in Additional file 8.
Figure 10
Figure 10
Differences in evolutionary pressure between social (Apis and Bombus) and solitary (M. rotundata) across orthology groups. Names are taken from D. melanogaster when available. The size of the point is scaled according to the proportion of codons that are evolving under different selection in the two clades Names were moved to improve legibility. A full table of these results can be found in Additional file 9.

Comment in

References

    1. Alexander RD. The evolution of social behavior. Annu Rev Ecol Systemat. 1974;5:325–83. doi: 10.1146/annurev.es.05.110174.001545. - DOI
    1. Hamilton WD. Geometry for the selfish herd. J Theor Biol. 1971;31:295–311. doi: 10.1016/0022-5193(71)90189-5. - DOI - PubMed
    1. Sherman PW. Nepotism and the evolution of alarm calls. Science. 1977;197:1246–53. doi: 10.1126/science.197.4310.1246. - DOI - PubMed
    1. Foster SA. Group foraging by a coral-reef fish - a mechanism for gaining access to defended resources. Anim Behav. 1985;33:782–92. doi: 10.1016/S0003-3472(85)80011-7. - DOI
    1. Wilson EO. Success and dominance in ecosystems: the case of the social insects. Ecology Institute Oldendorf/Luhe: Oldendorf, Germany; 1990.

Publication types

LinkOut - more resources