. 2015 Apr 22;5(6):1187-209.
doi: 10.1534/g3.115.018416.

Development of a 63K SNP Array for Cotton and High-Density Mapping of Intraspecific and Interspecific Populations of Gossypium spp

Affiliations

Development of a 63K SNP Array for Cotton and High-Density Mapping of Intraspecific and Interspecific Populations of Gossypium spp

Amanda M Hulse-Kemp et al. G3 (Bethesda). .

Abstract

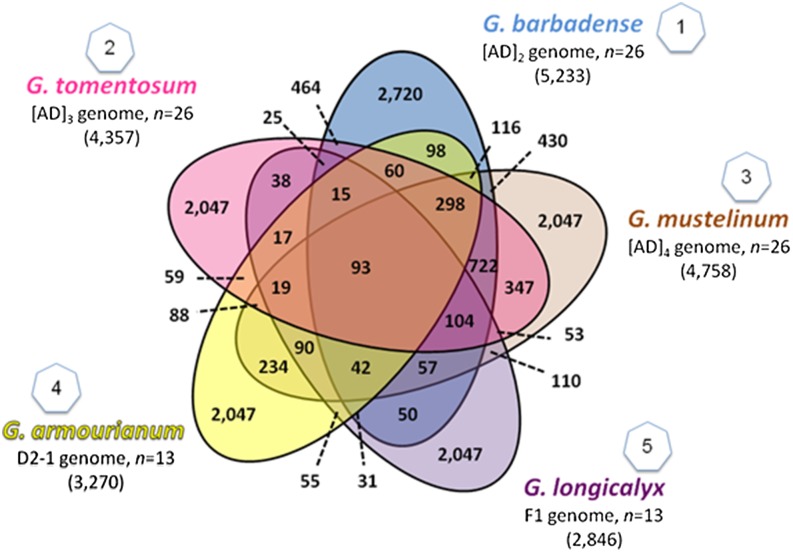
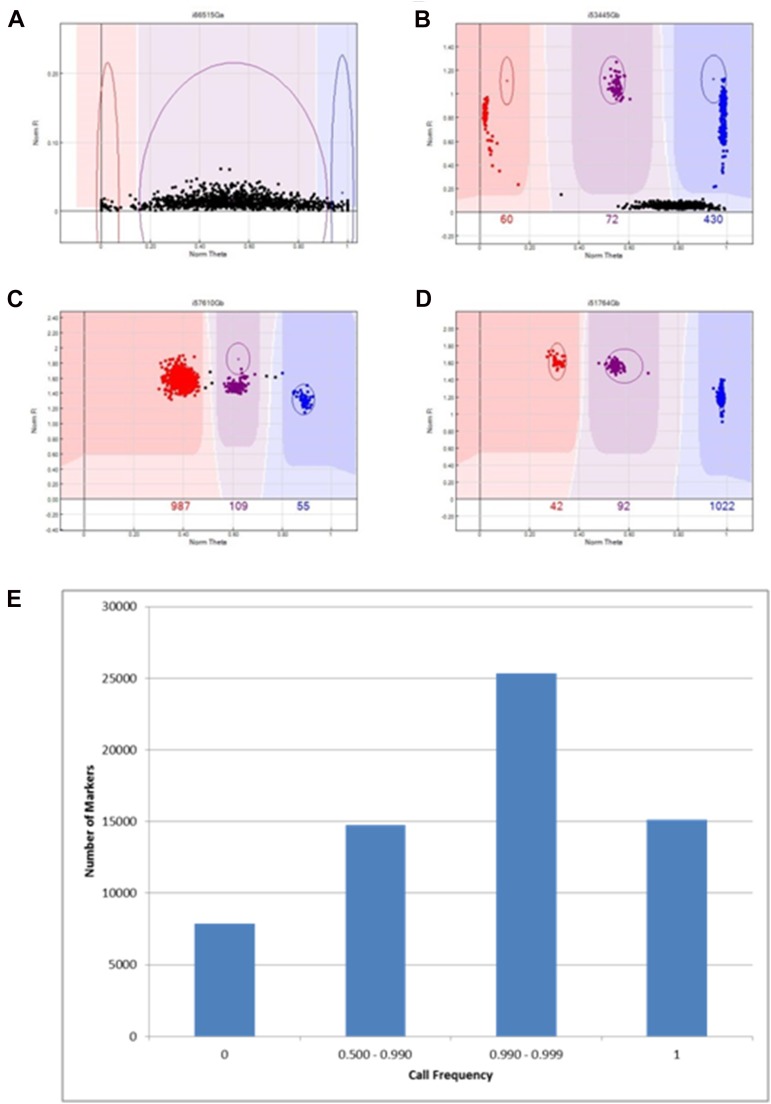
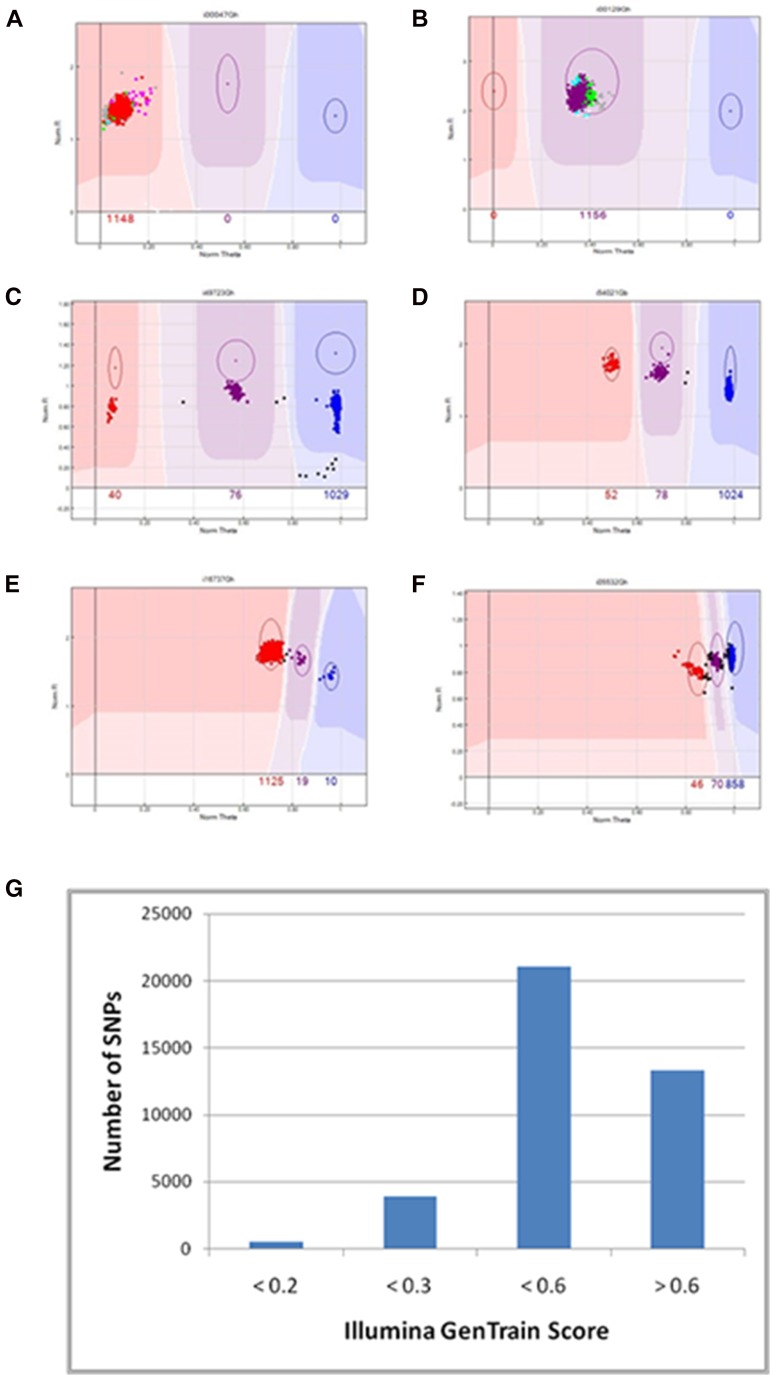
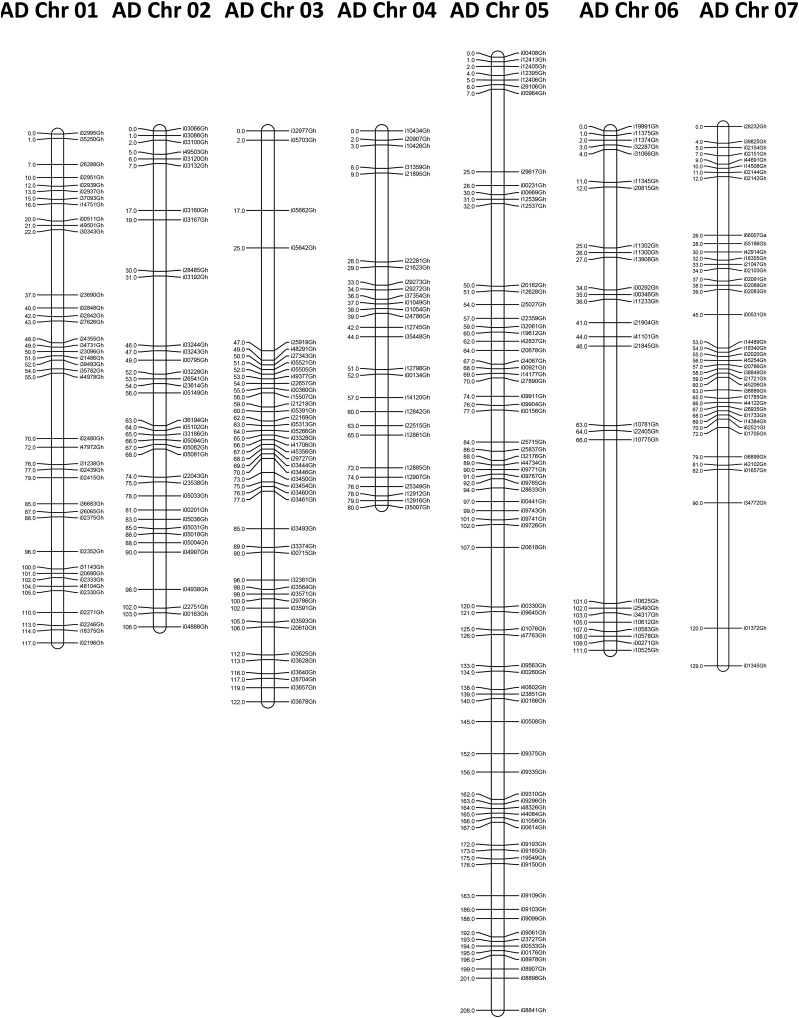
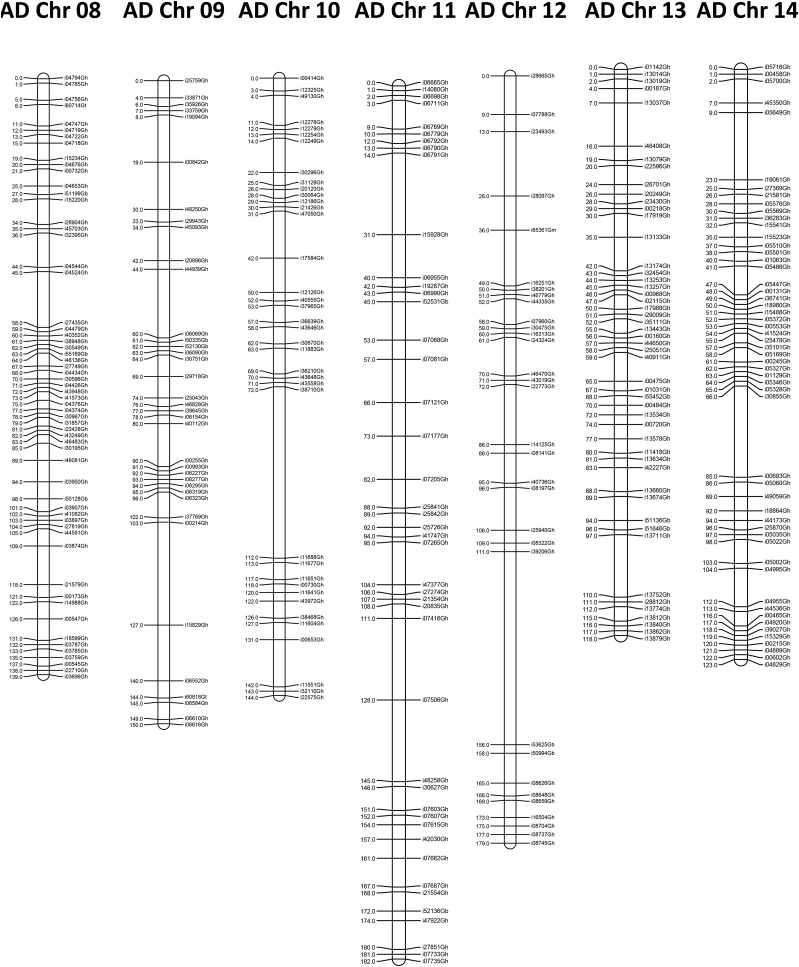
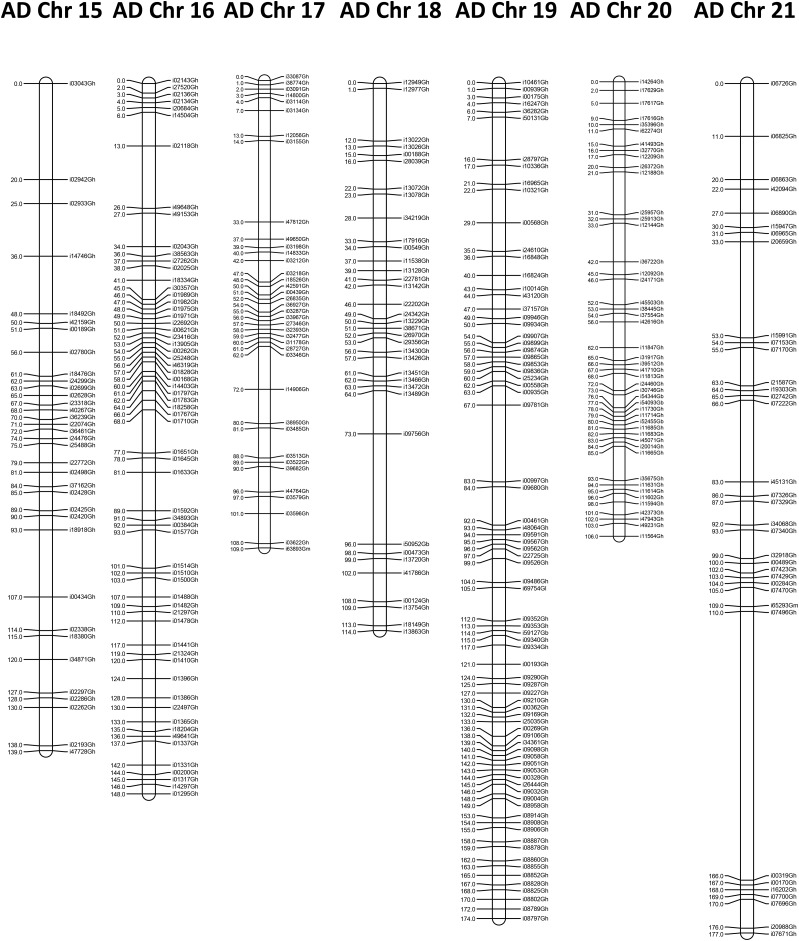
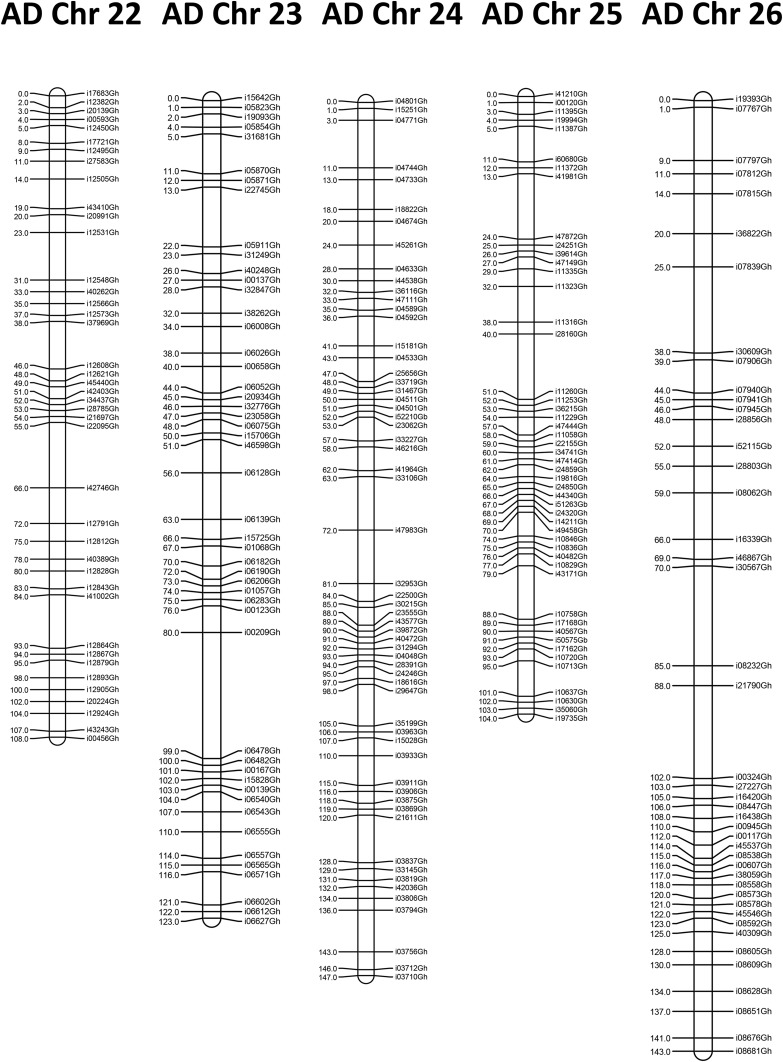
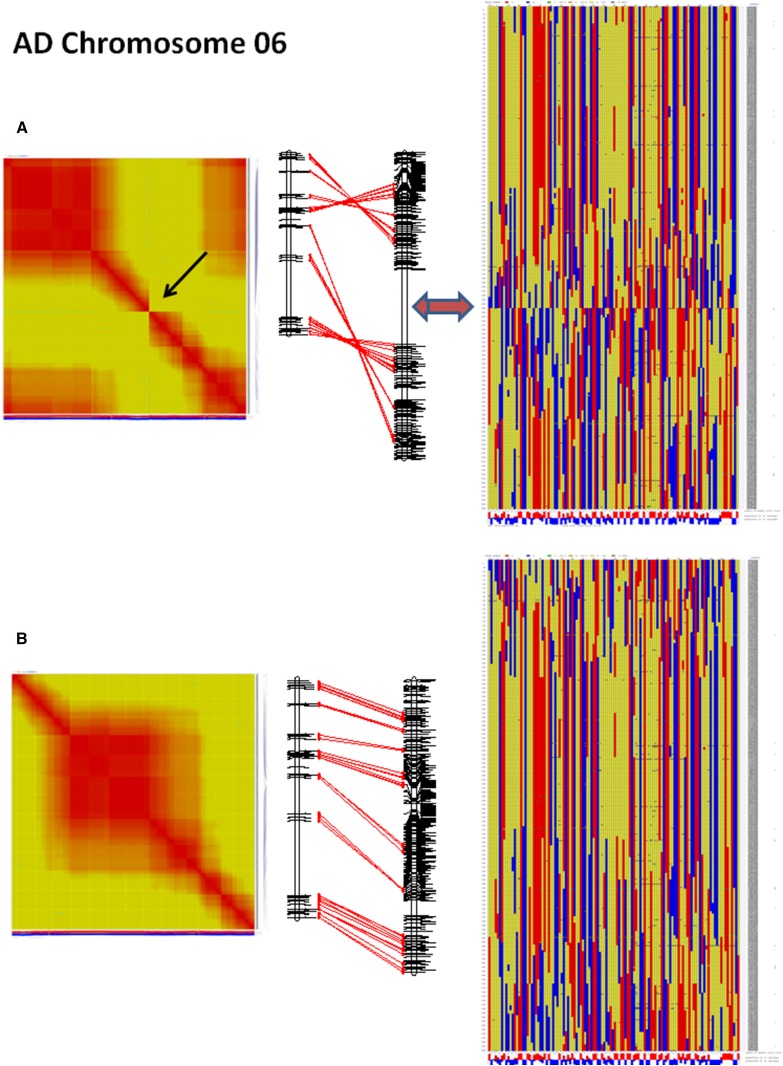
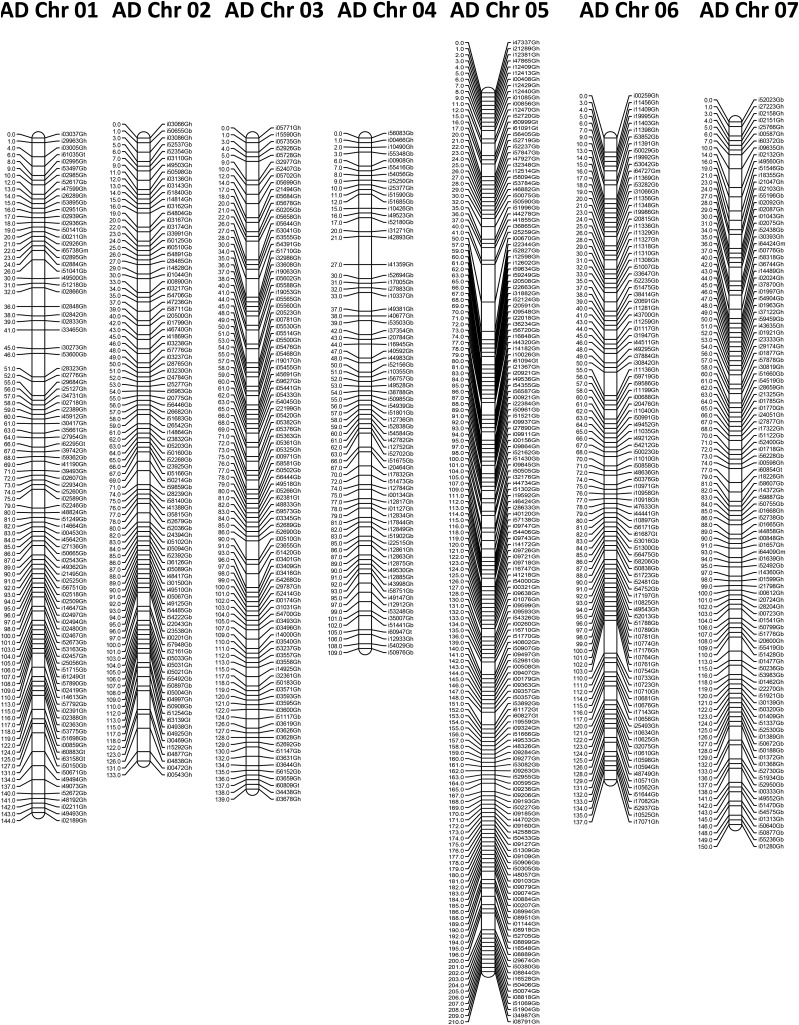
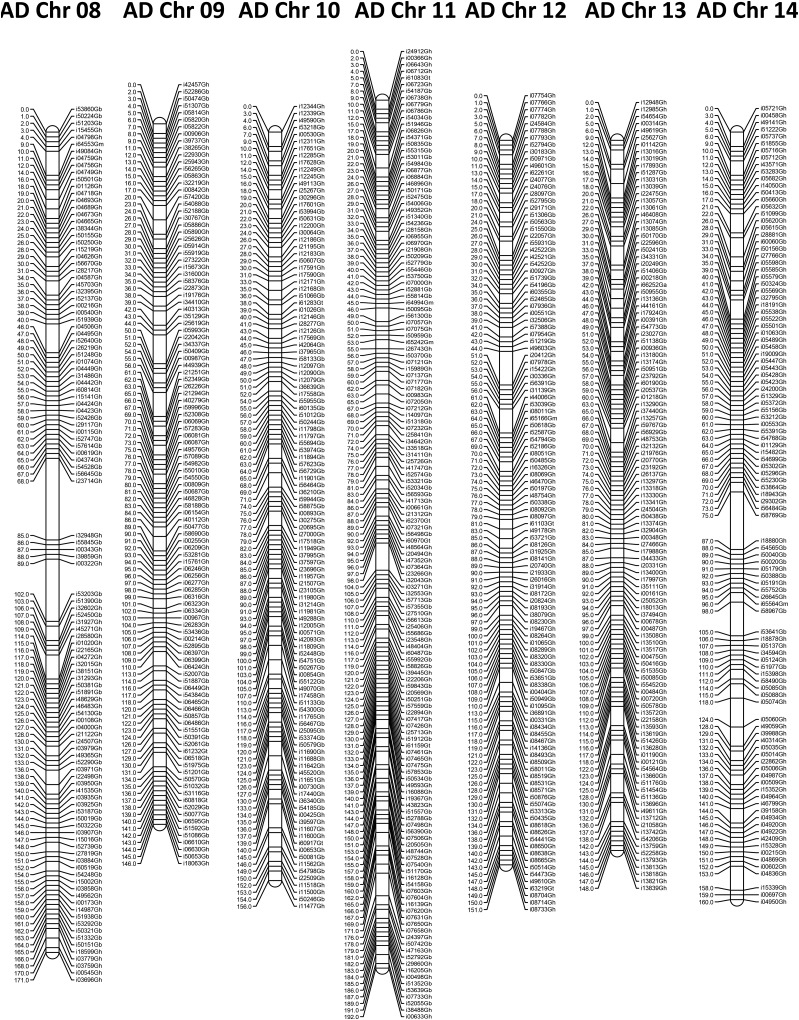
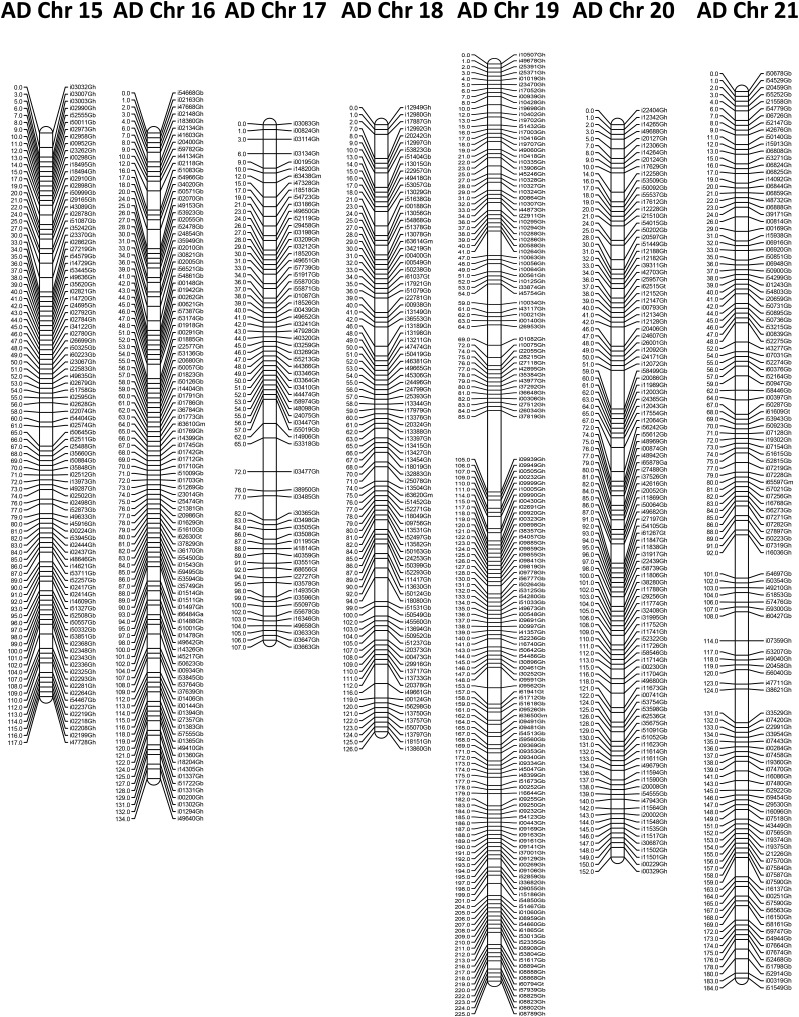
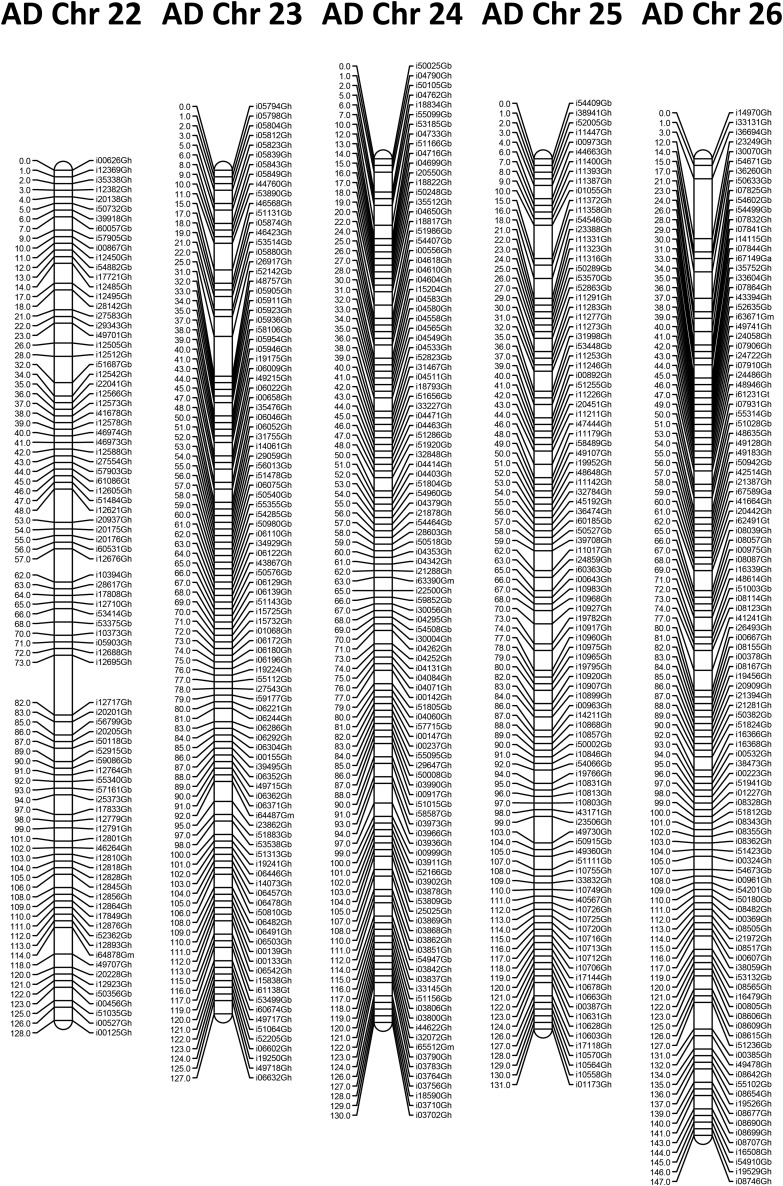
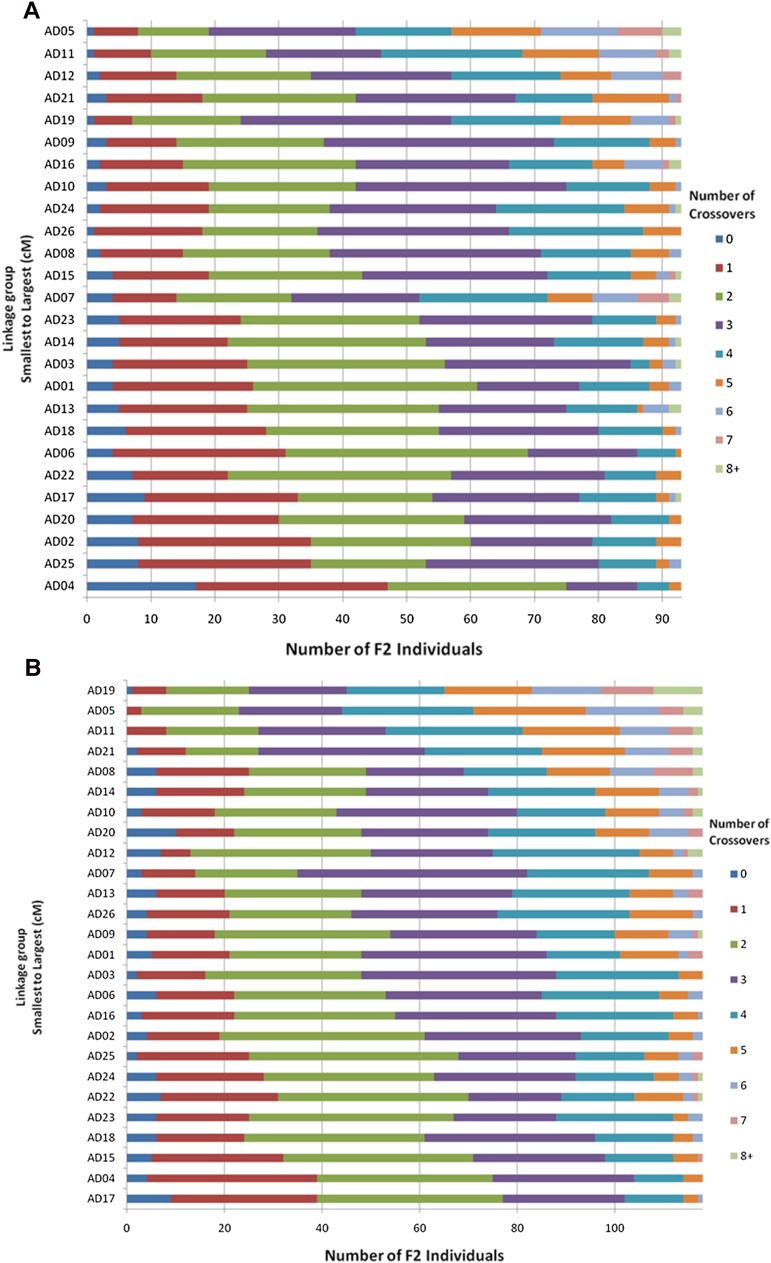
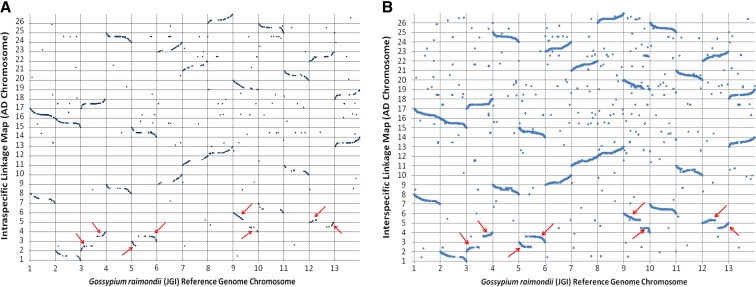
High-throughput genotyping arrays provide a standardized resource for plant breeding communities that are useful for a breadth of applications including high-density genetic mapping, genome-wide association studies (GWAS), genomic selection (GS), complex trait dissection, and studying patterns of genomic diversity among cultivars and wild accessions. We have developed the CottonSNP63K, an Illumina Infinium array containing assays for 45,104 putative intraspecific single nucleotide polymorphism (SNP) markers for use within the cultivated cotton species Gossypium hirsutum L. and 17,954 putative interspecific SNP markers for use with crosses of other cotton species with G. hirsutum. The SNPs on the array were developed from 13 different discovery sets that represent a diverse range of G. hirsutum germplasm and five other species: G. barbadense L., G. tomentosum Nuttal × Seemann, G. mustelinum Miers × Watt, G. armourianum Kearny, and G. longicalyx J.B. Hutchinson and Lee. The array was validated with 1,156 samples to generate cluster positions to facilitate automated analysis of 38,822 polymorphic markers. Two high-density genetic maps containing a total of 22,829 SNPs were generated for two F2 mapping populations, one intraspecific and one interspecific, and 3,533 SNP markers were co-occurring in both maps. The produced intraspecific genetic map is the first saturated map that associates into 26 linkage groups corresponding to the number of cotton chromosomes for a cross between two G. hirsutum lines. The linkage maps were shown to have high levels of collinearity to the JGI G. raimondii Ulbrich reference genome sequence. The CottonSNP63K array, cluster file and associated marker sequences constitute a major new resource for the global cotton research community.

Keywords: breeding; interspecific SNPs; intraspecific SNPs; linkage analysis; recombination.


Figures

Figure 1
Figure 1
SNP markers shared across five species included on the CottonSNP63K array from TAMU/UC-Davis Inter RNA-seq discovery set (Hulse-Kemp et al. 2014).
Figure 2
Figure 2
Types of call frequency of SNP markers. NormTheta or relative amount of each of the two fluorophore signals is plotted on the X-axis, whereas NormR or signal intensity is plotted on the Y-axis. (A) Failed marker with call frequency = 0. (B) Call frequency 0.500–0.990 with major sample deviations. (C) Call frequency 0.990–0.999 with few uncalled samples. (D) Call frequency = 1 with all called samples. (E) Distribution of call frequencies for all SNP markers on the array.
Figure 3
Figure 3
Classification of scorable SNP markers according to Illumina GenTrain score. NormTheta or relative amount of each of the two fluorophore signals is plotted on the X-axis, whereas NormR or signal intensity is plotted on the Y-axis. (A) Monomorphic marker. (B) Intergenomic or homeo-SNP marker. (C–F) Classification of polymorphic markers based on Illumina GenTrain score. (C) Genome-specific marker representing a single polymorphic locus with GenTrain score >0.60. (D) Marker with GenTrain score 0.30–0.59 on half the plot representing two genomes, one monomorphic and one polymorphic locus. (E) Marker with GenTrain score 0.21–0.29 representing multiple monomorphic loci and one polymorphic locus. (F) Marker with GenTrain score less than 0.20 representing many monomorphic loci and one polymorphic locus. (G) Distribution of cluster types in polymorphic markers based on GenTrain score.
Figure 4
Figure 4
Distribution of minor allele frequencies of all polymorphic SNPs on the CottonSNP63K array. Minor allele frequencies were determined using only inbred line samples; mapping samples and other noninbred line samples used for cluser file development were excluded from this analysis.
Figure 5
Figure 5
Intraspecific linkage map of 26 allotetraploid cotton chromosomes. Map determined using 93 F2 individuals from a Phytogen 72 by Stoneville 474 cross. Only one marker is listed on the right per Kosambi centiMorgan (cM) on the left, even if there were more markers co-segregating. Chromosomes are listed based on AD chromosome number.
Figure 5
Figure 5
Intraspecific linkage map of 26 allotetraploid cotton chromosomes. Map determined using 93 F2 individuals from a Phytogen 72 by Stoneville 474 cross. Only one marker is listed on the right per Kosambi centiMorgan (cM) on the left, even if there were more markers co-segregating. Chromosomes are listed based on AD chromosome number.
Figure 6
Figure 6
Inconsistencies between initial de novo interspecific map and the intraspecific map. (A) Initial plots of interspecific map order and correlation with intraspecific map show area of incorrect placement in center of the linkage group. (B) Corrected interspecific linkage group and final plots.
Figure 7
Figure 7
Interspecific linkage map of 26 allotetraploid cotton chromosomes. Map determined using 118 F2 individuals from a G. barbadense line 3-79 by G. hirsutum genetic standard line Texas Marker -1 cross. One marker listed on the right per Kosambi centiMorgan (cM) on the left. Chromosomes are listed based on AD chromosome number.
Figure 7
Figure 7
Interspecific linkage map of 26 allotetraploid cotton chromosomes. Map determined using 118 F2 individuals from a G. barbadense line 3-79 by G. hirsutum genetic standard line Texas Marker -1 cross. One marker listed on the right per Kosambi centiMorgan (cM) on the left. Chromosomes are listed based on AD chromosome number.
Figure 8
Figure 8
Frequency distribution of the number of crossovers. Numbers of crossovers detected for each F2 individual per chromosome (0 to >8) are displayed chromatically for each linkage group, which are organized by genetic size (longest at top, shortest at bottom). (A) Distribution of crossovers in the intraspecific mapping population. (B) Distribution of crossovers in the interspecific mapping population.
Figure 9
Figure 9
Dot plot of the syntenic positions of SNP markers in the allotetraploid linkage maps vs. the JGI G. raimondii reference genome. The 26 allotetraploid chromosomes are shown on the y-axis and the 13 chromosomes of G. raimondii are shown on the x-axis. Red arrows indicate translocation events relative to G. raimondii. (A) Intraspecific linkage map displaying positions of 4521 mapped SNP in G. hirsutum with alignments to G. raimondii. (B) Interspecific linkage map (G. barbadense line 3-79 by G. hirsutum genetic standard line Texas Marker -1) displaying positions of 12,027 mapped SNP with alignments to G. raimondii.

References

    1. Ashrafi H., Hulse-Kemp A. M., Wang F., Yang S. S., Guan X., et al. , 2015. A long-read transcriptome assembly of cotton (Gossypium hirsutum L.) and intraspecific single nucleotide polymorphism discovery. The Plant Genome 8: 1–14. - PubMed
    1. Bianco L., Cestaro A., Sargent D. J., Banchi E., Derdak S., et al. , 2014. Development and validation of a 20K single nucleotide polymorphism (SNP) whole genome genotyping array for apple (Malus × domestica Borkh). PLoS ONE 9: e110377. - PMC - PubMed
    1. Blenda A., Fang D. D., Rami J. F., Garsmeur O., Luo F., et al. , 2012. A high density consensus genetic map of tetraploid cotton that integrates multiple component maps through molecular marker redundancy check. PLoS ONE 7: e45739 10.1371/journal.pone.0045739 - DOI - PMC - PubMed
    1. Brown M. S., 1980. Identification of the chromosomes of Gossypium hirsutum L. by means of translocations. J. Hered. 71: 266–274.
    1. Byers R. L., Harker D. B., Yourstone S. M., Maughan P. J., Udall J. A., 2012. Development and mapping of SNP assays in allotetraploid cotton. Theor. Appl. Genet. 124: 1201–1214 10.1007/s00122-011-1780-8 - DOI - PMC - PubMed

Publication types

Substances