. 2015 Jun 15;75(12):2566-79.
doi: 10.1158/0008-5472.CAN-14-2946. Epub 2015 Apr 23.

G-CSF Promotes Neuroblastoma Tumorigenicity and Metastasis via STAT3-Dependent Cancer Stem Cell Activation

Affiliations

G-CSF Promotes Neuroblastoma Tumorigenicity and Metastasis via STAT3-Dependent Cancer Stem Cell Activation

Saurabh Agarwal et al. Cancer Res. .

Abstract

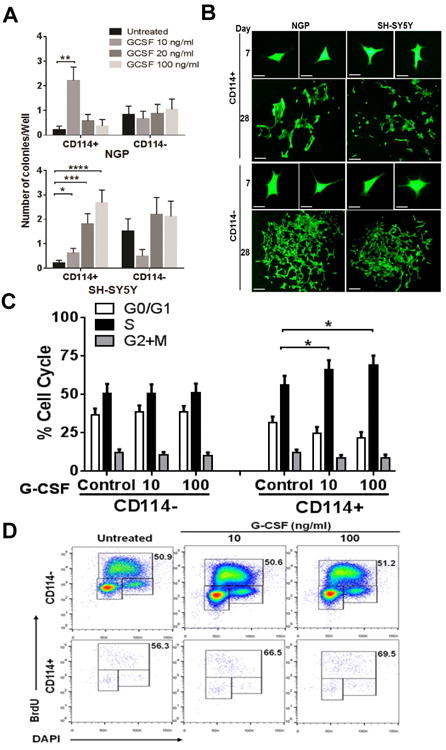
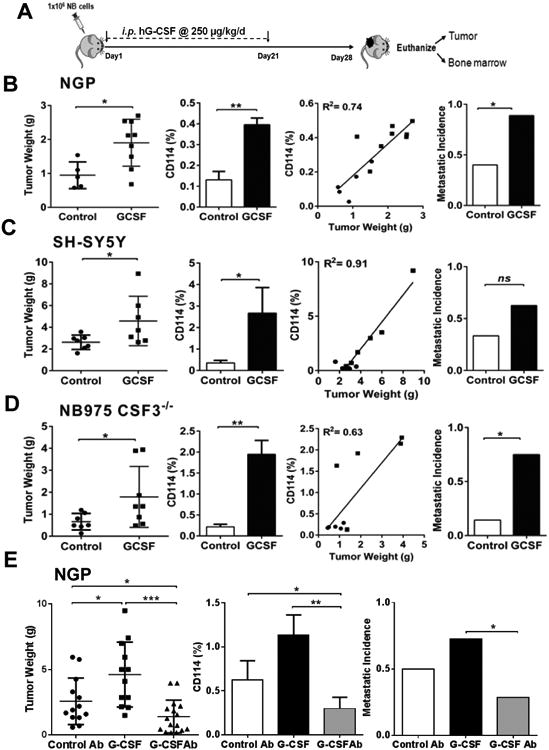
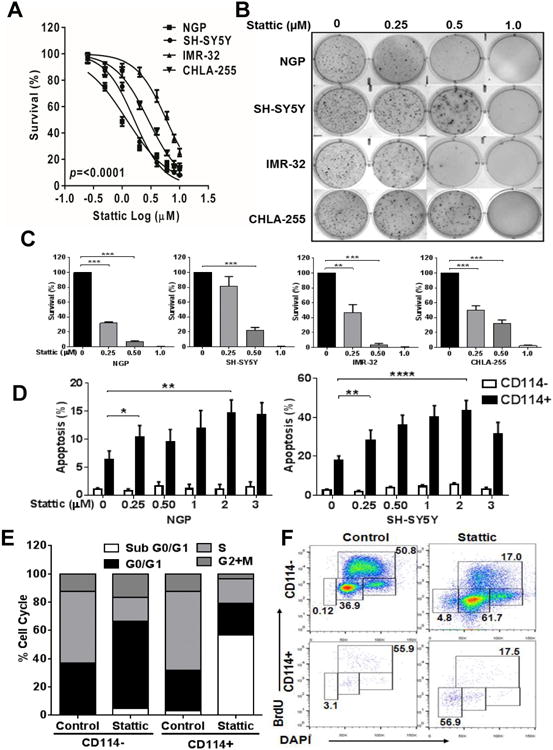
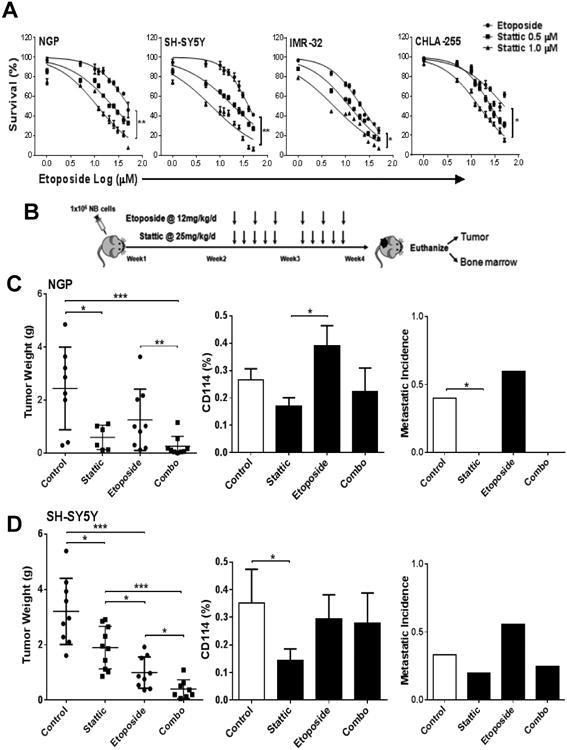
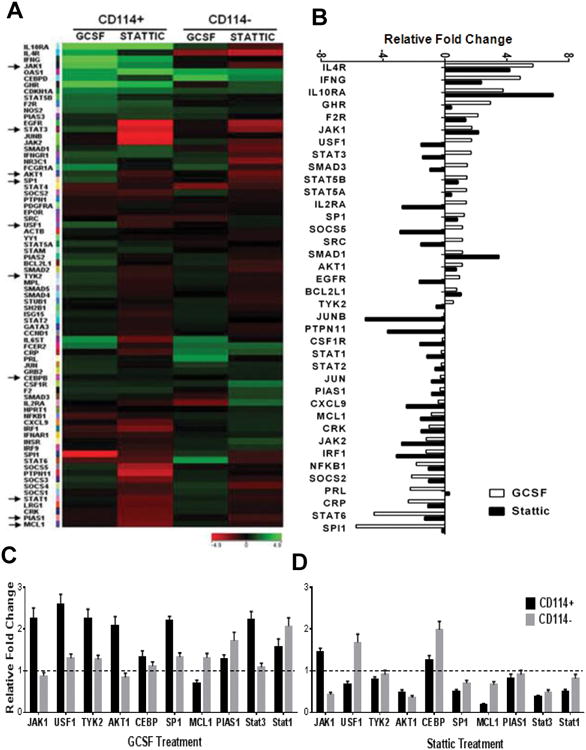
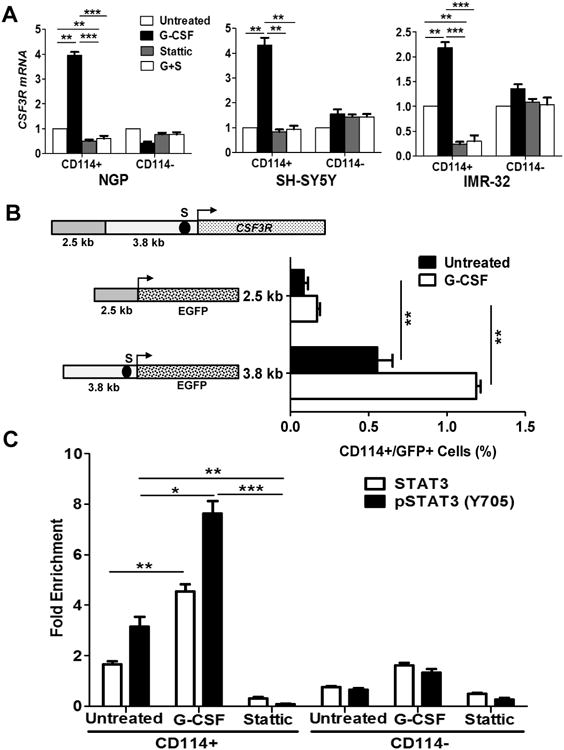
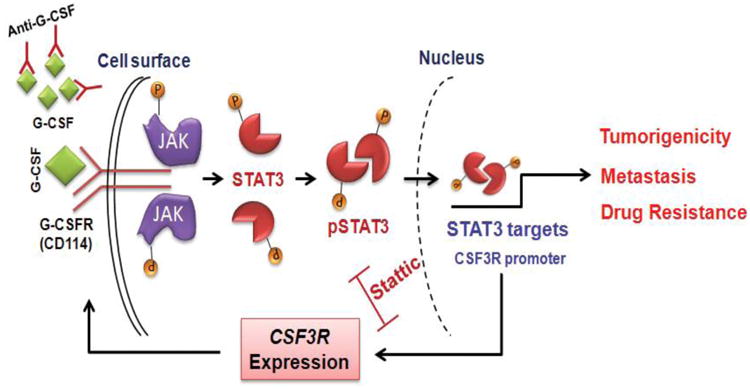
Increasing evidence suggests that inflammatory cytokines play a critical role in tumor initiation and progression. A cancer stem cell (CSC)-like subpopulation in neuroblastoma is known to be marked by expression of the G-CSF receptor (G-CSFR). Here, we report on the mechanistic contributions of the G-CSFR in neuroblastoma CSCs. Specifically, we demonstrate that the receptor ligand G-CSF selectively activates STAT3 within neuroblastoma CSC subpopulations, promoting their expansion in vitro and in vivo. Exogenous G-CSF enhances tumor growth and metastasis in human xenograft and murine neuroblastoma tumor models. In response to G-CSF, STAT3 acts in a feed-forward loop to transcriptionally activate the G-CSFR and sustain neuroblastoma CSCs. Blockade of this G-CSF-STAT3 signaling loop with either anti-G-CSF antibody or STAT3 inhibitor depleted the CSC subpopulation within tumors, driving correlated tumor growth inhibition, decreased metastasis, and increased chemosensitivity. Taken together, our results define G-CSF as a CSC-activating factor in neuroblastoma, suggest a comprehensive reevaluation of the clinical use of G-CSF in these patients to support white blood cell counts, and suggest that direct targeting of the G-CSF-STAT3 signaling represents a novel therapeutic approach for neuroblastoma.


Conflict of interest statement

Competing Financial Interests: The authors declare no competing financial interests.

Conflicts of Interest: The authors disclose no potential conflicts of interest.

Figures

Figure 1
Figure 1. Effect of G-CSF on CD114+ and CD114- cells in vitro
(A) Single cell colony formation assay showing effect of G-CSF treatment on neuroblastoma subpopulations. CD114+ and CD114- cells were flow sorted in to 96-well plates and untreated or treated for 28 days with indicated dose of G-CSF. Each condition is replicated in at least 20 individual wells and data is represented as number of colonies/well (mean ± SEM). No significant effect was observed in CD114- cells under similar culture conditions and G-CSF treatments. (t-test, *p<0.05, **p<0.01, ***p<0.001, ****p<0.0001). Stattic treatment was also performed under similar experimental conditions but even lower doses of Stattic completely blocked the colony formation (data not included). (B) Representative photographs showing colonies developed from CD114+ and CD114- cells of NGP and SH-SY5Y NB cell lines at day 28 in response to G-CSF treatment (Scale bar, 200 μm). Photographs at day 7 scale bar, 100 μm. (C) BrdU cell cycle analysis of NGP NB subpopulations shows increase in S-phase in CD114+ cells in response to G-CSF treatment (10 ng/ml) for 2 h (t-test, p<0.05). CD114- cell cycle remains unaffected from G-CSF. Experiment was repeated in triplicates (mean ± SEM). (D) Representative flow cytometry plots showing effect of G-CSF on cell cycle of NGP NB subpopulations. Values shown in the upper right corner of each dot plot reveal the percentage of the S phase cells under different treatments.
Figure 2
Figure 2. G-CSF promotes Neuroblastoma tumorigenicity in vivo
(A) Schematic representation of experimental plan to analyze the effect of G-CSF on neuroblastoma in vivo. One million NB cells were injected under the sub-renal capsule of mouse to develop orthotopic xenografts/allografts by using orthotopic mouse model. Implanted mouse treated with exogenous G-CSF (i.p. injection, 250 μg/kg/day) or vehicle control (5% dextrose water) starting next day from implantation until day 21 followed by necropsy at day 28. (B) NGP xenografts showing significant increase in tumor weights in response to G-CSF treatment compared to controls (p=0.019) with relative increase in the percentage of CD114+ cells in treatment cohorts (p=0.003). Liner regression analysis showing direct correlation between individual tumor mass and percentage of CD114+ cells (●= control, ■=G-CSF treated mice). Detection of human MYCN mRNA by qPCR in bone marrow of xenotransplanted mice shows increase in metastatic incidence in G-CSF treatment cohort (p<0.027) (Mann-Whitney test, *p<0.05, **p<0.01). (C) SH-SY5Y xenografts showing significant increase in tumor weights in response to G-CSF treatment compared to controls (p=0.038) with relative increase in the percentage of CD114+ cells (p=0.03). Liner regression analysis showing direct correlation between individual tumor mass and percentage of CD114+ cells (●= control, ■=G-CSF treated mice). Metastatic incidence analysis shows increase in G-CSF treatment cohort (p=ns) (Mann-Whitney test, *p<0.05). (D) CSF3−/− mice allografted with murine NB cell line NB975 showing significant increase in tumor weights in response to G-CSF treatment compared to controls (p=0.04) and increased the percentage of CD114+ cells (p=0.01). Liner regression analysis showing direct correlation between individual tumor mass and percentage of CD114+ cells (●= control, ■=G-CSF treated mice). G-CSF treatment significantly increases the metastatic incidence (p=0.016) (Mann-Whitney test, *p<0.05, **p<0.01). (E) NGP xenografts treated with anti-G-CSF antibody (i.p. injection, 100 μg/kg/day) showing significant decrease in tumor mass in contrast to exogenous G-CSF (p=0.0001) and isotype control antibody treatment (p=0.04). Treatment plan for all cohorts followed similar to as shown in A. Tumor flow cytometry analysis showing significant decrease in total percentage of CD114+ cells in anti-G-CSF antibody cohort in contrast to G-CSF (p=0.001) and control antibody (p=0.03) cohorts. Metastatic incidence was significantly decreased in anti-G-CSF antibody cohort in comparison to G-CSF treatment (p=0.04). (Mann-Whitney test,*p<0.05, **p<0.01, ***p<0.001).
Figure 3
Figure 3. Effect of STAT3 inhibition on Neuroblastoma in vitro
(A) Cell viability assay of different NB cell lines (NGP, SH-SY5Y, IMR-32, CHLA-255) in response to various concentrations of STAT3 inhibitor (Stattic) treatment for 24 h. Cell viability was measured using MTS assay. Experiment was repeated two times with six replicates for each condition and represented as mean ± SD. (B) Representative pictures of colony formation assay for different NB cell lines treated with various doses of Stattic (μM). (C) Quantitation of relative inhibition of colony formation is shown as mean ± SD (t-test, *p<0.05, **p<0.01, ***p<0.001, ****p<0.0001). (D) Measurement of apoptosis in CD114+ and CD114- NB subpopulations of NGP and SH-SY5Y cell lines using Annexin-V staining along with CD114 staining in response to increasing doses of Stattic for 2 h. Data are represented as means ± SD for three independent experiments. DMSO was used as control in “0” groups. (t-test, *p<0.05, **p<0.01, ****p<0.0001). (E) Cell cycle analysis using BrdU incorporation assay in NGP NB subpopulations with 1μM Stattic treatment for 2 h. Data is represented as relative percentage and representative of experiment repeated three times. (F) Representative flow cytometry analysis plots for cell cycle analysis on NGP NB subpopulations in response to Stattic treatment (1μM). Values shown on each dot plot are representing the percentage of cells.
Figure 4
Figure 4. STAT3 inhibition sensitizes neuroblastoma to chemotherapy
(A) Cell viability assay of different NB cell lines (NGP, SH-SY5Y, IMR-32, CHLA-255) were tested by MTS assay in response to etoposide alone and in combination of 0.5 μM and 1.0 μM Stattic treatment for 24 h. Experiments were repeated two times with six replicates for each condition and represented as mean ± SD. (B) Schematic representation of experimental plan to analyze the in vivo effect of STAT3 inhibitor and dual treatment strategy on neuroblastoma. Orthotopic mouse model was used to develop xenografts of NB NGP and SH-SY5Y cell lines and treated with either etoposide (12 mg/kg/day, i.p. injection, three times/week) and Stattic (25 mg/kg/day, i.p. injection, five days/week) alone or combined. Implanted mouse were treated two weeks post-implantation for two weeks. Vehicle (DMSO) was used as control in all experiments. (C) NGP xenografts showing significant decrease in tumor weights in response to Stattic treatment (p=0.03), etoposide treatment and combo treatment (p=0.001) in comparison to controls. Combo treatment also significantly reduced tumor burden in comparison to etoposide alone (p=0.008). (Mann-Whitney test, *p<0.05, **p<0.01, ***p<0.001). The percentage of CD114+ cells determined by flow cytometry analysis on individual tumors showed as mean ± SEM. Human MYCN mRNA was detected by qPCR in bone marrow of xenotransplanted mice. (D) SH-SY5Y xenografts showing significant decrease in tumor weights in response to Stattic treatment (p=0.02), etoposide treatment (p=0.0002) and combo treatment (p=<0.0001) in comparison to controls. Combo treatment also significantly reduced tumor burden in comparison to etoposide (p=0.02) and Stattic alone (p=0.0002). (Mann-Whitney test (*p<0.05, **p<0.01, ***p<0.001). The percentage of CD114+ cells determined by flow cytometry analysis on individual tumors showed as mean ± SEM. Detection of human MYCN mRNA by qPCR in bone marrow of xenotransplanted mice shows trend of reduction of metastasis with Stattic (p=ns).
Figure 5
Figure 5. G-CSF influences STAT3 target genes
(A) JAK/STAT pathway genes were analyzed using a low-density qPCR based array (SABiosciences) in NB subpopulations from NGP cell line. Heatmap is generated by comparing untreated to G-CSF (20 ng/ml) or Stattic (1μM) treatment for 2 h for respective subpopulations using GeneSpring GX. Arrow marks on left indicate the genes further validated by qPCR as shown in (C, D). (B) Water-fall plot showing effect of G-CSF (20 ng/ml) and Stattic (1μM) treatment for 2 h on individual genes in CD114+ cells in comparison to CD114- cells. (C) Key genes in CD114+ and CD114- NB subpopulations with G-CSF treatment (20 ng/ml for 2 h) were validated by qPCR in triplicates and represented here as mean ± SEM. (D) Key genes in CD114+ and CD114- NB subpopulations with Stattic treatment (1μM for 2 h) were validated by qPCR in triplicates and represented here as mean ± SEM.
Figure 6
Figure 6. STAT3 directly regulates CSF3R expression
(A) Relative CSF3R expression analysis in NB subpopulations of NGP, SH-SY5Y, and IMR-32 in response to G-CSF (20 ng/ml), Stattic (1μM) and combination treatment (G+S; represents G-CSF + Stattic) for 2 hr. Data are mean ± SEM of three replicates of experiment repeated twice. (t-test, *p<0.05, **p<0.01, ***p<0.001). (B) Schematic representation of CSF3R gene promoter showing 3.8 kb long 5′ untranslated region (5′ UTR) and 2.5 kb long promoter region. A potential STAT3 binding site was determined in 5′ UTR region at -200 bp (S) from translation start site (arrow). EGFP reporter driven by 5′UTR contacting STAT3 binding site (S) shows significant increase in percentage of CD114+/GFP+ cells in response to G-CSF treatment (20 ng/ml for 2 h) in contrast to untreated or reporter driven by promoter region. CHIP-qPCR primers were designed for STAT3 binding site (S). (C) CHIP-qPCR analysis showing direct binding enrichment of STAT3 and pSTAT3 (Y705) at S site of CSF3R 5′ UTR. NGP NB subpopulation CD114+ cells showing enriched binding of STAT3 by 2.2 fold (p=0.007) pSTAT3 by 3.1 fold (p=0.002) in comparison to CD114- cells. G-CSF treatment (20ng/ml for 2 h) in CD114+ cells further enriched the binding of STAT3 by 2.7 fold (p<0.001) and pSTAT3 (Y705) by 2.4 fold (p<0.01) in comparison to baseline untreated while Stattic treatment (1μM for 2 h) blocks the binding of STAT3 or pSTAT3. Data are mean ± SEM of three replicates of experiment repeated twice. (t-test *p<0.05, **p<0.01, ***p<0.001).
Figure 7
Figure 7. Model representing positive feedback loop of G-CSF/STAT3 signaling axis in neuroblastoma cancer stem cells
Schematic representation of conclusions drawn from current study showing upregulation of JAK/STAT3 pathway in response to binding of G-CSF to G-CSFR. Active STAT3 translocate to nucleus and upregulate the expression of key target genes that are know to be involved in tumorigenicity, metastasis and drug resistance. CSF3R (gene coding for G-CSFR) is also a direct transcriptional target of STAT3. Binding of STAT3 on CSF3R promoter further upregulate surface expression of the G-CSFR (CD114), making a feedback loop mechanism for tumor progression in NB. STAT3 inhibition and anti-G-CSF antibody are shown to block this positive feedback loop and therefore decrease the cancer stem cell functions in NB.

Comment in

References

    1. Armenian SH, Robison LL. Childhood cancer survivorship: an update on evolving paradigms for understanding pathogenesis and screening for therapy-related late effects. Curr Opin Pediatr. 2013;25:16–22. - PMC - PubMed
    1. Cohn SL, Pearson AD, London WB, Monclair T, Ambros PF, Brodeur GM, et al. The International Neuroblastoma Risk Group (INRG) classification system: an INRG Task Force report. Journal of clinical oncology: official journal of the American Society of Clinical Oncology. 2009;27:289–97. - PMC - PubMed
    1. Louis CU, Shohet JM. Neuroblastoma: molecular pathogenesis and therapy. Annual review of medicine. 2015;66:49–63. - PMC - PubMed
    1. Nichane M, Ren X, Bellefroid EJ. Self-regulation of Stat3 activity coordinates cell-cycle progression and neural crest specification. The EMBO journal. 2010;29:55–67. - PMC - PubMed
    1. Strobl-Mazzulla PH, Bronner ME. Epithelial to mesenchymal transition: New and old insights from the classical neural crest model. Semin Cancer Biol. 2012 - PMC - PubMed

Publication types

Substances