. 2015 May 29;348(6238):1031-5.
doi: 10.1126/science.aaa4812. Epub 2015 Apr 23.

Immune tolerance. Group 3 innate lymphoid cells mediate intestinal selection of commensal bacteria-specific CD4⁺ T cells

Affiliations

Immune tolerance. Group 3 innate lymphoid cells mediate intestinal selection of commensal bacteria-specific CD4⁺ T cells

Matthew R Hepworth et al. Science. .

Abstract

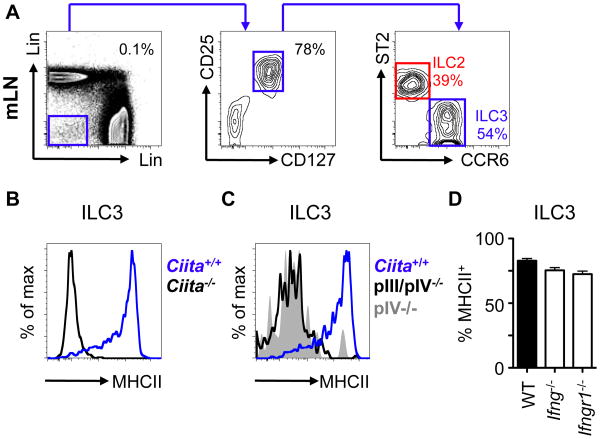
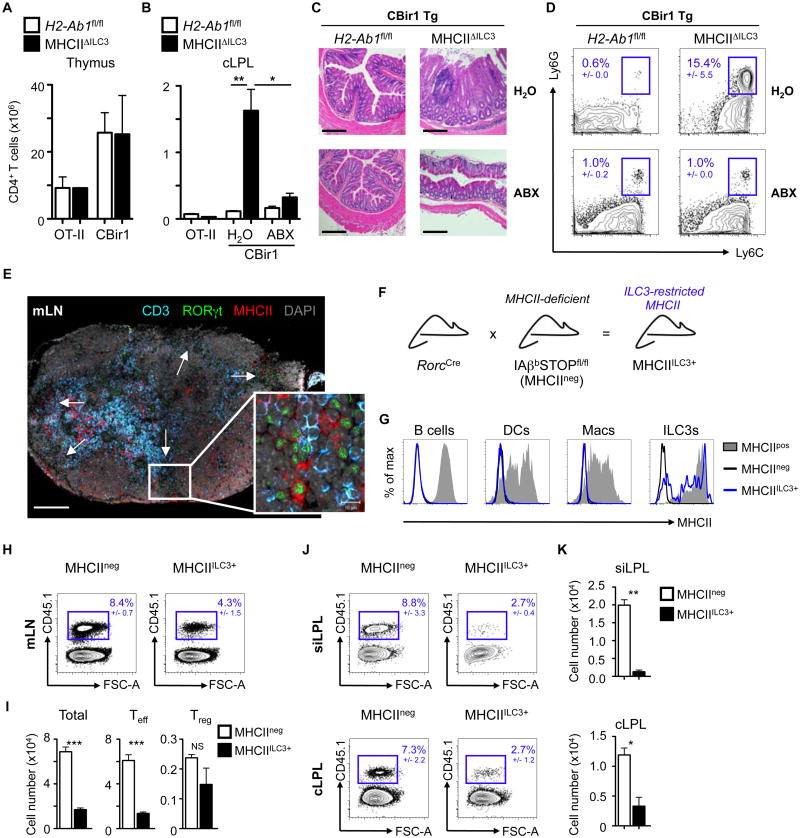
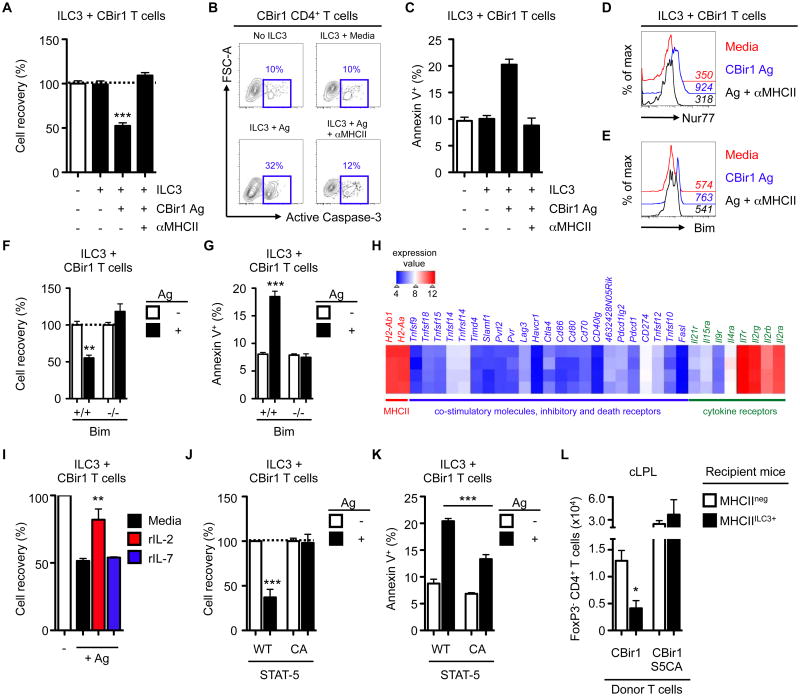
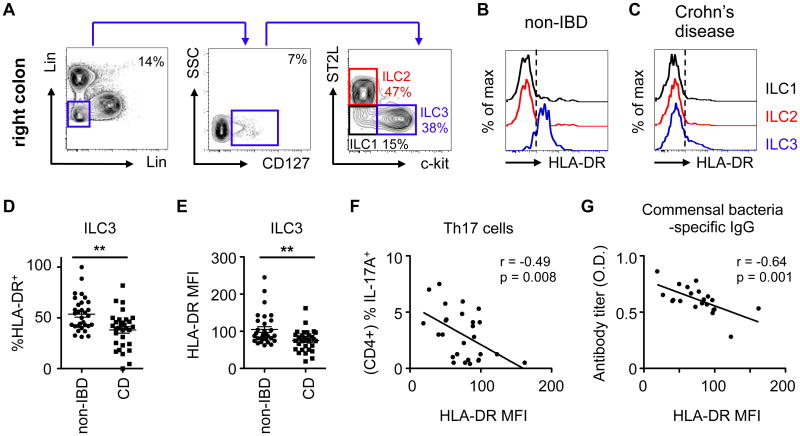
Inflammatory CD4(+) T cell responses to self or commensal bacteria underlie the pathogenesis of autoimmunity and inflammatory bowel disease (IBD), respectively. Although selection of self-specific T cells in the thymus limits responses to mammalian tissue antigens, the mechanisms that control selection of commensal bacteria-specific T cells remain poorly understood. Here, we demonstrate that group 3 innate lymphoid cell (ILC3)-intrinsic expression of major histocompatibility complex class II (MHCII) is regulated similarly to thymic epithelial cells and that MHCII(+) ILC3s directly induce cell death of activated commensal bacteria-specific T cells. Further, MHCII on colonic ILC3s was reduced in pediatric IBD patients. Collectively, these results define a selection pathway for commensal bacteria-specific CD4(+) T cells in the intestine and suggest that this process is dysregulated in human IBD.


Figures

Fig. 1
Fig. 1. ILC3 expression of MHCII is controlled by a transcriptional pathway previously associated with thymic epithelial cells
A) Mesenteric lymph node (mLN) cells from naïve mice were gated as CD45+ lineage (x-axis; CD3, CD5, CD8, NK1.1, y-axis; B220, CD11c, CD11b) negative, CD25+ and CD127+ and further divided by expression of ST2 (ILC2; red) or CCR6 (ILC3; blue). MHCII expression was determined on ILC3s in mice deficient in B) CIITA, C) CIITA promoter regions (pIII/pIV, pIV) or D) IFN-γ and IFN-γR1. All data representative of at least 3 independent experiments with n=2-3 mice per group. SPF, specific pathogen free.
Fig. 2
Fig. 2. MHCII+ ILC3s induce deletion of commensal bacteria-specific CD4+ T effector cells in the intestine and associated lymph nodes
Total Vβ5+ (OT-II) or Vβ8.3+ (CBir1) CD4+ T cell numbers determined in A) the thymus and B) cLPL of control (H20) or antibiotic (ABX)-treated OT-II and CBir1 transgenic mice crossed with MHCIIΔILC3 or H2-Ab1fl/fl littermate controls. C) Colon histology (scale bar 200μm) and D) frequencies of (CD45+ B220- CD3-) Ly6C+ Ly6G+ neutrophils in the cLPL of CBir1MHCIIΔILC3 and CBir1H2-Ab1fl/fl mice. E) Immunofluorescence imaging of mLN sections stained for CD3 (blue), RORγt (green), MHCII (red) or DAPI (grey). White arrows indicate RORγt+ cell clusters. Scale bar = 200μm. Insert demonstrates colocalization of RORγt+ MHCII+ ILCs and CD3+ T cells. Insert scale bar = 10μm. F) MHCII expression was restricted to RORγt+ ILC3s (MHCIIILC3+ mice) by crossing RorcCre mice with IAβbSTOPfl/fl (MHCIIneg) mice and G) MHCII levels were determined on B220+ B cells, CD11b+ CD11chi dendritic cells (DCs), CD11b+ F4/80+ macrophages (Macs) or Linneg CD25+ CD127+ CCR6+ ILC3s in the mLN of heterozygote littermates (IAβbSTOP+/fl, MHCIIpos), MHCIIneg or MHCIIILC3+ mice. (H-K) MHCIIneg and MHCIIILC3+ received pre-activated CD45.1+ CBir1 transgenic CD4+ T cells and were injected with CBir1 peptide i.p. every 2 days. Frequencies and numbers of transferred T cells were analyzed in the mLN (H,I), siLPL and cLPL 9 days post transfer (J,K). All data representative of at least 4 independent experiments with n=2-3 mice per group. Results are shown as the mean +/- s.e.m. * p < 0.05, ** p < 0.01, *** p < 0.001 (two-tailed students t-test).
Fig. 3
Fig. 3. MHCII+ ILC3s directly induce cell death of commensal bacteria-specific CD4+ T cells
(A-D) Activated CBir1 CD4+ T cells were co-cultured with sort-purified CCR6+ ILC3s in the presence or absence of CBir1 antigen or an anti-MHCII neutralizing antibody and A) relative cell recovery (%) was quantified relative to T cells cultured alone, B) frequency of active Caspase-3 expressing cells were assessed and C) frequencies of Annexin V+ Dead cell exclusion dye-negative (pre-apoptotic) cells were quantified. D) Expression of Nur77 by CBir1 CD4+ T cells and E) expression of Bim by pre-activated CBir1 CD4+ T cells following 24h (D) or 48h (E) co-culture with antigen-pulsed MHCII+ ILC3s in the presence or absence of an anti-MHCII neutralizing antibody. Mean fluorescent intensity (MFI) values are shown in italics. (F-G) Bim+/+ or Bim-/- CBir1 T cells were co-cultured with ILC3s in the presence or absence of CBir1 antigen for 48h and F) relative cell recovery (%) and G) frequencies of Annexin V+ pre-apoptotic cells were quantified. H) Heat map of selected candidate genes from mLN-derived CCR6+ ILC3s. I) Relative cell recovery (%) of wildtype CBir1 CD4+ T cells co-cultured with antigen-pulsed ILC3s in the presence or absence of exogenous rIL-2 or rIL-7. (J-K) Activated CBir1 CD4+ T cells with wildtype or (WT) or constitutively active (CA) STAT-5 signaling were co-cultured with ILC3s in the presence or absence of CBir1 antigen for 48h and J) relative cell recovery (%) and K) frequencies of Annexin V+ pre-apoptotic cells were quantified. L) WT CBir1 CD4+ T cells or CBir1 STAT5-CA CD4+ T cells were adoptively transferred into MHCIIneg or MHCIIILC3+ mice. Mice were administered CBir1 antigen and numbers of FoxP3- CD45.1+ CBir1 T cells in the cLPL were quantified 9 days post-transfer. In vitro assay data are representative of at least 2-3 independent experiments with 2-3 biological replicates per experiment. Array data are representative of a single experiment with 4 biological replicates. All in vivo data are representative of at least 2 independent experiments with at least n=3 mice per group. Results are shown as the mean +/- s.e.m. * p < 0.05, ** p < 0.01, *** p < 0.001 (two-tailed students t-test).
Fig. 4
Fig. 4. ILC3-intrinsic MHCII is dysregulated in pediatric Crohn's disease patients and is associated with increased intestinal Th17 cells
A) Lamina propria cells were isolated from colon biopsies from non-IBD control patients and ILCs were identified as CD45+ and lineage (x-axis; CD3, CD5, CD14, FcεRI, y-axis; CD11b CD11c, and CD19) negative, CD127+ and further divided by expression of ST2L (ILC2s; red) and c-kit (ILC3s; blue) or as lacking expression of both markers (ILC1s; black). Expression of MHC class II (HLA-DR) was then determined on ILC subsets in representative biopsies from B) non-IBD patients or C) pediatric Crohn's disease (CD) patients, and the D) frequencies and E) mean fluorescent intensity of HLA-DR expression on ILC3s was quantified. ILC3 HLA-DR MFI was correlated with F) frequencies of IL-17A+ CD4+ Th17 cells in colon biopsies and G) commensal bacterial-specific IgG was quantified in the sera of pediatric Crohn's disease patients. (B-E) Representative of n=31 non-IBD and n=31 CD patients or F) n=27 and G) n=21 pediatric Crohn's disease patients. Results are shown as the mean +/- s.e.m. Statistical analyses between patient groups are performed using a Mann-Whitney test * p < 0.05, ** p < 0.01, *** p < 0.001. Correlative analyses were compared by parametric Pearson's rank correlation coefficient (r).

Comment in

References

    1. Klein L, Kyewski B, Allen PM, Hogquist KA. Positive and negative selection of the T cell repertoire: what thymocytes see (and don't see) Nat Rev Immunol. 2014;14:377–391. - PMC - PubMed
    1. von Boehmer H, Melchers F. Checkpoints in lymphocyte development and autoimmune disease. Nat Immunol. 2010;11:14–20. - PubMed
    1. Laufer TM, Glimcher LH, Lo D. Using thymus anatomy to dissect T cell repertoire selection. Semin Immunol. 1999;11:65–70. - PubMed
    1. Mathis D, Benoist C. Aire. Annu Rev Immunol. 2009;27:287–312. - PubMed
    1. Sprent J, Kishimoto H. The thymus and negative selection. Immunol Rev. 2002;185:126–135. - PubMed

Publication types

MeSH terms