

A primer on network meta-analysis with emphasis on mental health
- PMID: 25908686
- PMCID: PMC11234956
- DOI: 10.1136/eb-2015-102088
A primer on network meta-analysis with emphasis on mental health
Abstract
Objective: A quantitative synthesis of evidence via standard pair-wise meta-analysis lies on the top of the hierarchy for evaluating the relative effectiveness or safety between two interventions. In most healthcare problems, however, there is a plethora of competing interventions. Network meta-analysis allows to rank competing interventions and evaluate their relative effectiveness even if they have not been compared in an individual trial. The aim of this paper is to explain and discuss the main features of this statistical technique.
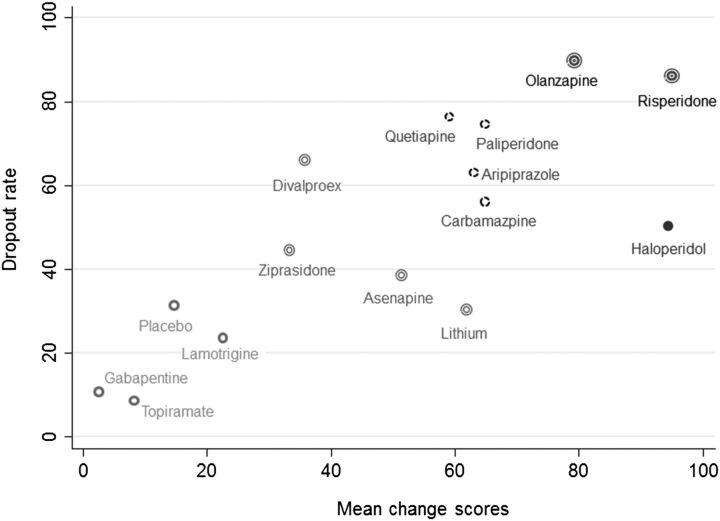
Methods: We present the key assumptions underlying network meta-analysis and the graphical methods to visualise results and information in the network. We used one illustrative example that compared the relative effectiveness of 15 antimanic drugs and placebo in acute mania.
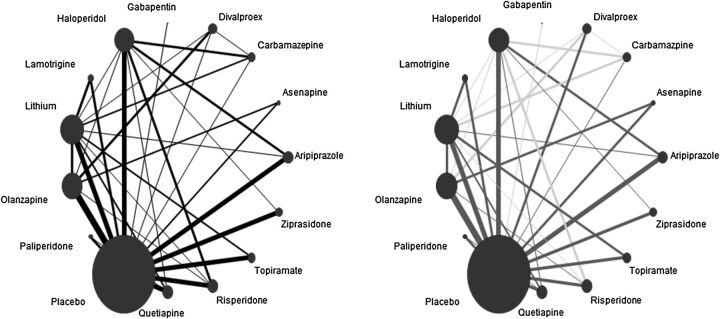
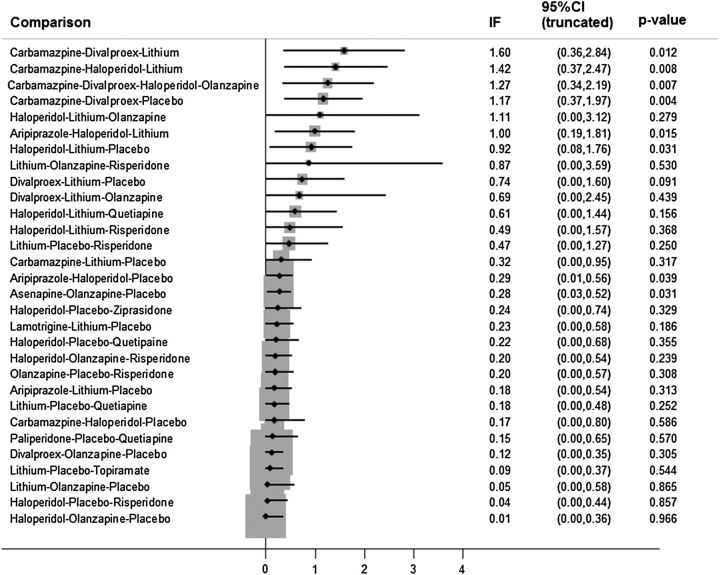
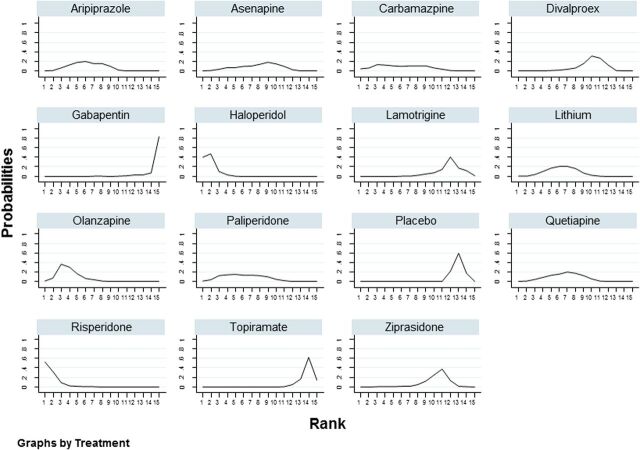
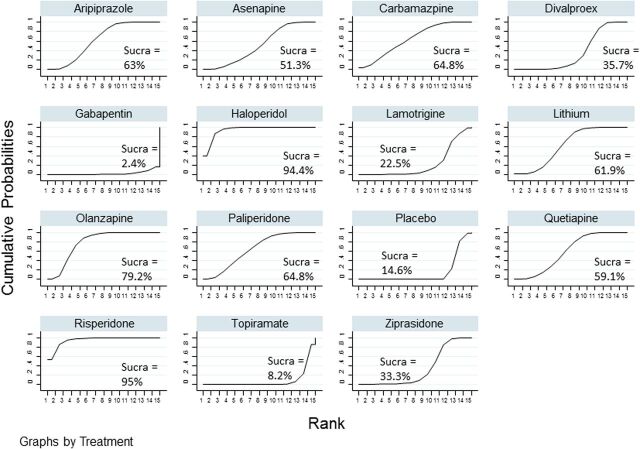
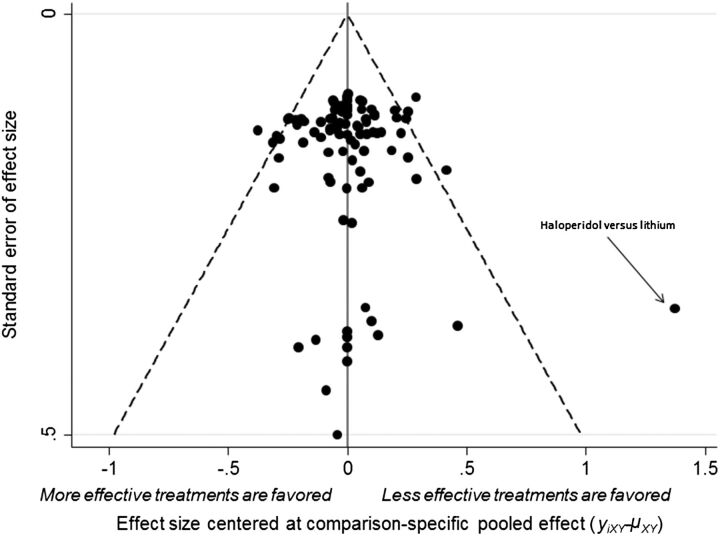
Results: A network plot allows to visualise how information flows in the network and reveals important information about network geometry. Discrepancies between direct and indirect evidence can be detected using inconsistency plots. Relative effectiveness or safety of competing interventions can be presented in a league table. A contribution plot reveals the contribution of each direct comparison to each network estimate. A comparison-adjusted funnel plot is an extension of simple funnel plot to network meta-analysis. A rank probability matrix can be estimated to present the probabilities of all interventions assuming each rank and can be represented using rankograms and cumulative probability plots.
Conclusions: Network meta-analysis is very helpful in comparing the relative effectiveness and acceptability of competing treatments. Several issues, however, still need to be addressed when conducting a network meta-analysis for the results to be valid and correctly interpreted.
Published by the BMJ Publishing Group Limited. For permission to use (where not already granted under a licence) please go to http://group.bmj.com/group/rights-licensing/permissions.
Figures
References
-
- Centre for Evidence Based Medicine. Levels of evidence. 2015. http://www.cebm.net
Publication types
MeSH terms
Grants and funding
LinkOut - more resources
Full Text Sources
Medical