. 2015 May 15;128(10):1901-11.
doi: 10.1242/jcs.161703. Epub 2015 Apr 23.

The nucleus is an intracellular propagator of tensile forces in NIH 3T3 fibroblasts

Affiliations

The nucleus is an intracellular propagator of tensile forces in NIH 3T3 fibroblasts

Samer G Alam et al. J Cell Sci. .

Abstract

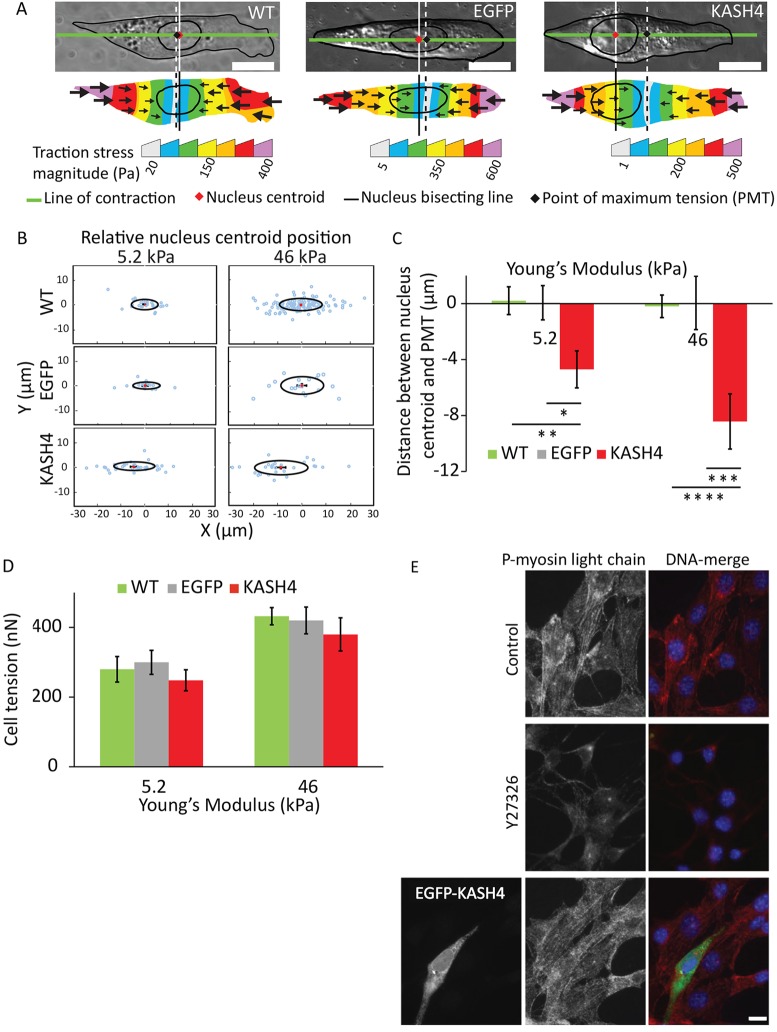
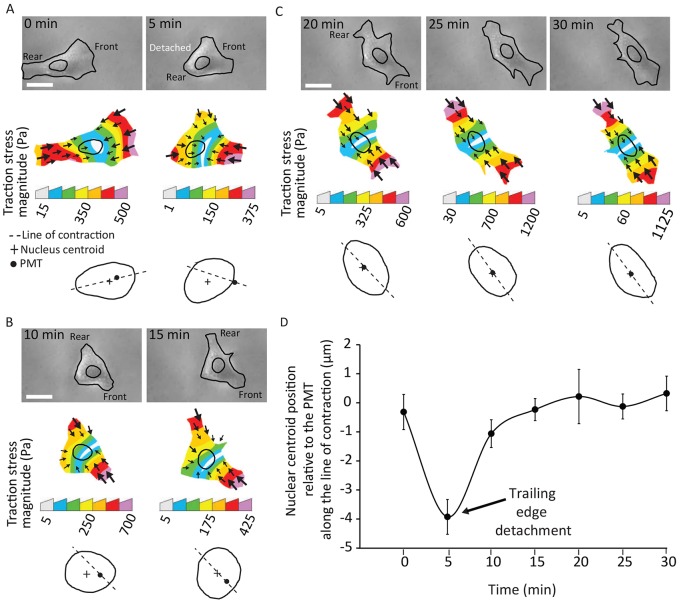
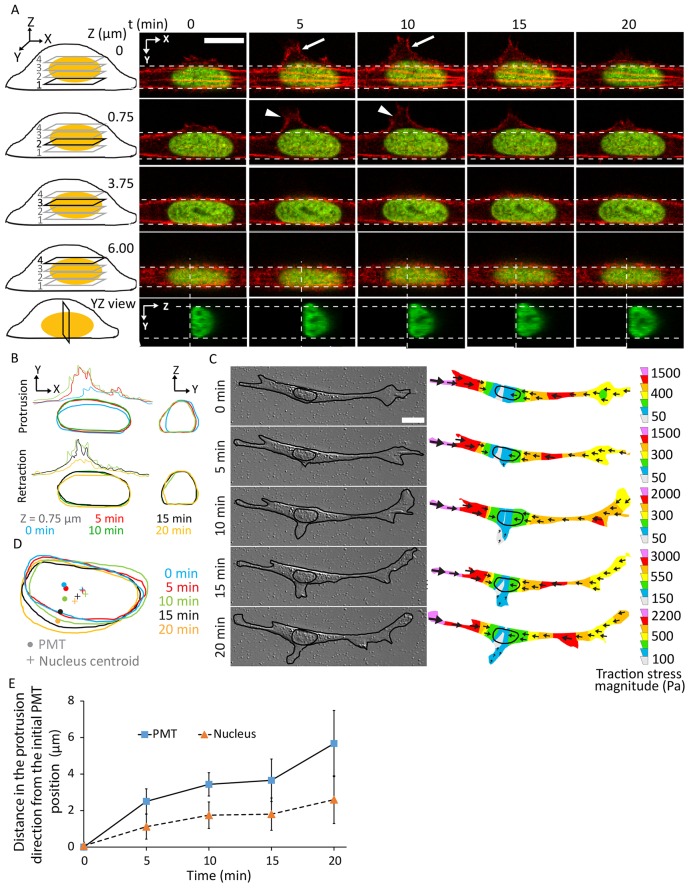
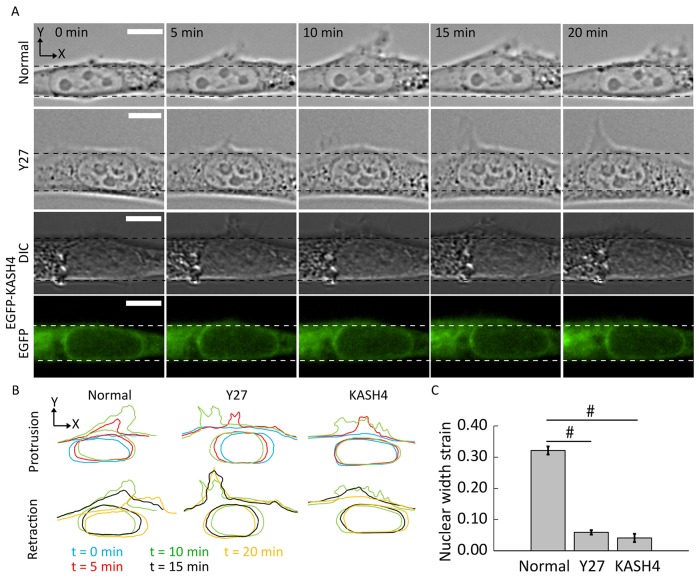
Nuclear positioning is a crucial cell function, but how a migrating cell positions its nucleus is not understood. Using traction-force microscopy, we found that the position of the nucleus in migrating fibroblasts closely coincided with the center point of the traction-force balance, called the point of maximum tension (PMT). Positioning of the nucleus close to the PMT required nucleus-cytoskeleton connections through linker of nucleoskeleton-to-cytoskeleton (LINC) complexes. Although the nucleus briefly lagged behind the PMT following spontaneous detachment of the uropod during migration, the nucleus quickly repositioned to the PMT within a few minutes. Moreover, traction-generating spontaneous protrusions deformed the nearby nucleus surface to pull the nuclear centroid toward the new PMT, and subsequent retraction of these protrusions relaxed the nuclear deformation and restored the nucleus to its original position. We propose that the protruding or retracting cell boundary transmits a force to the surface of the nucleus through the intervening cytoskeletal network connected by the LINC complexes, and that these forces help to position the nucleus centrally and allow the nucleus to efficiently propagate traction forces across the length of the cell during migration.

Keywords: Cytoskeleton; KASH4; LINC complex; Nucleus; Tensile forces; Traction stress.


Conflict of interest statement

Competing interests

The authors declare no competing or financial interests.

Figures

Fig. 1.
Fig. 1.
Nuclear positioning coincides with the PMT in the cell in a nucleus–cytoskeleton-linkage-dependent manner. (A) DIC images show the position of the nucleus in wild-type (WT), EGFP-expressing (EGFP) and KASH4-expressing (KASH4) cells. The nuclear centroid coincides with the point of maximum tension (PMT, calculated as shown here and described in Materials and Methods) in control but lags behind it in KASH4-expressing cells. Vertical solid and dashed lines indicate the positions of the nuclear centroid and the PMT, respectively. (B) Scatter plots of nucleus centroid positions with respect to the PMT in wild-type (WT), EGFP-expressing (EGFP) and KASH4-expressing cells on gels with Young's moduli of 5.2 or 46 kPa. For each sample, the x and y coordinates of the PMT and the nucleus centroids were rotated such that the line of contraction was parallel to the x-axis and the leading edge of the cell was facing the positive x-axis, and translocated such that the PMT lay at the origin. Red dots represent the mean. Ovals represent standard deviation. (C) Bar plot of the data in B showing that the nuclear position closely coincides with the PMT in wild-type (WT) and EGFP-expressing cells (EGFP), whereas it lags behind the PMT by several microns in KASH4-expressing (KASH4) cells. The trend is independent of substrate stiffness. N≥20 for each condition. *P<0.05, **P<0.025, ***P<0.005, ****P<0.0005. (D) Disruption of the LINC complex does not alter cell tension. No significant difference was observed in the average cell tension between wild-type (WT), EGFP-expressing (EGFP) and KASH4-expressing (KASH4) cells. N≥18 for each condition. (E) Myosin II activity is not significantly different between control and KASH4-expressing cells. Fluorescent images of control cells (top row) and Y27-treated cells (1 hour) (middle row) fixed and stained for phosphorylated myosin light chain 2 (red) and DNA (blue) show the decreased presence of active myosin in Y27-treated cells. The bottom row shows a KASH4-transfected cell (green) having similar myosin activity as that of the surrounding control cells, as apparent from the comparable phosphorylated myosin light chain signal. Error bars represent s.e.m. Scale bars: 10 µm.
Fig. 2.
Fig. 2.
The nucleus is dynamically moved in the direction of the PMT. (A) DIC images of a representative cell during different phases of migration (top), the corresponding traction-stress maps (middle) and corresponding nuclear outlines showing the relative positions of the PMT and nuclear centroid (bottom). Following spontaneous tail detachment, the PMT moves towards the leading edge and the nucleus lags behind it. (B) The nucleus does not respond quickly and lags behind the PMT for a few minutes. (C) The nucleus dynamically re-coincides with the PMT as the cell shape is re-established. Scale bars: 20 µm. (D) Time-dependent profile of the position of the nuclear centroid relative to the PMT along the line of contraction. The nuclear centroid lags behind the PMT just after the detachment of the trailing edge (t=5 minutes) and then is moved to coincide with it over time. Error bars represent s.e.m. N=10 cells.
Fig. 3.
Fig. 3.
Local reversible nuclear deformation in response to local protrusion and retraction. (A) Fluorescent images of a migrating cell transfected with red fluorescent protein (RFP)–LifeAct (F-actin) and GFP–histone-H1 (nucleus) on glass showing the formation and retraction of a lateral protrusion near the nucleus (arrows) at various confocal planes (planes 1–4 in the cartoon on the left) and the reversible nuclear deformation (in the x–y plane) accompanying the protrusion. y–z view of the nucleus at the mid-plane shows the deformation in the y–z plane. Vertical dashed lines indicate the position of the corresponding y–z plane. Arrowheads indicate the cell cortex moving outward. (B) Outlines of the protrusion (top left) and retraction (bottom left) of the newly formed local protrusion and the associated nuclear shape at the different time points. y–z views showing the reversible nuclear deformation (right panels). (C) DIC images of a representative cell on 46-kPa gel during the formation of a lateral protrusion, and the corresponding traction stress maps. (D) Overlay of the nuclei and PMTs in C showing the correlation in the motion of the PMT and nuclear centroid. (E) Time-dependent profiles of lateral distances of the PMT and nucleus centroid from the initial PMT position. Error bars represent s.e.m. N=10 cells. Scale bars: 10 µm.
Fig. 4.
Fig. 4.
Significant nuclear deformation in response to local protrusion proximal to the nuclear surface requires myosin II activity and an intact LINC complex. (A) The formation and retraction of a lateral protrusion near the nucleus in control, Y27-treated and KASH4-overexpressing cells. Noticeable nuclear deformation is observed in control cells but not in myosin-II-inhibited or LINC-complex-disrupted cells. Scale bars: 10 µm. (B) Outlines of the protrusion (top) and retraction (bottom) of the newly formed local protrusion and the associated nuclear shape at the different time points. (C) Quantification of nuclear deformation upon the formation of lateral protrusion as measured by the strain in the nuclear width at the maximum deformation point. Strains represent the change (final−initial) in the nuclear width at the maximum deformation point divided by its initial value. Error bars represent s.e.m. N≥17 for each condition (for ‘Normal’, 121 cells were observed, 102 cells had protrusions and 102 cells were analyzed for strain calculation). For Y27-treated cells, 178 cells were observed, 150 cells had protrusions and 150 cells were analyzed for strain calculation. For KASH4 expression, 25 cells were observed, 17 cells had protrusions and 17 cells were analyzed for strain calculations. Each cell was observed for more than 8 hours. #P<0.00001.
Fig. 5.
Fig. 5.
The nucleus does not expand laterally upon severing lateral stress fibers running parallel to it. (A) Kymograph during the formation and retraction of the lateral protrusion. No motion of the actin bundles underneath the nucleus is noticeable as it undergoes the local deformation. (B) Cartoon showing the two types of lateral actin stress fibers that were severed in this study. (C) A schematic showing the laser ablation experiment of lateral stress fibers. (D) Confocal images showing that laser ablation of a lateral stress fiber running parallel to the side of the nucleus either not touching it (top) or touching it (bottom) does not cause expansion in the nuclear area. Insets show the two sides of the severed stress fiber. Arrowheads indicate the severing point. Arrows indicate the two ends of the severed stress fiber. (E) Quantification of the nuclear shape change before and after lateral stress fiber severing showing a small decrease in the nuclear major and minor axes, and area upon stress fiber severing. Strains represent the change (final−initial) in the parameter divided by its initial value. Error bars represent s.e.m. N=10. *P<0.05 compared to 0. Scale bars: 6 µm (A); 10 µm (D, actin, actin inserts); 5 µm (D, nucleus).
Fig. 6.
Fig. 6.
Traction-force dynamics in migrating cells reveals that the nucleus is a propagator of internal force. (A) DIC images of migrating cells before and after trailing-edge detachment events. Spontaneous tail detachment occurs more rapidly in wild-type (WT) and EGFP-expressing cells (EGFP) than in KASH4-expressing (KASH4) cells. Scale bars: 10 µm. (B) Time-dependent profiles of decaying nuclear bisector tension (NBT) on two substrates of differing stiffness (top and bottom panels) following spontaneous detachment of the trailing edge in wild-type (WT), EGFP-expressing (EGFP) and KASH4-expressing (KASH4) cells. The drop in NBT was slower and smaller in KASH4-expressing cells compared with that of control cells. (C) Comparison of the percentage drop in NBT following spontaneous tail detachment between wild-type (WT), EGFP-expressing (EGFP) and KASH4-expressing (KASH4) cells on two substrates of differing stiffness. A larger drop is observed in control than in KASH4-expressing cells. The trend does not depend on the stiffness of the underlying substrate. Error bars represent s.e.m. N=5. **P<0.025, ***P<0.005.
Fig. 7.
Fig. 7.
The LINC complex transmits forces across the nucleus. (A) DIC images (top), cell and nuclear outlines (middle) and corresponding traction stress maps (bottom) of migrating wild-type (WT), EGFP-expressing (EGFP) and KASH4-expressing (KASH4) cells before and after forced trailing-edge detachment. Scale bars: 20 µm. (B) Bar plot showing a comparison between the percentage drop in traction stress at the midpoint between the leading edge and the nucleus after forced detachment of the trailing edge between wild-type (WT), EGFP-expressing (EGFP) and KASH4-expressing (KASH4) cells on two substrates of differing stiffness. A much more substantial drop is observed in control than in KASH4-expressing cells. The trends do not depend on the rigidity of the underlying substrate. Error bars represent s.e.m. N≥10. *P<0.05, **P<0.025.
Fig. 8.
Fig. 8.
Physical model of nuclear force balance showing the relative positions of the cell centroid, nuclear centroid and the PMT in wild-type and KASH4-expressing migrating cells. In control cells, the nuclear centroid coincides with the PMT, whereas the centroid lags behind the PMT in KASH4-expressing (KASH4) cells. WT, wild type.

References

    1. Burke B. and Roux K. J. (2009). Nuclei take a position: managing nuclear location. Dev. Cell 17, 587-597. 10.1016/j.devcel.2009.10.018 - DOI - PubMed
    1. Chancellor T. J., Lee J., Thodeti C. K. and Lele T. (2010). Actomyosin tension exerted on the nucleus through nesprin-1 connections influences endothelial cell adhesion, migration, and cyclic strain-induced reorientation. Biophys. J. 99, 115-123. 10.1016/j.bpj.2010.04.011 - DOI - PMC - PubMed
    1. Chang W., Folker E. S., Worman H. J. and Gundersen G. G. (2013). Emerin organizes actin flow for nuclear movement and centrosome orientation in migrating fibroblasts. Mol. Biol. Cell 24, 3869-3880. 10.1091/mbc.E13-06-0307 - DOI - PMC - PubMed
    1. Dembo M. and Wang Y. L. (1999). Stresses at the cell-to-substrate interface during locomotion of fibroblasts. Biophys. J. 76, 2307-2316. 10.1016/S0006-3495(99)77386-8 - DOI - PMC - PubMed
    1. Desai R. A., Gao L., Raghavan S., Liu W. F. and Chen C. S. (2009). Cell polarity triggered by cell-cell adhesion via E-cadherin. J. Cell Sci. 122, 905-911. 10.1242/jcs.028183 - DOI - PMC - PubMed

Publication types

LinkOut - more resources