. 2015 May 15;128(10):1991-2001.
doi: 10.1242/jcs.168682. Epub 2015 Apr 23.

Probing microtubule polymerisation state at single kinetochores during metaphase chromosome motion

Affiliations

Probing microtubule polymerisation state at single kinetochores during metaphase chromosome motion

Jonathan W Armond et al. J Cell Sci. .

Abstract

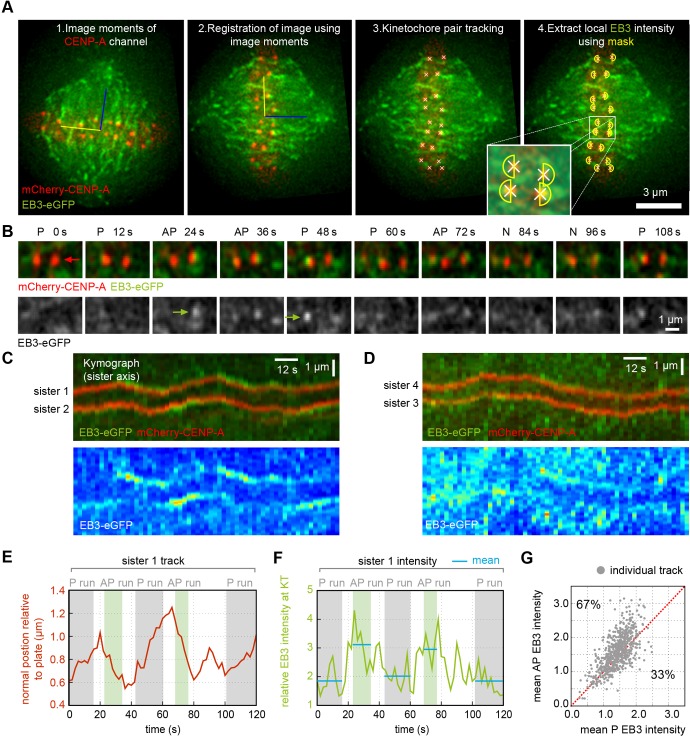
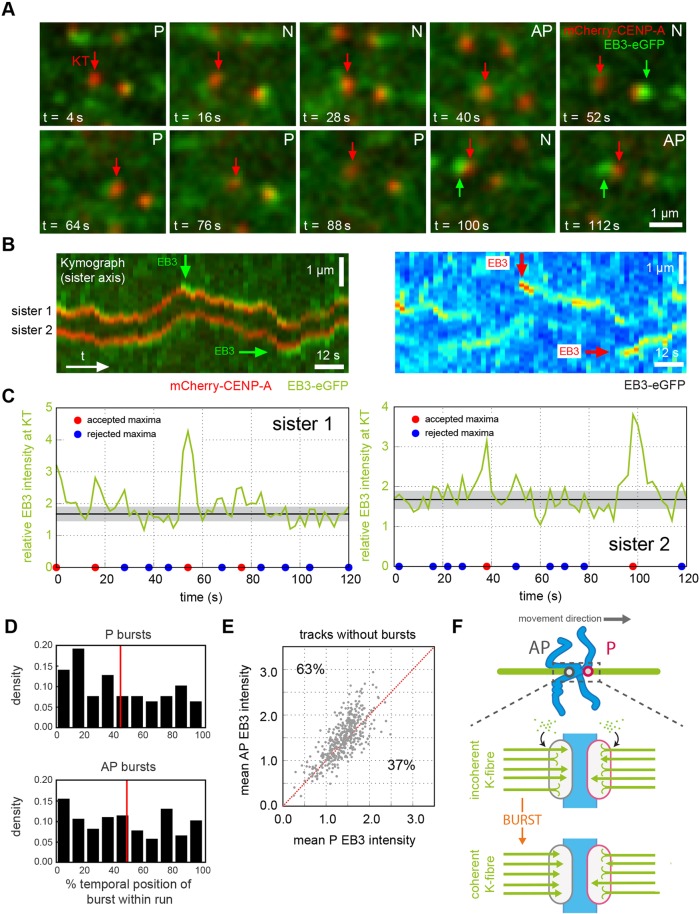
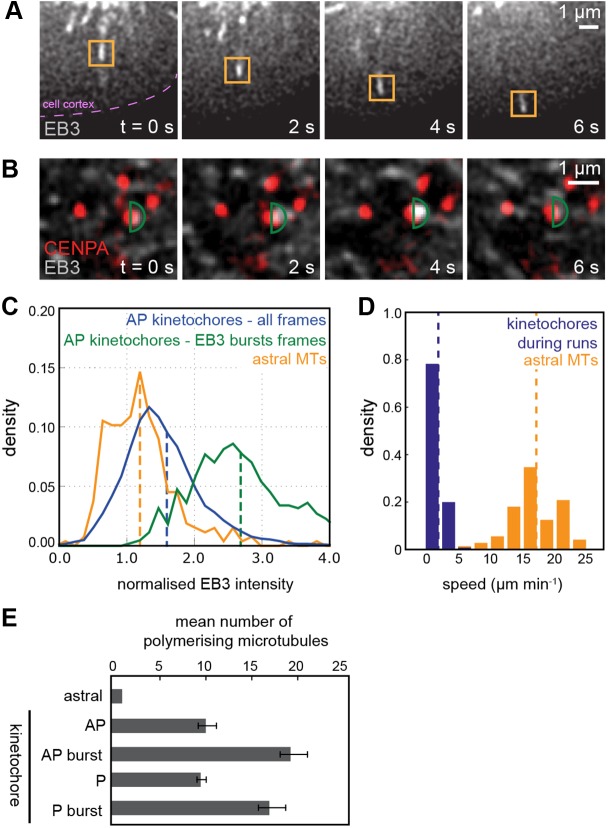
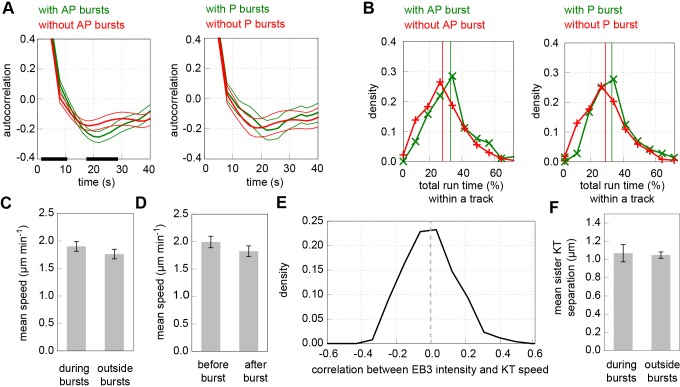
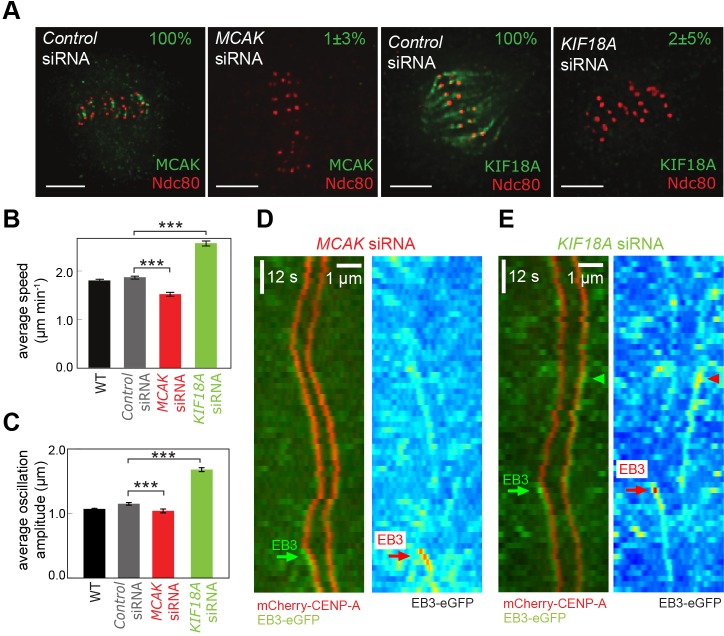
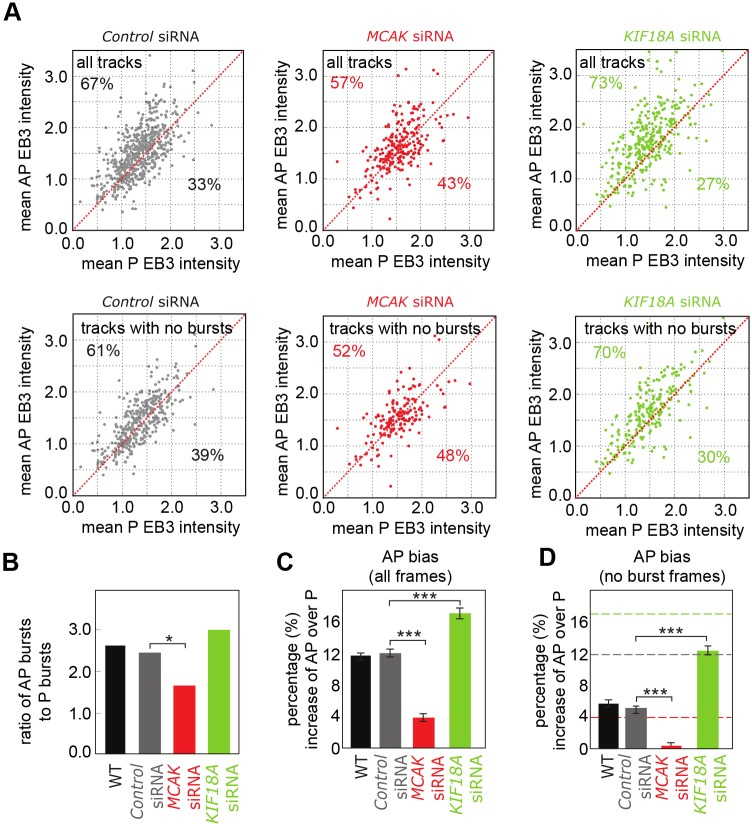
Kinetochores regulate the dynamics of attached microtubule bundles (kinetochore-fibres, K-fibres) to generate the forces necessary for chromosome movements in mitosis. Current models suggest that poleward-moving kinetochores are attached to depolymerising K-fibres and anti-poleward-moving kinetochores to polymerising K-fibres. How the dynamics of individual microtubules within the K-fibre relate to poleward and anti-poleward movements is poorly understood. To investigate this, we developed a live-cell imaging assay combined with computational image analysis that allows eGFP-tagged EB3 (also known as MAPRE3) to be quantified at thousands of individual metaphase kinetochores as they undergo poleward and anti-poleward motion. Surprisingly, we found that K-fibres are incoherent, containing both polymerising and depolymerising microtubules – with a small polymerisation bias for anti-poleward-moving kinetochores. K-fibres also display bursts of EB3 intensity, predominantly on anti-poleward-moving kinetochores, equivalent to more coherent polymerisation, and this was associated with more regular oscillations. The frequency of bursts and the polymerisation bias decreased upon loss of kinesin-13, whereas loss of kinesin-8 elevated polymerisation bias. Thus, kinetochores actively set the balance of microtubule polymerisation dynamics in the K-fibre while remaining largely robust to fluctuations in microtubule polymerisation.

Keywords: EB3; K-fibres; KIF18A; Kinesin; Kinetochores; MCAK; Mitosis.


Conflict of interest statement

Competing interests

The authors declare no competing or financial interests.

Figures

Fig. 1.
Fig. 1.
EB3 preference for anti-poleward-moving kinetochores. (A) 2D tracking of kinetochore positions (labelled with mCherry–CENP-A; red). 1: Image moments from the mCherry channel and centre of mass given by both channels define an (x,y) reference frame (blue and yellow lines). 2: Frames were registered using this coordinate system. The blue line is the spindle axis, yellow line is in the metaphase plate. 3: Kinetochore spots were located and tracked as described previously (Jaqaman et al., 2010). 4: Semi-circular masks (yellow) were centred on kinetochores orientated along the spindle axis allowing measurement of kinetochore-proximal EB3–eGFP intensity (green). (B) Individual frames from a typical mCherry–CENP-A EB3–eGFP movie in merged (top) and greyscale EB3–eGFP (bottom). The movement state of one kinetochore (red arrows) as poleward (P) or anti-poleward (AP) is given on top of each frame. N indicates directionless. EB3 labelling of the anti-poleward kinetochore is indicated by green arrows on greyscale image. (C,D) Kymographs of sister kinetochore pairs showing merged mCherry–CENP-A and EB3–eGFP (top) and false-colour EB3–eGFP (bottom). The kymograph profile is aligned along the sister–sister axis and is maintained at a fixed distance to the metaphase plate. This allows the visualisation of oscillations (see Materials and Methods), as opposed to kymographs that centre on the pair of kinetochores. (E) Kinetochore position relative to the metaphase plate versus time plot of sister 1 highlighted in C with anti-poleward (AP) runs shaded light green and poleward (P) runs shaded grey. Note that algorithm is conservative to avoid including directional switches where direction is uncertain. (F) Maximum EB3–eGFP intensity measured within the kinetochore mask (yellow semicircle in A) for sister 1 shown in C. Blue horizontal lines indicate means of each run. (G) Mean EB3–eGFP intensity of anti-poleward (AP) runs and poleward (P) runs within each track (n=850). Grey dots represent individual tracks. The red line indicates the mean EB3–eGFP intensity of anti-poleward runs being equal to mean EB3–eGFP intensity of poleward runs; the percentage of tracks above and below this line are indicated.
Fig. 2.
Fig. 2.
Identifying kinetochores with EB3 bursts. (A) Typical movie of a kinetochore with an EB3 burst. The red arrow indicates location of sister kinetochore 2 shown in B. The green arrow indicates an EB3 burst. P, poleward-moving kinetochore; AP, anti-poleward-moving kinetochore; N, directionless kinetochore. (B) Kymograph along the sister–sister axis of the kinetochore pair in A, showing EB3 bursts during anti-poleward runs (left). Same kymograph showing the EB3–eGFP channel in false colours (right). Red and blue indicate high and low intensity, respectively. (C) Maximum EB3–eGFP intensity signal within the mask of the kinetochore pair shown in B. Left panel, sister 1; right panel, sister 2. Large EB3 bursts occur at 54 s on sister 1 and at 38 s and 98 s on sister 2. Black line indicates mean EB3–eGFP signal excluding largest and smallest 10% of values, and shaded region indicates ±s.d. Local maxima in fluorescence were assessed for significance and the outcome of the test is shown at the base of each panel as accepted local maxima (red dot) and rejected maxima (blue dot). (D) Histogram of temporal position of poleward bursts (top; n=71) and anti-poleward bursts (bottom; n=248) within runs expressed as a percentage of run time to account for differing run lengths. The red line indicates mean burst time – 44% for poleward bursts (top) and 47% for anti-poleward bursts (bottom). (E) Mean EB3–eGFP intensity of anti-poleward runs and poleward runs within each track not containing an EB3 burst during any identified run within the track (n=604); grey dots represent individual tracks. The red line indicates the mean EB3–eGFP intensity of anti-poleward runs being equal to mean EB3–eGFP intensity of poleward runs; the percentage of tracks above and below this line are indicated. (F) Model of K-fibre during bursts. In normal circumstances (top) K-fibres from both sisters are in an incoherent polymerisation state. During a burst on the trailing (anti-poleward, AP) sister the majority of the MTs in this K-fibre become polymerising (bottom).
Fig. 3.
Fig. 3.
Assessing degree of polymerisation in K-fibre by comparison to astral MTs. (A) Growth of astral MT labelled with EB3–eGFP at the tip. The orange box indicates the mask used to measure maximum intensity of astral MT. Note that given that the MT is locally the brightest feature the size and shape of the mask is not important provided it encloses only the MT tip of interest. (B) Oscillating kinetochore pair labelled with mCherry–CENP-A (red) shown in overlay with EB3–eGFP (greyscale). The anti-poleward moving kinetochore (right sister of pair) experiences a burst in EB3–eGFP localisation at 4 s. Green semi-circle indicates fluorescent intensity measurement mask (radius 0.3 µm). The maximum pixel intensity within this mask is recorded. (C) Histogram showing intensity distribution of EB3–eGFP within the kinetochore mask (maximum pixel intensity within the mask is used), for all frames of anti-poleward kinetochores (blue) and during anti-poleward bursts (green; see B). The maximum mask intensity distribution of astral MT EB3 comets is shown in orange (see A). The average normalised EB3 intensities (indicated by dashed line) for astral MTs, anti-poleward kinetochores (all frames) and EB3 burst frames are 1.2, 1.6 and 2.7, respectively. (D) Kinetochore speeds (blue) during runs and astral MT speeds (orange) for growing astral MTs. The average speeds (indicated by dashed line) are 1.8 µm min−1 and 17 µm min−1 respectively (n=850 and 73, respectively). (E) Estimated mean number of polymerising MTs in anti-poleward (AP) and poleward (P) KTs and during anti-poleward (AP burst) and poleward bursts (P burst), compared to a single astral MT (see supplementary material Table S3 for details). Results represent mean±s.d. anti-poleward (AP, n=7134), anti-poleward with burst (AP burst, n=456), poleward (P, n=7058), poleward with burst (P burst, n=160).
Fig. 4.
Fig. 4.
Effects of bursts on kinetochore dynamics. (A) Autocorrelation of kinetochore centre position displacement in direction normal to metaphase plate in tracks with (green, n=197) and without (red, n=653) anti-poleward (AP) bursts (left panel) and similarly for poleward (P) bursts (right panel; green, n=66; red, n=784). Shown are mean±s.e.m. autocorrelations. The black lines along the horizontal axis represent significant difference at the 1% level. (B) Total length of time spent in directed runs for each track as a percentage of track length, in tracks with (green, n=197) and without (red, n=653) an EB3 burst, in anti-poleward (left) and poleward bursting tracks (right; green, n=66; red, n=784). Vertical lines indicate means. (C) Mean kinetochore speed in a window of five frames around a burst (left; n=279) and mean from each run excluding the burst window (right; n=279). Error bars indicate s.e.m. (D) Mean kinetochore speed in 3 frames before the burst (left) and 3 frames after burst (right), not including the burst frame itself (n=319). Error bars indicate s.e.m. (E) Distribution of correlation between EB3–eGFP intensity and kinetochore speed (n=850). Dashed line indicates mean. (F) Mean separation between sister kinetochores in a window of five frames around a burst (left; n=112) and mean from each run excluding the burst window (right; n=112). Error bars indicate s.e.m.
Fig. 5.
Fig. 5.
The MT regulators MCAK and KIF18A influence EB3 localisation. (A) Immunofluorescence images demonstrating siRNA depletion of MCAK and KIF18A. Percentage values quantify levels of depletion (mean±s.e.m., n=50). Scale bars: 5 µm. (B) Mean±s.e.m. (n=850, 850, 350, 469 respectively) kinetochore speed during runs for wild-type (WT), and control, MCAK and KIF18A siRNA-treated cells. (C) Mean±s.e.m. (n=850, 850, 350, 469 respectively) kinetochore oscillation amplitude for WT, and control MCAK and KIF18A siRNA-treated cells. ***P<0.001. (D) Kymograph of sister kinetochore pair in cells with MCAK depleted by siRNA, showing mCherry–CENP-A (red) and EB3–eGFP (green). Green arrows indicate strong EB3 localisation. The EB3–eGFP signal also shown in false colour. (E) As D, for cells with KIF18A depleted by siRNA.
Fig. 6.
Fig. 6.
Depletion of MCAK and KIF18A inhibits and enhances EB3 anti-poleward bias, respectively. (A) Top, mean EB3–eGFP intensity of anti-poleward (AP) runs and poleward (P) runs within each track in control (left), MCAK (middle) and KIF18A (right) siRNA-treated cells (n=850, 350, and 469, respectively). Bottom, mean EB3–eGFP intensity of anti-poleward runs and poleward runs within tracks with no bursts in control (left), MCAK (middle) and KIF18A (right) siRNA cells (n=583, 262, and 352, respectively). The red line indicates the mean EB3–eGFP intensity of anti-poleward runs being equal to mean EB3–eGFP intensity of poleward runs; the percentage of tracks above and below this line are indicated. (B) Ratio of anti-poleward burst count to poleward burst count. WT, wild-type. (C) Bias of EB3 for anti-poleward kinetochore as a percentage increase over poleward kinetochore intensity (average across all frames). Results are the mean±s.e.m., see supplementary Table S2 rows 2, 29 and 36 for n. (D) Bias of EB3 for anti-poleward kinetochore as a percentage increase over poleward kinetochore intensity in tracks with bursts frames excluded. Results are the mean±s.e.m., see supplementary Table S2 rows 8, 30 and 37 for n. Dashed lines indicate the bias of frames in all tracks for comparison for control (grey), MCAK siRNA (red), KIF18A siRNA (green) from (C). *P<0.05; ***P<0.001.

References

    1. Amaro A. C., Samora C. P., Holtackers R., Wang E., Kingston I. J., Alonso M., Lampson M., McAinsh A. D. and Meraldi P. (2010). Molecular control of kinetochore-microtubule dynamics and chromosome oscillations. Nat. Cell Biol. 12, 319-329. 10.1038/ncb2033 - DOI - PMC - PubMed
    1. Bieling P., Laan L., Schek H., Munteanu E. L., Sandblad L., Dogterom M., Brunner D. and Surrey T. (2007). Reconstitution of a microtubule plus-end tracking system in vitro. Nature 450, 1100-1105. 10.1038/nature06386 - DOI - PubMed
    1. Cassimeris L. and Morabito J. (2004). TOGp, the human homolog of XMAP215/Dis1, is required for centrosome integrity, spindle pole organization, and bipolar spindle assembly. Mol. Biol. Cell 15, 1580-1590. 10.1091/mbc.E03-07-0544 - DOI - PMC - PubMed
    1. Cheeseman I. M. and Desai A. (2008). Molecular architecture of the kinetochore-microtubule interface. Nat. Rev. Mol. Cell Biol. 9, 33-46. 10.1038/nrm2310 - DOI - PubMed
    1. Civelekoglu-Scholey G., Sharp D. J., Mogilner A. and Scholey J. M. (2006). Model of chromosome motility in Drosophila embryos: adaptation of a general mechanism for rapid mitosis. Biophys. J. 90, 3966-3982. 10.1529/biophysj.105.078691 - DOI - PMC - PubMed

Publication types