

Laser tissue coagulation and concurrent optical coherence tomography through a double-clad fiber coupler
- PMID: 25909013
- PMCID: PMC4399668
- DOI: 10.1364/BOE.6.001293
Laser tissue coagulation and concurrent optical coherence tomography through a double-clad fiber coupler
Abstract
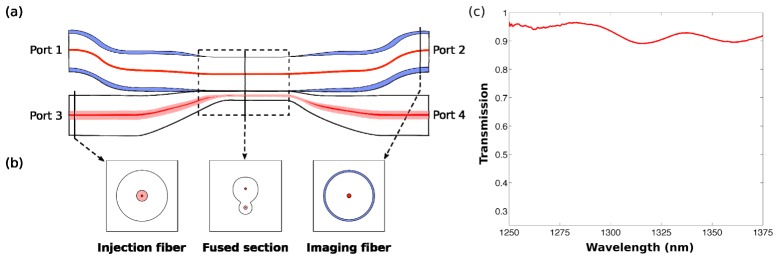
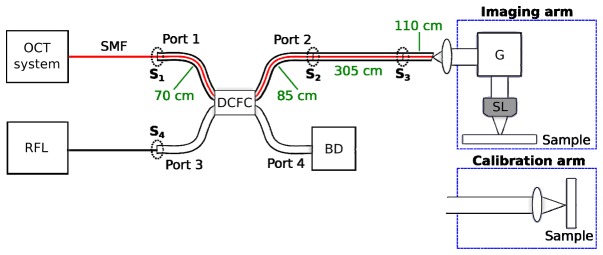
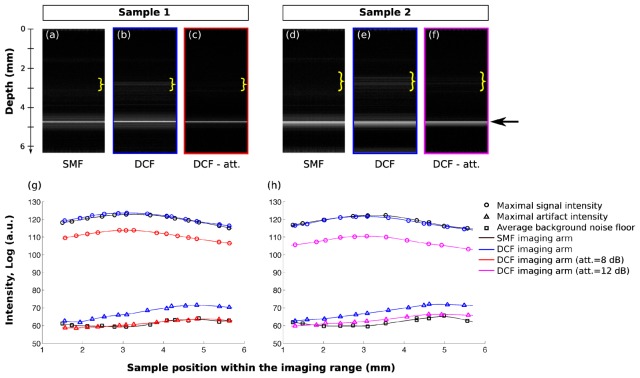
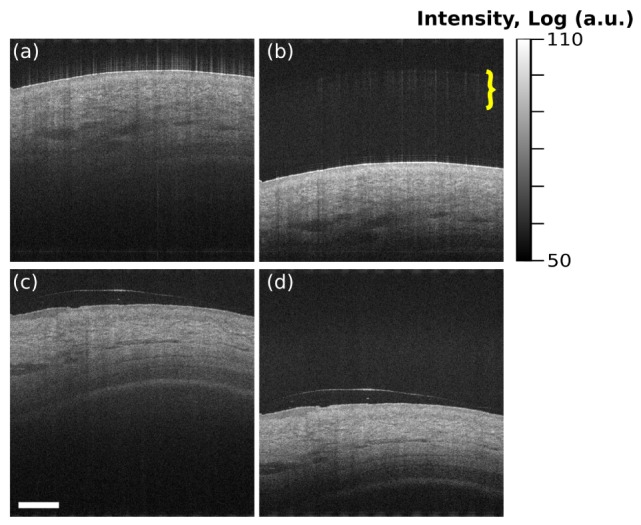
Double-clad fiber (DCF) is herein used in conjunction with a double-clad fiber coupler (DCFC) to enable simultaneous and co-registered optical coherence tomography (OCT) and laser tissue coagulation. The DCF allows a single channel fiber-optic probe to be shared: i.e. the core propagating the OCT signal while the inner cladding delivers the coagulation laser light. We herein present a novel DCFC designed and built to combine both signals within a DCF (>90% of single-mode transmission; >65% multimode coupling). Potential OCT imaging degradation mechanisms are also investigated and solutions to mitigate them are presented. The combined DCFC-based system was used to induce coagulation of an ex vivo swine esophagus allowing a real-time assessment of thermal dynamic processes. We therefore demonstrate a DCFC-based system combining OCT imaging with laser coagulation through a single fiber, thus enabling both modalities to be performed simultaneously and in a co-registered manner. Such a system enables endoscopic image-guided laser marking of superficial epithelial tissues or laser thermal therapy of epithelial lesions in pathologies such as Barrett's esophagus.
Keywords: (060.2340) Fiber optics components; (170.2150) Endoscopic imaging; (170.3880) Medical and biological imaging; (170.3890) Medical optics instrumentation; (170.4500) Optical coherence tomography.
Figures
References
-
- Suter M. J., Jillella P. A., Vakoc B. J., Halpern E. F., Mino-Kenudson M., Lauwers G. Y., Bouma B. E., Nishioka N. S., Tearney G. J., “Image-guided biopsy in the esophagus through comprehensive optical frequency domain imaging and laser marking: a study in living swine,” Gastrointest. Endosc. 71(2), 346–353 (2010). 10.1016/j.gie.2009.07.007 - DOI - PMC - PubMed
-
- Suter M. J., Gora M. J., Lauwers G. Y., Arnason T., Sauk J., Gallagher K. A., Kava L., Tan K. M., Soomro A. R., Gallagher T. P., Gardecki J. A., Bouma B. E., Rosenberg M., Nishioka N. S., Tearney G. J., “Esophageal-guided biopsy with volumetric laser endomicroscopy and laser cautery marking: a pilot clinical study,” Gastrointest. Endosc. 79(6), 886–896 (2014). 10.1016/j.gie.2013.11.016 - DOI - PMC - PubMed
-
- Suter M. J., Vakoc B. J., Yachimski P. S., Shishkov M., Lauwers G. Y., Mino-Kenudson M., Bouma B. E., Nishioka N. S., Tearney G. J., “Comprehensive microscopy of the esophagus in human patients with optical frequency domain imaging,” Gastrointest. Endosc. 68(4), 745–753 (2008). 10.1016/j.gie.2008.05.014 - DOI - PMC - PubMed
-
- Vakoc B. J., Shishko M., Yun S. H., Oh W. Y., Suter M. J., Desjardins A. E., Evans J. A., Nishioka N. S., Tearney G. J., Bouma B. E., “Comprehensive esophageal microscopy by using optical frequency-domain imaging (with video),” Gastrointest. Endosc. 65(6), 898–905 (2007). 10.1016/j.gie.2006.08.009 - DOI - PMC - PubMed
Grants and funding
LinkOut - more resources
Full Text Sources
Other Literature Sources