. 2015 May 20;6(14):12248-63.
doi: 10.18632/oncotarget.3653.

Loss of the N-terminal methyltransferase NRMT1 increases sensitivity to DNA damage and promotes mammary oncogenesis

Affiliations

Loss of the N-terminal methyltransferase NRMT1 increases sensitivity to DNA damage and promotes mammary oncogenesis

Lindsay A Bonsignore et al. Oncotarget. .

Abstract

Though discovered over four decades ago, the function of N-terminal methylation has mostly remained a mystery. Our discovery of the first mammalian N-terminal methyltransferase, NRMT1, has led to the discovery of many new functions for N-terminal methylation, including regulation of DNA/protein interactions, accurate mitotic division, and nucleotide excision repair (NER). Here we test whether NRMT1 is also important for DNA double-strand break (DSB) repair, and given its previously known roles in cell cycle regulation and the DNA damage response, assay if NRMT1 is acting as a tumor suppressor. We find that NRMT1 knockdown significantly enhances the sensitivity of breast cancer cell lines to both etoposide treatment and γ-irradiation, as well as, increases proliferation rate, invasive potential, anchorage-independent growth, xenograft tumor size, and tamoxifen sensitivity. Interestingly, this positions NRMT1 as a tumor suppressor protein involved in multiple DNA repair pathways, and indicates, similar to BRCA1 and BRCA2, its loss may result in tumors with enhanced sensitivity to diverse DNA damaging chemotherapeutics.

Keywords: DNA damage; DNA repair; N-terminal methylation; NRMT1; breast cancer.


Conflict of interest statement

CONFLICTS OF INTEREST

The authors declare no conflict of interest.

Figures

Figure 1
Figure 1. NRMT1 loss promotes sensitivity to double-strand DNA breaks
(A) Fold change in cell number of MCF-7 NRMT1 KD (black bars) and control (white bars) cells after treatment with 120, 240, and 400 μM etoposide and corresponding LDH release of MCF-7 NRMT1 KD and control cells after treatment with 240 μM etoposide. Fold change in LDH release was calculated by setting the control at 24 hours equal to one. (B) Fold change in cell number of LCC9 NRMT1 KD (black bars) and control (white bars) cells after treatment with 120, 240, and 400 μM etoposide and corresponding LDH release of LCC9 NRMT1 KD and control cells after treatment with 400 μM etoposide. Fold change in LDH release was calculated by setting the control at 24 hours equal to one. (C) Fold change in cell number of MCF-7 NRMT1 KD and control cells after treatment with 12 and 20 Gy γ-irradiation and corresponding LDH release of MCF-7 NRMT1 KD and control cells after treatment with 12 Gy γ-irradiation. Fold change in cell number was calculated by normalizing to transduced MCF-7 cells with no treatment. Fold change in LDH release was calculated by setting the control at 24 hours equal to one. Each bar represents the mean ± SEM of three to four independent experiments. Statistical analysis was by Student's t-test, * denotes p < 0.05. (D) Representative image of immunofluorescence showing more γH2AX foci persist in NRMT1 KD cells 30 min after etoposide treatment as compared to control cells. γH2AX staining is shown in red, Hoechst counterstaining is shown in blue. Cells with foci were counted, and the number of foci per cell calculated 15 and 30 min post-treatment with 240 μM etoposide. Statistical analysis was by Student's t-test, * denotes p < 0.05. (E) NRMT1 localization does not change after 240 μM etoposide treatment, and no NRMT1 foci are observed. NRMT1 immunostaining is shown in red, Hoechst counterstaining is shown in blue.
Figure 2
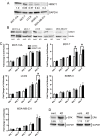
Figure 2. NRMT1 knockdown promotes growth of ER positive breast cancer cell lines
(A) Protein expression levels of NRMT1 and GAPDH (loading control) of all cell lines studied. Ratio of NRMT1 levels compared to GAPDH shown as numbers below each NRMT1 band. (B) Protein expression confirming knockdown of NRMT1 in MCF-10A, MCF-7, LCC9, SKBR-3, and MDA-MB-231 cells treated with lentivirus expressing an shRNAmir against NRMT1 compared to cells treated with control lentivirus. α-tubulin was used as a loading control. (C) Fold change in cell number of MCF-10A, MCF-7, LCC9, SKBR-3, and MDA-MB231 cells treated with lentivirus expressing an shRNAmir against NRMT1 (black bars) compared to the same cell lines treated with control lentivirus (white bars). Fold change was calculated by dividing by the measurements at day zero. Each data point represents the mean ± SEM of three independent experiments. Statistical analysis was by Two-Way Anova, * denotes p < 0.05. (D) Western blot showing levels of phosphorylated ERK (p-ERK) increase with NRMT1 KD, though total ERK levels remain the same. GAPDH is used as a loading control. Ratio of p-ERK or total ERK levels compared to GAPDH are shown as numbers below each ERK band.
Figure 3
Figure 3. NRMT1 overexpression decreases growth of MDA-MB-231 cells
(A) Protein expression confirming NRMT1 overexpression (OE) in MDA-MB-231 cells treated with lentivirus overexpressing NRMT1 compared to cells treated with control lentivirus. GAPDH is used as a loading control. (B) Fold change in cell number of MDA-MB231 cells over-expressing NRMT1 compared to cells treated with control lentivirus. Fold change was calculated by dividing by the measurements at day zero. Each data point represents the mean ± SEM of three independent experiments. Statistical analysis was by Two-Way Anova, * denotes p < 0.05.
Figure 4
Figure 4. Knockdown of NRMT1 in ER positive breast cancer cell lines also increases wound filling capacity
(A) Distance moved in the scratch-wound migration assay of NRMT1 KD MCF-7, LCC9, SKBR-3, and MDA-MB-231 cells (black bars) versus control cells (white bars). Distanced moved was calculated by subtracting scrape widths at the indicated time points from the initial scrape width. (B) Representative phase contrast images of MCF-7 NRMT1 KD cells and MCF-7 control treated cells at 0 hours and 72 hours in the scratch wound migration assay. (C) Representative images of MDA-MB-231 NRMT1 KD cells and MDA-MB-231 control treated cells at 0 hours and 24 hours in the scratch wound migration assay. White arrows denote scrape width and indicate where triplicate measurements were taken. Each data point represents the mean ± SEM of three independent experiments. Statistical analysis was by Two-Way Anova, * denotes p < 0.05.
Figure 5
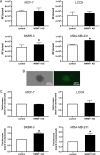
Figure 5. Knockdown of NRMT1 promotes invasive potential and anchorage independent growth of ER negative breast cancer cells
(A) Invasion potential of NRMT1 knockdown MCF-7, LCC9, SKBR-3, and MDA-MB-231 cells (black bars) versus control cells (white bars) 48 hours after addition to chamber. RFU denotes relative fluorescent units. (B) Phase contrast and GFP fluorescence images of an MDA-MB-231 NRMT1 KD colony that is GFP positive and has a diameter greater than 50 μm. (C) Colony formation in a soft agarose gel of NRMT1 knockdown MCF-7, LCC9, SKBR-3, and MDA-MB-231 cells (black bars) versus control cells (white bars) at 4 weeks (all cell lines except MCF-7) or 5 weeks (MCF-7). Fold increase in the total number of colonies per well was calculated by setting control values equal to one for each cell line. Each data point represents the mean ± SEM of three independent experiments. Statistical analysis was by Student's t-test, * denotes p < 0.05.
Figure 6
Figure 6. Cell autonomous NRMT1 depletion increases tumor growth in vivo
(A) Tumor weights 1 week after implantation of MCF-7 NRMT1 KD or MCF-7 control cells into the mammary fat pads of Nu/J immunocompromised nude mice. NRMT1 KD cells were injected into the left inguinal gland, while control cells were injected into the right inguinal gland of the same mouse. Each symbol represents one mouse and horizontal lines denote median values. Statistical analysis was by Student's t-test, * denotes p < 0.05. (B) Representative images of tumors formed on each side of the same mouse 1 week after implantation. (C) Tumor weights 1 week after implantation of LLC1 cells into the mammary fat pads of wild type and Nrmt1−/− C57BL/6 mice. Each symbol represents one mouse and horizontal lines denote median values. No difference in tumor weight was observed. (D) Representative images of tumors formed in the wild type and Nrmt1−/− mice.
Figure 7
Figure 7. NRMT1 depletion also promotes sensitivity to tamoxifen that is independent of hormone receptor expression levels and NF-κB signaling
(A) Fold change in cell number of MCF-7 NRMT1 KD and control cells with treatment of 10 μM tamoxifen or vehicle control. Each data point represents the mean ± SEM of three independent experiments. Statistical analysis was by Student's t-test and by comparing the fold change between vehicle treated groups (NRMT1 KD or control) to the corresponding tamoxifen treated groups (NRMT1 KD or control), * denotes p < 0.05. (B) RT-PCR analysis of ERα, ERβ, and PR mRNA expression levels normalized to GAPDH in five MCF-7 lines transduced with the NRMT1 KD virus as compared to corresponding control lines. Fold change in expression was calculated by setting control equal to one. (C) Fold change in cell number of SKBR-3 NRMT1 KD and control cells with treatment of 10 μM tamoxifen or vehicle control. Each data point represents the mean ± SEM of three independent experiments. Statistical analysis was by Student's t-test and by comparing the fold change between vehicle treated groups (NRMT1 KD or control) to the corresponding tamoxifen treated groups (NRMT1 KD or control), * denotes p < 0.05. (D) Luciferase assay demonstrating that neither basal nor TNFα induced NF-κB signaling is increased after NRMT1 knockdown. Each bar represents the mean ± SEM of three independent experiments.

Similar articles

Cited by

References

    1. Tooley CE, Petkowski JJ, Muratore-Schroeder TL, Balsbaugh JL, Shabanowitz J, Sabat M, Minor W, Hunt DF, Macara IG. NRMT is an alpha-N-methyltransferase that methylates RCC1 and retinoblastoma protein. Nature. 2010;466:1125–1128. - PMC - PubMed
    1. Petkowski JJ, Bonsignore LA, Tooley JG, Wilkey DW, Merchant ML, Macara IG, Schaner Tooley CE. NRMT2 is an N-terminal monomethylase that primes for its homologue NRMT1. The Biochemical journal. 2013;456:453–462. - PMC - PubMed
    1. Petkowski JJ, Schaner Tooley CE, Anderson LC, Shumilin IA, Balsbaugh JL, Shabanowitz J, Hunt DF, Minor W, Macara IG. Substrate specificity of mammalian N-terminal alpha-amino methyltransferase NRMT. Biochemistry. 2012;51:5942–5950. - PMC - PubMed
    1. Brosius J, Chen R. The primary structure of protein L16 located at the peptidyltransferase center of Escherichia coli ribosomes. FEBS letters. 1976;68:105–109. - PubMed
    1. Wittmann-Liebold B, Pannenbecker R. Primary structure of protein L33 from the large subunit of the Escherichia coli ribosome. FEBS letters. 1976;68:115–118. - PubMed

Publication types

LinkOut - more resources