. 2015 Apr 24;11(4):e1005140.
doi: 10.1371/journal.pgen.1005140. eCollection 2015 Apr.

Spatio-temporal remodeling of functional membrane microdomains organizes the signaling networks of a bacterium

Affiliations

Spatio-temporal remodeling of functional membrane microdomains organizes the signaling networks of a bacterium

Johannes Schneider et al. PLoS Genet. .

Abstract

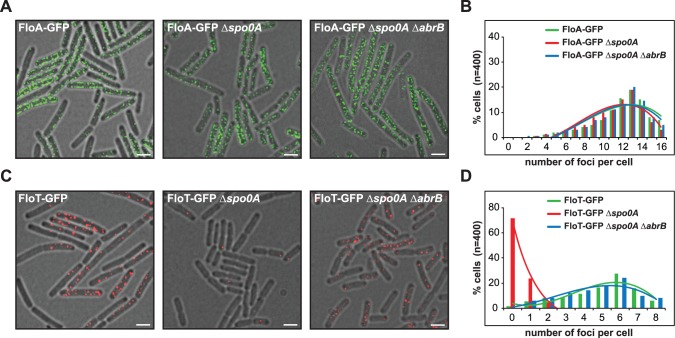
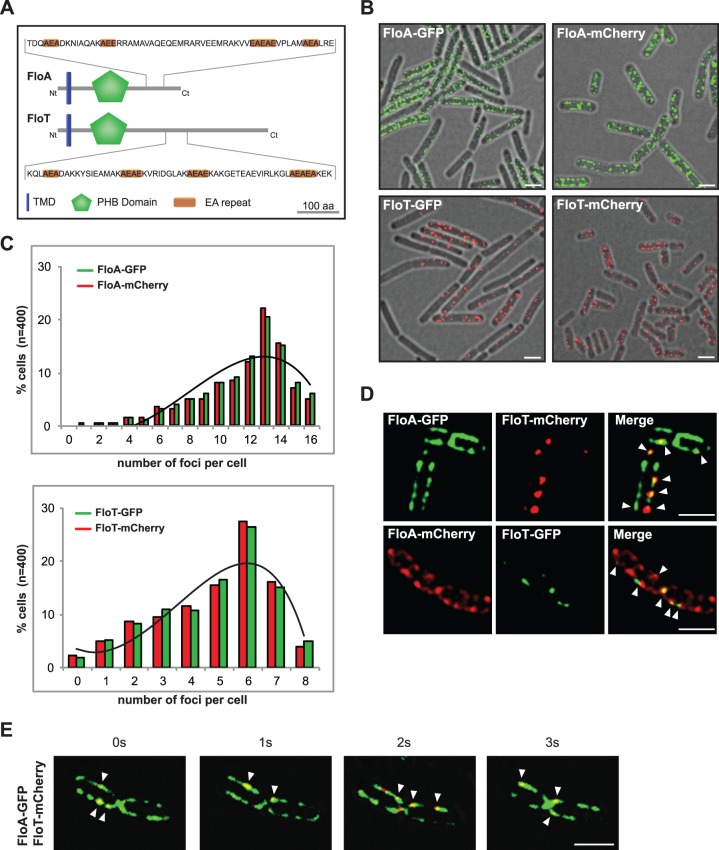
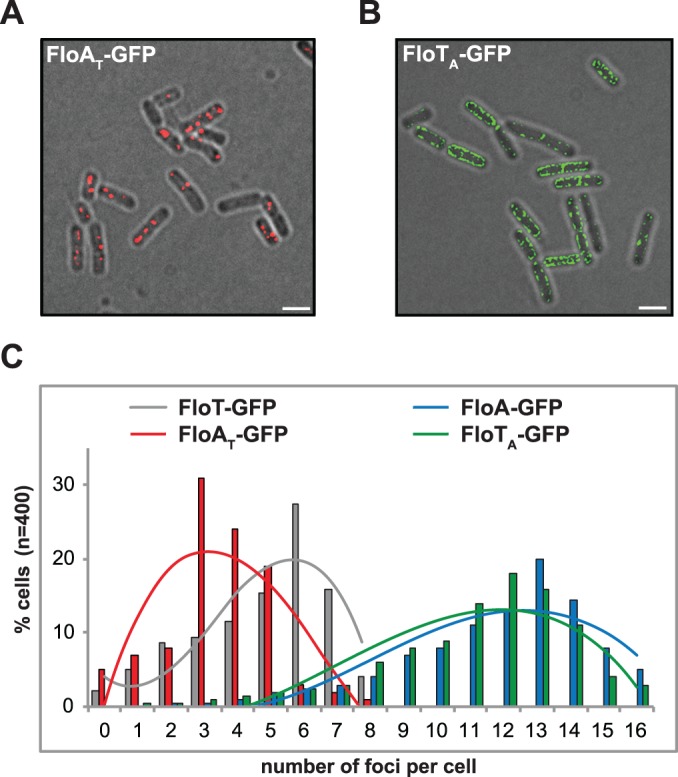
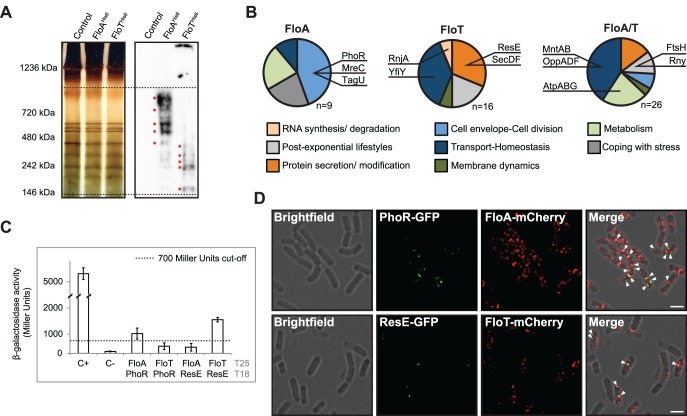
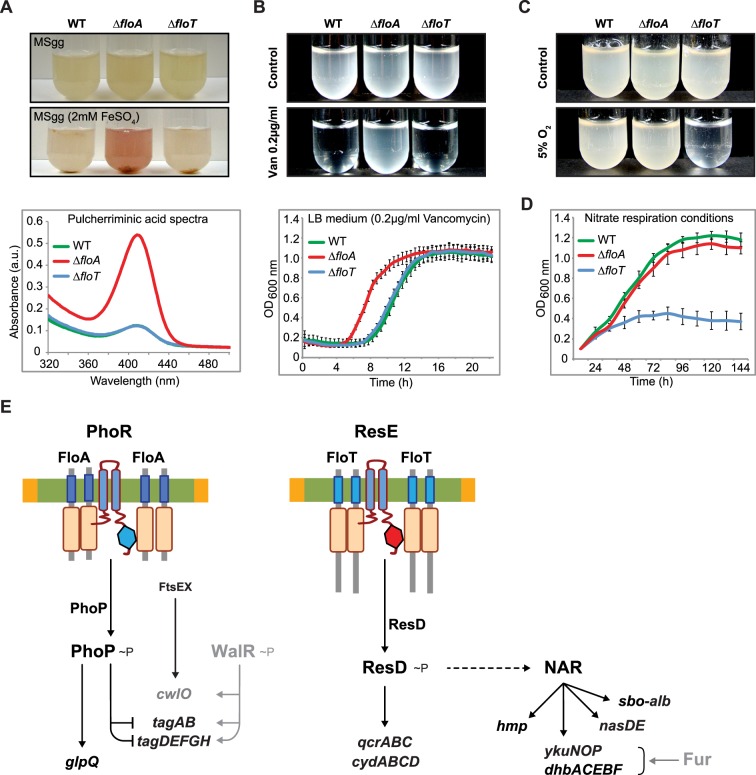
Lipid rafts are membrane microdomains specialized in the regulation of numerous cellular processes related to membrane organization, as diverse as signal transduction, protein sorting, membrane trafficking or pathogen invasion. It has been proposed that this functional diversity would require a heterogeneous population of raft domains with varying compositions. However, a mechanism for such diversification is not known. We recently discovered that bacterial membranes organize their signal transduction pathways in functional membrane microdomains (FMMs) that are structurally and functionally similar to the eukaryotic lipid rafts. In this report, we took advantage of the tractability of the prokaryotic model Bacillus subtilis to provide evidence for the coexistence of two distinct families of FMMs in bacterial membranes, displaying a distinctive distribution of proteins specialized in different biological processes. One family of microdomains harbors the scaffolding flotillin protein FloA that selectively tethers proteins specialized in regulating cell envelope turnover and primary metabolism. A second population of microdomains containing the two scaffolding flotillins, FloA and FloT, arises exclusively at later stages of cell growth and specializes in adaptation of cells to stationary phase. Importantly, the diversification of membrane microdomains does not occur arbitrarily. We discovered that bacterial cells control the spatio-temporal remodeling of microdomains by restricting the activation of FloT expression to stationary phase. This regulation ensures a sequential assembly of functionally specialized membrane microdomains to strategically organize signaling networks at the right time during the lifespan of a bacterium.


Conflict of interest statement

The authors have declared that no competing interests exist.

Figures

Fig 1
Fig 1. Spo0A regulates floT and not floA expression via inhibition of AbrB.
(A) Fluorescence microscopy pictures of different strains expressing FloA-GFP translational fusion (Fluorescence signal in green). Scale bars are 2 μm. (B) Quantification of fluorescence foci of different strains expressing FloA-GFP translational fusion. (C) Fluorescence microscopy pictures of different strains expressing FloT-GFP translational fusion (Fluorescence signal in red). Scale bars are 2 μm. (D) Quantification of fluorescence foci of different strains expressing FloT-GFP translational fusion. Cells were grown in MSgg medium at 37°C until stationary phase.
Fig 2
Fig 2. FloA and FloT are two distinct flotillins.
(A) Comparative diagram of FloA and FloT protein structures. The membrane-anchored region is represented in blue. The PHB domain is represented in green and the coil-coiled region is magnified and EA repeats are labeled in orange. Scale bar is 100 amino acids. (B) Fluorescence microscopy pictures of cells labeled with FloA-GFP, FloA-mCherry (upper panel), FloT-GFP and FloT-mCherry (lower panel) translational fusions. Fluorescence signal associated with FloA is represented in green and fluorescence signal associated with FloT is represented in red. Cultures were grown in MSgg medium at 37°C until stationary phase. Scale bars are 2 μm. (C) Quantification of the number of foci per cell (n = 400). (D) Fluorescence microscopy pictures of double-labeled strains. Cultures were grown in MSgg medium at 37°C until stationary phase. GFP signal is represented in green and mCherry signal is represented in red. Right panel shows the merge of the two fluorescence signals, which is visualized as yellow fluorescence signal. Scale bars are 2 μm. (E) Time lapse fluorescence microscopy analysis of cells expressing FloA-GFP (green signal) and FloT-mCherry (red signal) translational fusions. Signal was monitored within the same cells at 1 sec intervals. Cultures were grown in MSgg medium at 37°C until stationary phase. Scale bar is 2 μm.
Fig 3
Fig 3. FloA and FloT distribute differently within the bacterial microdomains.
(A and B) PALM images of cells labeled with FloA-mEoS2 (A) or FloT-mEoS2 (B) translational fusions grown to stationary phase and fixed with PFA (4%). With increasing localization density the color code changes from red to yellow. White arrows indicate the localization of a cluster. Scale bars are 500 nm. Detail of the right bottom of each panel shows a dashed-line decorated PALM picture as a general indicator of the cell outline. Scale bar is 500 nm. (C) Comparative graph of the diameter of the clusters that were generated by FloA-mEoS2 and FloT-mEoS2 fluorescence signal. The upper right corner shows a graph with the mean of the diameter of the FloA and FloT clusters. (D) Comparative graph of the number of clusters detected in FloA-mEoS2 and FloT-mEoS2 labeled cells. (E) Comparative graph of the number of FloA and FloT localizations per cluster. (F) Comparative graph of the percentage of localizations that organized in clusters.
Fig 4
Fig 4. Oligomerization properties of FloA and FloT.
(A) BTH analysis to study the interactions between FloA and FloT. Interaction activates lacZ and this degrades X-Gal (blue). The two cytoplasmic domains of a leucine-zipper represent a positive control (pKT25-zip + pUT18C-zip). The negative control is represented by the E. coli strains harboring empty plasmids (pKNT25 + pUT18). Plasmids containing FloA, FloT and EA variants are pKNT25 (T25) or pUT18 (T18). Dashed line indicates the threshold limit of 700 Miller Units that defines a positive (≥ 700 Miller Units) and a negative interaction signal (≤ 700 Miller Units) according to the instructions of the manufacturer. (B) BTH analysis between the EA1 to EA4 variants of FloA and FloT. Positive controls are wild type FloA and FloT. Dashed line indicates the threshold limit of 700 Miller Units that defines a positive and a negative interaction signal. (C) Fluorescence microscopy of cells expressing GFP-tagged versions of EA variants of FloA (Upper row). Fluorescence microscopy of cells expressing GFP-tagged versions of EA variants of FloT (Bottom row). Scale bar is 2 μm. (D) Quantification of the number of foci per cell (n = 400) of the distinct GFP-tagged versions of EA variants of FloA (left panel) and FloT (right panel). (E and F) PALM images of cells expressing the EA4 variant of FloA-mEoS2 (E) and EA2 variant of FloT-mEoS2 (F). Scale bars are 500 nm. Detail of the right bottom of each panel shows a dashed-line decorated PALM picture as a general indicator of the cell outline. Scale bar is 500 nm.
Fig 5
Fig 5. C-terminal region of FloA and FloT plays a role in their oligomerization properties.
(A) Fluorescence microscopy image of cells expressing a GFP-tagged version of FloAT. Fluorescence signal is represented in red (scale bar is 2 μm) (B) Fluorescence microscopy image of cells expressing a GFP-tagged version of FloTA. Fluorescence signal is represented in green (scale bar is 2 μm). (C) Quantification of the number of foci per cell (n = 400) in different genetic backgrounds.
Fig 6
Fig 6. Physiological processes associated with FloA or FloT.
(A) Silver-stained BN-PAGE that resolves the protein complexes from the membrane fraction of different strains (left panel). Western blot assay, using antibodies against His6, to detect flotillin-interacting protein complexes on the BN-PAGE (right panel). Dashed lines define the higher (1000 KDa) and lower (100 KDa) resolution limit of protein complexes in a 4%-20% BN-PAGE. Red asterisks denote the bands that were analyzed by MS. (B) Functional classification of the proteins identified in association FloA (left), FloT (centre) or both FloA and FloT (right). Dashed lines define the higher (1,000 KDa) and lower (100 KDa) resolution limit of protein complexes in a 4%-20% BN-PAGE. Red asterisks denote the bands that were analyzed by MS. (C) BTH assay to study the interactions between FloA or FloT and the PhoR and ResE flotillin-associated kinases. Dashed line indicates the threshold limit of 700 Miller Units that defines a positive (≥ 700 Miller Units) and a negative interaction signal (≤ 700 Miller Units) according to the instructions of the manufacturer. (D) Fluorescence microscopy images of colocalization of fluorescence signals. Upper row shows a double-labeled strain expressing PhoR-GFP and FloA-mCherry translational fusions. Fluorescence signals are represented in green and red, respectively. Colocalization of both green and red fluorescence signals merges in a yellow signal (indicated with a white arrow). Scale bar is 2 μm. Bottom row shows a double-labeled strain expressing ResE-GFP and FloT-mCherry translational fusions. Fluorescence signals are represented in green and red, respectively. Colocalization of both green and red fluorescence signal merges in a yellow signal (indicated with a white arrow). Scale bar is 2 μm.
Fig 7
Fig 7. Tethering of signaling partners mediated by flotillins.
(A) BTH assay to quantify the interaction of PhoR (i) and ResE (ii) under different concentrations of flotillins (upper panels). Dashed line indicates the threshold limit of 700 Miller Units that defines a positive (≥ 700 Miller Units) and a negative interaction signal (≤ 700 Miller Units) according to the instructions of the manufacturer. Lower- (pSEVA-621), medium- (pSEVA-631) and high-copy (pSEVA-641) plasmids expressing His6-tagged FloA and FloT rendered lower (⬆), medium (⬆⬆) and higher (⬆⬆⬆) concentration of flotillin in the BTH assay, respectively, according to immunoblot analysis (lower panels). SDS-PAGE are shown as loading control. (B) Inhibition of the activity of a protein complex by scaffold titration. Protein assembly by scaffold proteins has potential drawbacks. At high concentrations, scaffolds may titrate enzyme and substrate away from each other.
Fig 8
Fig 8. Flotillins influence kinase-dependent activation of PhoP and ResD regulators.
(A) Left panel shows qRT-PCR of the PhoP-regulated genes glpQ and tuaB in different genetic backgrounds. Statistically significant differences are marked with an asterisk (Student’s t-test p ≤ 0.05). Right panel shows immunoblot assay to detect PhoP-3xFlag in different genetic backgrounds. (B) Left panel shows qRT-PCR of the ResD-regulated genes sboX and yclJ in different genetic backgrounds (Student’s t-test p ≤ 0.05). Right panel shows immunoblot assay to detect ResD-3xFlag in different genetic backgrounds (right panel). (C) Genome-wide gene expression analysis of flotillin-regulated genes. Voronoi treemaps represent upregulated genes (green sectors) and downregulated genes (red sectors) in the ∆floA mutant (i) and ∆floT mutant (ii) in comparison to the wild-type strain. Genes whose expression was altered are represented and functionally classified in regulons. Each section is labeled with the name of the genes that represents. (D) qRT-PCR analysis of selected genes from the genome-wide gene expression analysis to validate the microarray data.
Fig 9
Fig 9. FloA and FloT flotillins influence different physiological processes.
(A) Upper panel shows different strains grown in liquid MSgg medium and MSgg supplemented with 2mM FeSO4 to stationary phase. Bottom panel shows the spectrum of pulcherriminic acid that was measured in cell extracts. (B) Upper panel shows the pictures of cultures of different strains that were grown with or without vancomycin (0,2 μg/ml) (MSgg liquid medium). Bottom panel shows their growth curve in the presence of vancomycin (0,2 μg/ml) (LB liquid medium). (C) Pictures of cultures of different strains that were grown in MSgg liquid medium in regular atmosphere or under oxygen-limiting conditions. Cells were incubated at 30°C for 72h. (D) Growth of the different strains in the absence of oxygen. MSgg medium was modified by replacing glutamate and glycerol with glucose 1% and NaNO3 0,2% (E) Schematic representation of the specific signaling pathways that are associated with FloA or FloT. Genes detected in the microarray analysis whose expression was influenced by flotillins are represented in black.

Similar articles

Cited by

References

    1. Simons K, Ikonen E (1997) Functional rafts in cell membranes. Nature 387: 569–572. - PubMed
    1. Lingwood D, Simons K (2010) Lipid rafts as a membrane-organizing principle. Science 327: 46–50. 10.1126/science.1174621 - DOI - PubMed
    1. Neumann AK, Itano MS, Jacobson K (2010) Understanding lipid rafts and other related membrane domains. F1000 Biol Rep 2: 31 10.3410/B2-31 - DOI - PMC - PubMed
    1. Lingwood D, Kaiser HJ, Levental I, Simons K (2009) Lipid rafts as functional heterogeneity in cell membranes. Biochem Soc Trans 37: 955–960. 10.1042/BST0370955 - DOI - PubMed
    1. Mishra S, Joshi PG (2007) Lipid raft heterogeneity: an enigma. J Neurochem 103 Suppl 1: 135–142. - PubMed

Publication types

MeSH terms

Associated data