. 2015 Apr 18;16(1):317.
doi: 10.1186/s12864-015-1523-3.

Characterization of chromosomal and megaplasmid partitioning loci in Thermus thermophilus HB27

Affiliations

Characterization of chromosomal and megaplasmid partitioning loci in Thermus thermophilus HB27

Haijuan Li et al. BMC Genomics. .

Abstract

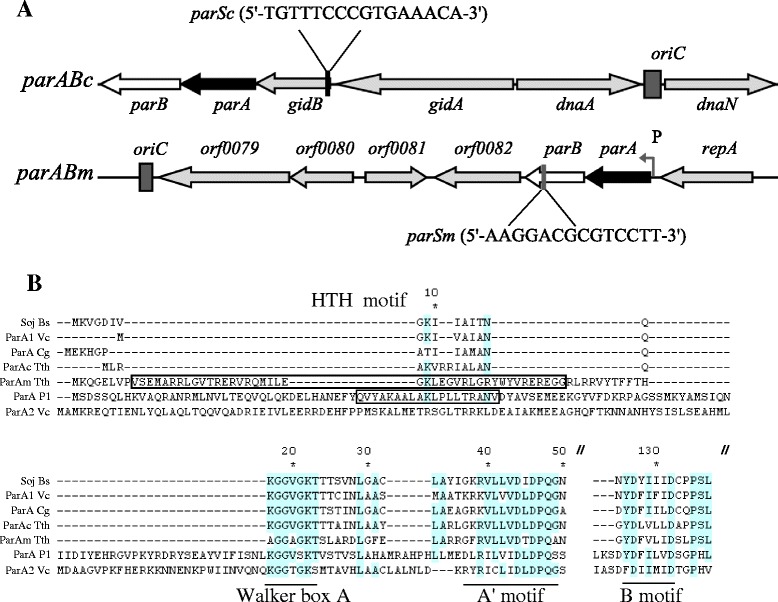
Background: In low-copy-number plasmids, the partitioning loci (par) act to ensure proper plasmid segregation and copy number maintenance in the daughter cells. In many bacterial species, par gene homologues are encoded on the chromosome, but their function is much less understood. In the two-replicon, polyploid genome of the hyperthermophilic bacterium Thermus thermophilus, both the chromosome and the megaplasmid encode par gene homologues (parABc and parABm, respectively). The mode of partitioning of the two replicons and the role of the two Par systems in the replication, segregation and maintenance of the genome copies are completely unknown in this organism.

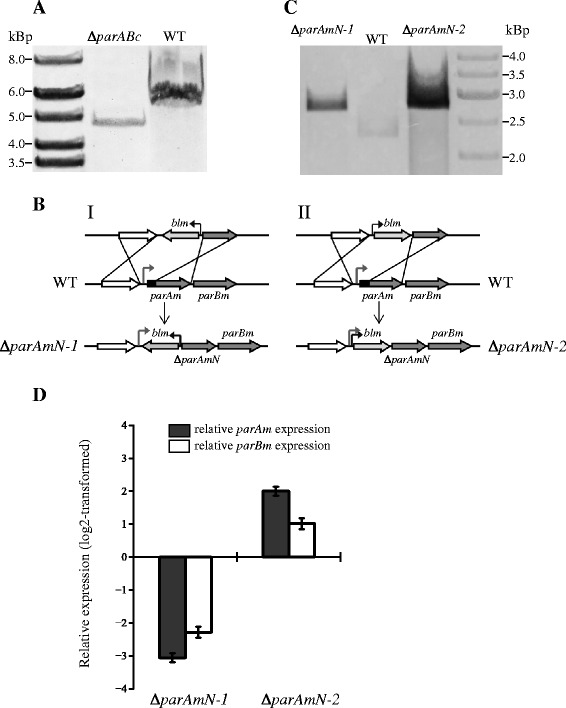
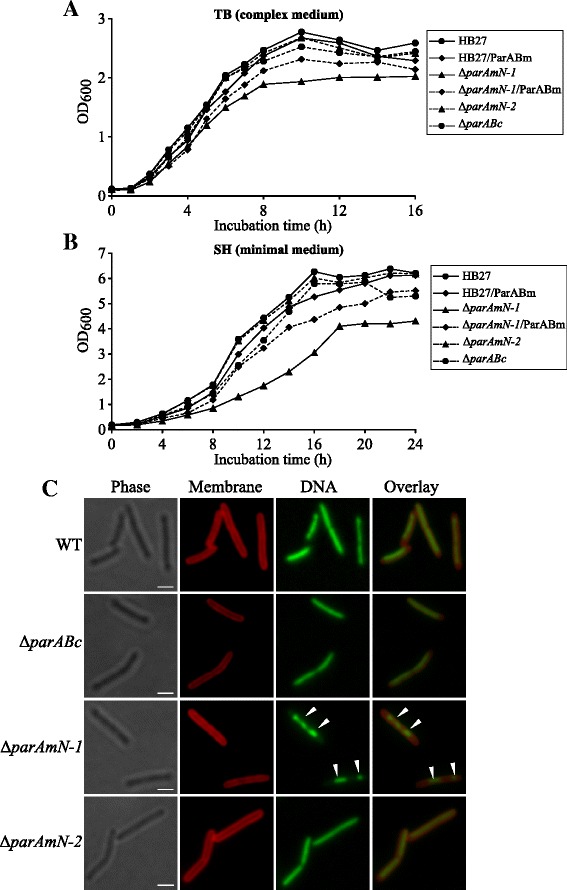
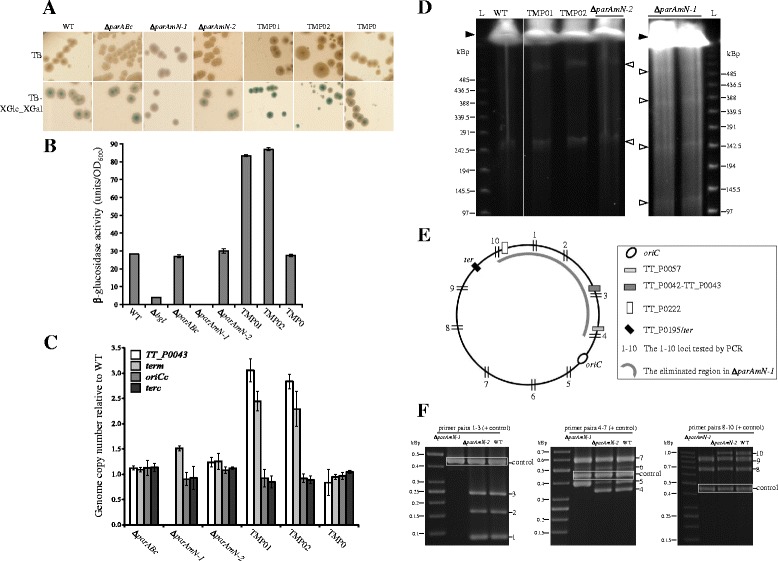
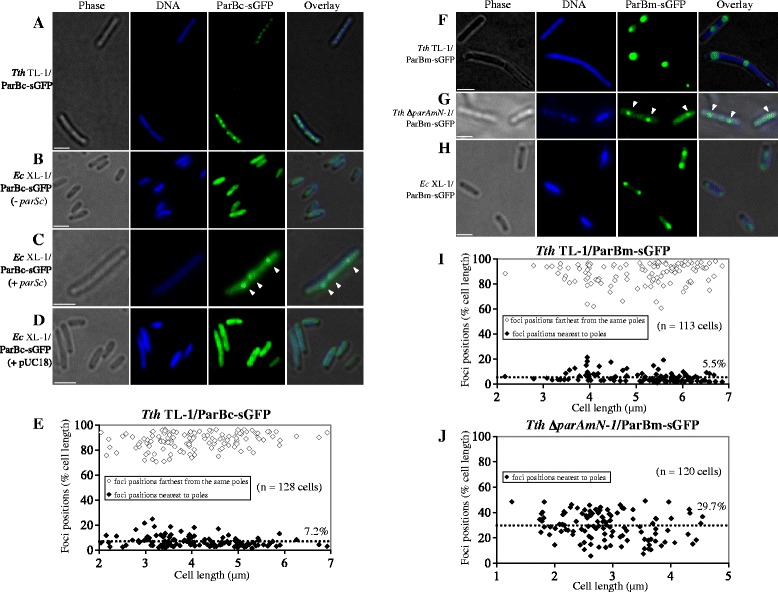
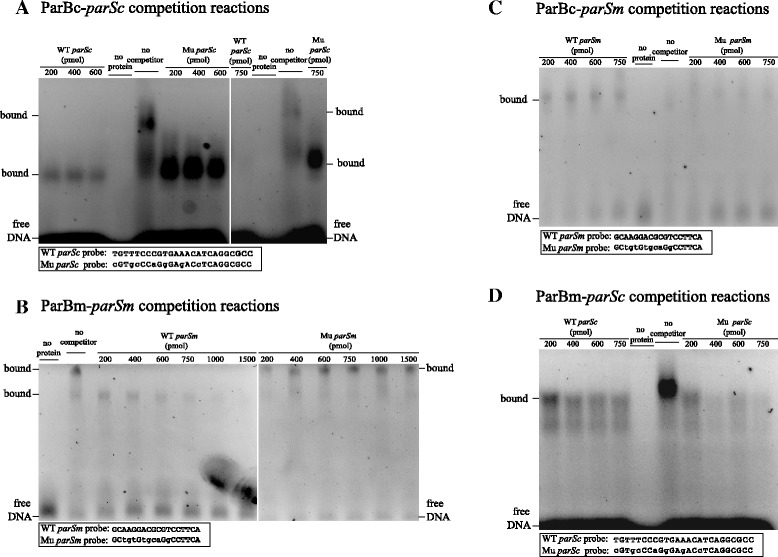
Results: We generated a series of chromosomal and megaplasmid par mutants and sGFP reporter strains and analyzed them with respect to DNA segregation defects, genome copy number and replication origin localization. We show that the two ParB proteins specifically bind their cognate centromere-like sequences parS, and that both ParB-parS complexes localize at the cell poles. Deletion of the chromosomal parAB genes did not apparently affect the cell growth, the frequency of cells with aberrant nucleoids, or the chromosome and megaplasmid replication. In contrast, deletion of the megaplasmid parAB operon or of the parB gene was not possible, indicating essentiality of the megaplasmid-encoded Par system. A mutant expressing lower amounts of ParABm showed growth defects, a high frequency of cells with irregular nucleoids and a loss of a large portion of the megaplasmid. The truncated megaplasmid could not be partitioned appropriately, as interlinked megaplasmid molecules (catenenes) could be detected, and the ParBm-parSm complexes in this mutant lost their polar localization.

Conclusions: We show that in T. thermophilus the chromosomal par locus is not required for either the chromosomal or megaplasmid bulk DNA replication and segregation. In contrast, the megaplasmid Par system of T. thermophilus is needed for the proper replication and segregation of the megaplasmid, and is essential for its maintenance. The two Par sets in T. thermophilus appear to function in a replicon-specific manner. To our knowledge, this is the first analysis of Par systems in a polyploid bacterium.


Figures

Figure 1
Figure 1
Organization of the chromosomal and megaplasmid par loci, and features of the corresponding ParA proteins. (A) Schematic organization of the parABc and parABm regions. Genes encoding proteins with unknown functions are labeled with their ORF numbers. The predicted replication origins in the chromosome and megaplasmid are indicated with dark-gray bars. The positions and sequences of the chromosomal and megaplasmid parS sites are shown. (B) Part of a multiple sequence alignment of T. thermophilus ParAc, ParAm and ParA proteins from representative bacterial species. Abbreviations: Bs, B. subtilis; Vc, V. cholerae; Cg, Corynebacterium glutamicum; Tth, T. thermophilus; P1, E. coli P1 phage. Completely conserved amino acids are shown with blue color. Black frames indicate the predicted helix-turn-helix (HTH) motifs identified in P1 ParA, and Tth ParAm.
Figure 2
Figure 2
Generation and genotype confirmation of the chromosomal and megaplasmid par mutants. (A) Genotype confirmation of the parABc mutant by Southern blot. The genomic DNA was digested with BamHI and hybridization was performed with a 992-bp biotin-labeled DNA fragment. The in silico predicted sizes are 5.13 kbp for the wild type and 4.68 kbp for ΔparABc. (B) Schematic diagrams showing exchange of the N-terminus-encoding region of ParAm (amino acid positions 1–40) with blm. Gray arrowhead denotes the promoter region of parABm; black arrowhead, promoter of blm. (C) Genotype confirmation of the ΔparAmN-1 and ΔparAmN-2 mutants by Southern blot. The genomic DNA was digested with PstI, the predicted sizes are 2.26 kbp for the wild type and 2.73 kbp for ΔparAmN-1 and ΔparAmN-2. (D) Transcription levels of the truncated parAm and parBm genes in ΔparAmN-1 and ΔparAmN-2 relative to those of the wild type determined by RT-qPCR. Gray bar represents the relative expression level of the truncated parAm, white bar represents that of parBm. The average values and SDs shown are from three experiments.
Figure 3
Figure 3
Growth phenotypes, cell shape and nucleoid morphology observations of the par mutant strains. (A and B) The cultures of the mutants were grown in antibiotic-free complex medium (TB) (A) and minimal medium (SH) (B). For complementation experiments, the wild type and the ΔparAmN-1 strains carrying the plasmid pMK-parABm were grown in the presence of kanamycin (20 μg/ml). One representative of three independent experiments is shown. (C) Microscopic analysis of the cell shape, cell division and DNA morphology of the wild type and par mutants grown in complex medium (TB). Shown are representative phase-contrast (Phase) and fluorescence images (Membrane, DNA) and a merge between the membrane and DNA images (Overlay). The cells were stained with carboxyfluorescein (for membranes) and with DAPI (for DNA) before imaging. White arrows show aberrant nucleoids. Scale bars, 2 μm.
Figure 4
Figure 4
Characterization of genome features of the chromosomal and megaplasmid par mutants and ParAm/ParBm overexpression strains. (A) Phenotypes of the strains on complex media (TB) and on TB supplemented with the chromogenic substrates XGlc and XGal. (B) Intracellular β-glucosidase activity measurements of the strains. The Δbgl strain was used as a negative control. The means and the SDs of three independent experiments are shown. (C) Relative chromosome and megaplasmid copy numbers of the individual mutants determined by qPCR. The means and SDs are from three experiments. (D) Pulsed field gel electrophoresis visualizing chromosome and megaplasmid. “L”, lambda ladder; the positions of the chromosome and megaplasmid are indicated with black and white arrows. (E) Schematic drawing of the megaplasmid pTT27. The positions of the primer pairs used for detecting the megaplasmid sequence loss in ΔparAmN-1 are indicated with short black lines and numbers from 1 to 10. The loci on the megaplasmid that have been investigated are indicated with different bars, and their names are on the right panel of the figure. (F) PCR amplification results for the 10 loci indicated in (E) from wild type, ΔparAmN-1 and ΔparAmN-2. The primer pairs 1 to 3, 4 to 7 and 8 to 10 were mixed into three pools, and in each reaction amplification of a chromosomal gene locus (pyrF) was used as a control. The predicted sizes of the PCR products 1 to 10 are 87, 164, 247, 346, 400, 498, 610, 699, 898 and 1014 bp. The size of the control amplicon is 460 bp (white frame). The bands of the 10 PCR products are indicated with numbers 1–10 on the right side of the corresponding figure panel. The gray arc in (E) indicates the megaplasmid region estimated to be lost in ΔparAmN-1.
Figure 5
Figure 5
Subcellular localizations of ParBc-sGFP and ParBm-sGFP in T. thermophilus and E. coli cells. Representative cells are shown with a gallery view of phase-contrast (Phase), DNA, ParBc-sGFP or ParBm-sGFP signal, and merged images (Overlay). Scale bars, 2 μm. (A and F) Subcellular localization of ParBc-sGFP and ParBm-sGFP in the T. thermophilus TL-1 strain grown in complex medium. (B, C, D and H) Expression of T. thermophilus ParBc-sGFP or ParBm-sGFP in E. coli XL-1. In the absence of the parSc site, ParBc-sGFP was found as patches (B); when parSc sites were provided from a plasmid, ParBc-sGFP localized as discrete foci (C), and foci were not observed in the presence of the empty vector (D); ParBm-sGFP formed discrete foci in E. coli (H). (G) Representative image of mislocalized foci formed by ParBm-sGFP expressed in the ΔparAmN-1 strain. (E and I) Relative positions of the two most pole-proximal foci of ParBc-sGFP (E) and ParBm-sGFP (I) expressed in T. thermophilus TL-1. Black diamonds represent the nearest-to-pole foci positions in individual cells, white diamonds represent the foci positions that are farthest from these poles. The mean position of the nearest-to-pole foci is shown with a dotted line. (J) The relative foci positions of 120 ΔparAmN-1/ParBm-sGFP cells containing one focus are shown.
Figure 6
Figure 6
Specificity of ParB proteins binding to parS sites in vitro, tested by competition with unlabeled DNA probes in gel mobility shift assays. (A and B) Specificity of the ParB proteins binding to cognate parS sites (ParBc-parSc and ParBm-parSm) tested by the addition of unlabeled competitor DNA probes. (C and D) Specificity of the ParB proteins binding to non-cognate parS sites (ParBc-parSm and ParBm-parSc) tested by the addition of unlabeled competitor DNA probes. The 25-bp DNA probes containing the wild-type and mutant parSc sequences are indicated as WT parSc and Mu parSc, and the 18-bp DNA probes containing the wild-type and mutant parSm sequences are indicated as WT parSm and Mu parSm. All reactions contained 15 pmol FAM-labeled wild-type parSc or parSm DNA probes, and purified ParBc or ParBm proteins were added with a concentration of either 0 (no protein) or 200 pmol.

Similar articles

Cited by

References

    1. Glaser P, Sharpe ME, Raether B, Perego M, Ohlsen K, Errington J. Dynamic, mitotic-like behavior of a bacterial protein required for accurate chromosome partitioning. Genes Dev. 1997;11:1160–8. doi: 10.1101/gad.11.9.1160. - DOI - PubMed
    1. Gordon GS, Sitnikov D, Webb CD, Teleman A, Straight A, Losick R, Murray AW, Wright A. Chromosome and low copy plasmid segregation in E. coli: visual evidence for distinct mechanisms. Cell. 1997;90:1113–21. doi: 10.1016/S0092-8674(00)80377-3. - DOI - PubMed
    1. Webb CD, Graumann PL, Kahana JA, Teleman AA, Silver PA, Losick R. Use of time-lapse microscopy to visualize rapid movement of the replication origin region of the chromosome during the cell cycle in Bacillus subtilis. Mol Microbiol. 1998;28:883–92. doi: 10.1046/j.1365-2958.1998.00808.x. - DOI - PubMed
    1. Viollier PH, Thanbichler M, McGrath PT, West L, Meewan M, McAdams HH, Shapiro L. Rapid and sequential movement of individual chromosomal loci to specific subcellular locations during bacterial DNA replication. Proc Natl Acad Sci. 2004;101:9257–62. doi: 10.1073/pnas.0402606101. - DOI - PMC - PubMed
    1. Sharpe ME, Errington J. Upheaval in the bacterial nucleoid: an active chromosome segregation mechanism. Trends Genet. 1999;15:70–4. doi: 10.1016/S0168-9525(98)01660-6. - DOI - PubMed

Publication types

MeSH terms

Substances

LinkOut - more resources