. 2015 Apr 24;10(4):e0123450.
doi: 10.1371/journal.pone.0123450. eCollection 2015.

Cell, isoform, and environment factors shape gradients and modulate chemotaxis

Affiliations

Cell, isoform, and environment factors shape gradients and modulate chemotaxis

S Laura Chang et al. PLoS One. .

Erratum in

Abstract

Chemokine gradient formation requires multiple processes that include ligand secretion and diffusion, receptor binding and internalization, and immobilization of ligand to surfaces. To understand how these events dynamically shape gradients and influence ensuing cell chemotaxis, we built a multi-scale hybrid agent-based model linking gradient formation, cell responses, and receptor-level information. The CXCL12/CXCR4/CXCR7 signaling axis is highly implicated in metastasis of many cancers. We model CXCL12 gradient formation as it is impacted by CXCR4 and CXCR7, with particular focus on the three most highly expressed isoforms of CXCL12. We trained and validated our model using data from an in vitro microfluidic source-sink device. Our simulations demonstrate how isoform differences on the molecular level affect gradient formation and cell responses. We determine that ligand properties specific to CXCL12 isoforms (binding to the migration surface and to CXCR4) significantly impact migration and explain differences in in vitro chemotaxis data. We extend our model to analyze CXCL12 gradient formation in a tumor environment and find that short distance, steep gradients characteristic of the CXCL12-γ isoform are effective at driving chemotaxis. We highlight the importance of CXCL12-γ in cancer cell migration: its high effective affinity for both extracellular surface sites and CXCR4 strongly promote CXCR4+ cell migration. CXCL12-γ is also more difficult to inhibit, and we predict that co-inhibition of CXCR4 and CXCR7 is necessary to effectively hinder CXCL12-γ-induced migration. These findings support the growing importance of understanding differences in protein isoforms, and in particular their implications for cancer treatment.


Conflict of interest statement

Competing Interests: The authors have declared that no competing interests exist.

Figures

Fig 1
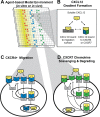
Fig 1. Multi-scale hybrid agent-based model.
Model simulates CXCR4+ cell movement in response to CXCL12 gradients. (A) Three types of agents (cells) move in a discrete manner on the surface of a 2D or 3D lattice: CXCL12+, CXCR4+ cells and CXCR7+ cells. CXCL12 gradients are formed and shaped by diffusion and degradation binding to the migration surface (B), and receptor-mediated uptake by CXCR4 (C) and CXCR7 (D). We assume that both soluble CXCL12 and CXCL12 bound to the migration surface are able to bind CXCR4 or CXCR7. Molecule-scale dynamics shown in C and D are described by experiments and model in [32].
Fig 2
Fig 2. Multi-scale model predicts cell movement, molecular-scale information, and gradient formation within the microfluidic source-sink device.
(A) Heat maps depict CXCL12 concentration in the agent layer and are overlaid with agent positions. Initial patterning of CXCL12+, CXCR4+ and CXCR7+ cells is shown at 0 hr. CXCL12+ and CXCR7+ cells, which move randomly, are not shown at later time points for clarity. Concentration values are averaged from 30 simulations. Cell positions shown are from one representative simulation. (B) Contribution of surface-bound (blue) and soluble (red) CXCL12 on total CXCL12 (black) concentration. At 0 hr, all concentrations are 0 nM. Concentration values are averaged from 30 simulations. (C) Number of CXCR4 surface receptors (sum of free, ligand-bound and β-arrestin-bound CXCR4) per individual CXCR4+ cell is plotted at the cell’s position across the width of the device. Data are shown for one representative simulation, the same simulation used for cell positions in (A). (D) Heat maps depicting CXCL12 concentration when CXCL12-CXCR4 binding and internalization ODEs are turned off at 8 hrs. All simulations depicted here were run with parameters from Table A in S1 File. Normalized position of 0 to 1 corresponds to the device width of 0.5mm to 1.5mm.
Fig 3
Fig 3. CXCL12 isoform-specific effects on CXCR4+ cell migration.
(A-C) Experimental data show isoform-specific differences in average CXCR4+ cell migration as a function of the percentage of source cells secreting CXCL12 in our source-sink device (data from [1]). We fit our model to these data by varying four isoform-specific parameters (chemotaxis sensitivity factor parameter m, CXCL12 isoform affinity to the migration surface, CXCL12 isoform effective affinity for CXCR4, and CXCL12 isoform secretion rate). (D) Using the model, we predicted the average migration of CXCR4+ cells within the same source-sink device for when 100% of source cells are secreting and when the distance between the cells stripes is increased from 200 μm to 400 μm. Compared to panels A-C, migration for all isoforms is reduced. We measured the average migration using the source-sink device and find that that it matches model predictions. (E,F) The model predicts CXCR4+ average migration for different secretion rate constants of CXCL12+ cells as (E) ligand affinity to migration surface (Mid affinity K D,L,S = 5nM; High affinity K D,L,S = 1nM) and (F) ligand affinity to CXCR4 (Mid affinity K D,R4,L12 = 5nM; High affinity K D,R4,L12 = 1nM) are increased. The low affinity case for both E and F uses the CXCL12-α parameters listed in Table A in S1 File. Model data are expressed as mean of 30 replications +/- standard deviation. For experiments only: * P < 0.05; ** P < 0.005; *** P < 0.0005.
Fig 4
Fig 4. Blocking migration to high affinity ligands is more difficult than to low affinity ligands.
Average migration of CXCR4+ cells for different secretion rate constants of CXCL12-secreting cells as (A) CXCR4, (B) CXCR7 or (C) both CXCR4 and CXCR7 are blocked. Blocking 50% of CXCR4 receptors (D) or 90% of CXCR7 receptors (E) is not as effective at reducing CXCR4+ migration when the ligand has a high affinity for CXCR4 (K D,R4,L12 = 1nM) and when the ligand has a high affinity for the migration surface (K D,L,S = 1nM). Data are expressed as mean of 30 replications +/- standard deviation.
Fig 5
Fig 5. Gradients form even in disorganized cell structures representative of tumors.
(A) Positions of CXCL12+ (red), CXCR4+ (white) and CXCR7+ (green) cells in simulation, based on histological data from literature [10, 14, 15]. We predicted chemokine gradients using same parameters as used in the device (Table A in S1 File) for CXCL12-α (B), CXCL12-β (C) and CXCL12-γ (D). Gradients when CXCR7+ cells are replaced with non-receptor bearing cells for CXCL12-α (E), CXCL12-β (F) and CXCL12-γ (G). Gradients using a reduced number of CXCR4 and CXCR7 receptors (5x10³ per cell) for CXCL12-α (H), CXCL12-β (I) and CXCL12-γ (J). Gradients shown are at 24 hr; cells were immobile throughout the entire time period. Data are expressed as mean concentration using 30 replications.
Fig 6
Fig 6. CXCL12-γ enhances migration in tumor-like simulations.
Model predictions of directed CXCR4+ migration in a tumor-like environment. Number of CXCR4+ cells within 30 μm of a CXCL12 cluster at 24 hr represented as fold change (in comparison to number at 0 hr). Each simulation had a randomly generated pattern. CXCL12 and CXCR7+ cells remained static throughout the entire time period, whereas CXCR4+ cells were allowed to move. All parameters are the same as those used for gradient predictions in Fig 5H–5J, with reduced numbers of CXCR4 and CXCR7 (5x10³ per cell), except that the chemotaxis sensitivity factors (for all isoforms: m = -6.85x10⁻³, b = 25) were altered to increase sensitivity to migration. Control simulation lacks CXCL12 on the grid. Data are expressed as mean of 30 replications +/- standard error of the mean. Arrows represent statistics using Student’s T-test, brackets represent statistics using ANOVA. * P < 0.05, ** P < 0.0005, *** P < 0.0005.

References

    1. Cavnar SP, Ray P, Moudgil P, Chang SL, Luker KE, Linderman JJ, et al. Microfluidic source-sink model reveals effects of biophysically distinct CXCL12 isoforms in breast cancer chemotaxis. Integrative biology: quantitative biosciences from nano to macro. 2014;6(5):564–76. Epub 2014/03/29. 10.1039/c4ib00015c PubMed . - DOI - PMC - PubMed
    1. Torisawa YS, Mosadegh B, Bersano-Begey T, Steele JM, Luker KE, Luker GD, et al. Microfluidic platform for chemotaxis in gradients formed by CXCL12 source-sink cells. Integrative biology: quantitative biosciences from nano to macro. 2010;2(11–12):680–6. Epub 2010/09/28. 10.1039/c0ib00041h PubMed . - DOI - PMC - PubMed
    1. Balabanian K, Lagane B, Pablos JL, Laurent L, Planchenault T, Verola O, et al. WHIM syndromes with different genetic anomalies are accounted for by impaired CXCR4 desensitization to CXCL12. Blood. 2005;105(6):2449–57. Epub 2004/11/13. 10.1182/blood-2004-06-2289 PubMed . - DOI - PubMed
    1. Buckley CD, Amft N, Bradfield PF, Pilling D, Ross E, Arenzana-Seisdedos F, et al. Persistent induction of the chemokine receptor CXCR4 by TGF-beta 1 on synovial T cells contributes to their accumulation within the rheumatoid synovium. J Immunol. 2000;165(6):3423–9. Epub 2000/09/07. PubMed . - PubMed
    1. Lukacs NW, Berlin A, Schols D, Skerlj RT, Bridger GJ. AMD3100, a CxCR4 antagonist, attenuates allergic lung inflammation and airway hyperreactivity. The American journal of pathology. 2002;160(4):1353–60. Epub 2002/04/12. 10.1016/S0002-9440(10)62562-X PubMed - DOI - PMC - PubMed

Publication types