

Coverage of the 2011 Q fever vaccination campaign in the Netherlands, using retrospective population-based prevalence estimation of cardiovascular risk-conditions for chronic Q fever
- PMID: 25909712
- PMCID: PMC4409345
- DOI: 10.1371/journal.pone.0123570
Coverage of the 2011 Q fever vaccination campaign in the Netherlands, using retrospective population-based prevalence estimation of cardiovascular risk-conditions for chronic Q fever
Abstract
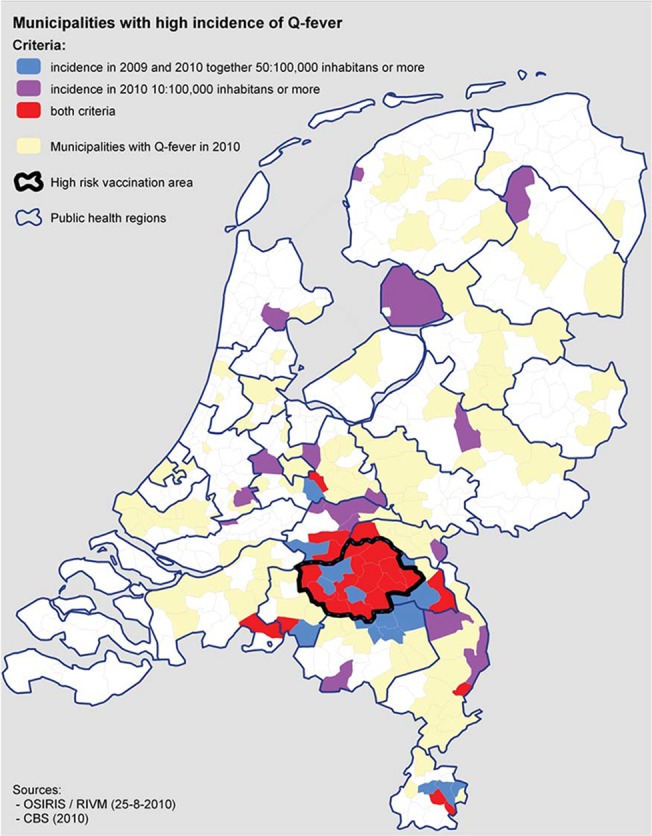
Background: In 2011, a unique Q fever vaccination campaign targeted people at risk for chronic Q fever in the southeast of the Netherlands. General practitioners referred patients with defined cardiovascular risk-conditions (age >15 years). Prevalence rates of those risk-conditions were lacking, standing in the way of adequate planning and coverage estimation. We aimed to obtain prevalence rates retrospectively in order to estimate coverage of the Q fever vaccination campaign.
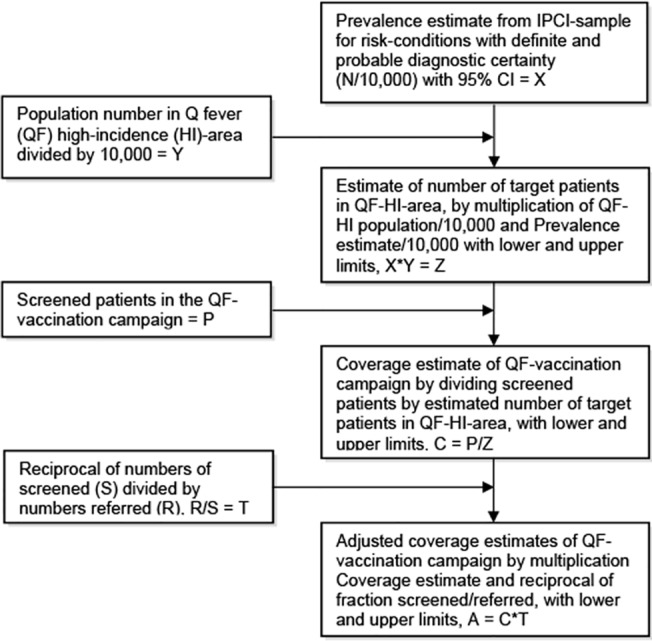
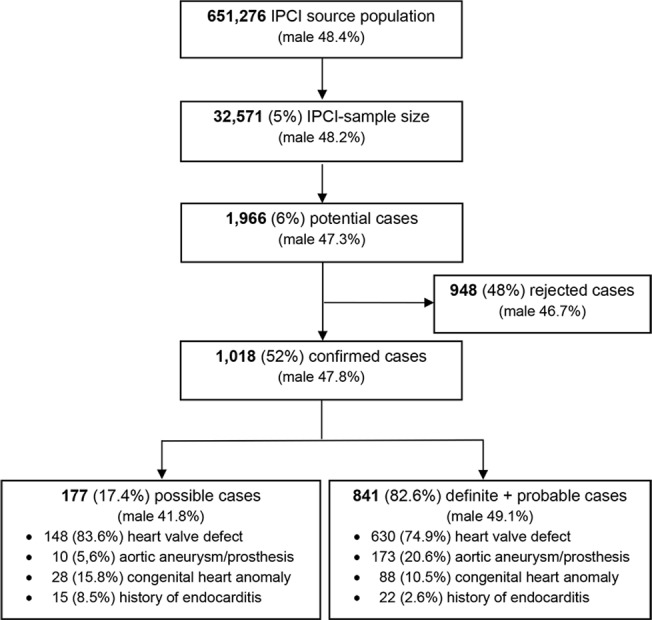
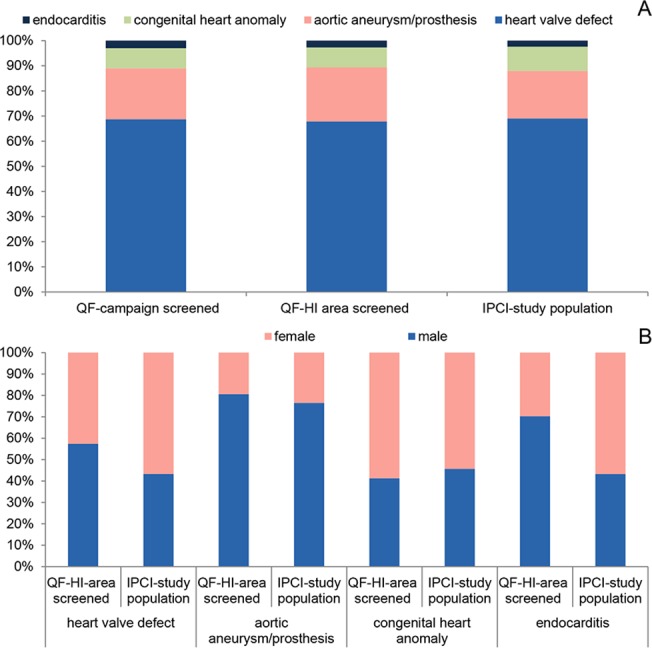
Methods: With broad search terms for these predefined risk-conditions, we extracted patient-records from a large longitudinal general-practice research-database in the Netherlands (IPCI-database). After validation of these records, obtained prevalence rates (stratified for age and sex) extrapolated to the Q fever high-incidence area population, gave an approximation of the size of the targeted patient-group. Coverage calculation addressed people actually screened by a pre-vaccination Q fever skin test and serology (coverage) and patients referred by their general practitioners (adjusted-coverage) in the 2011 campaign.
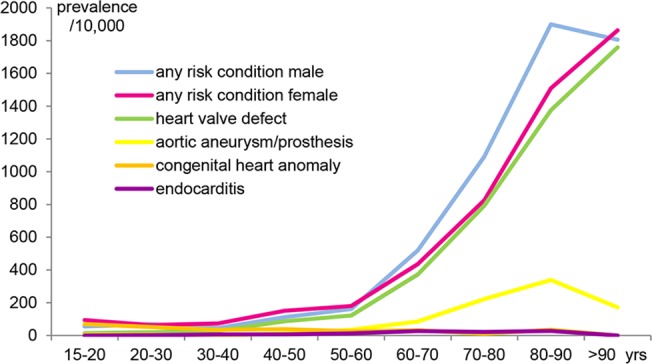
Results: Our prevalence estimate of any risk-condition was 3.1% (lower-upper limits 2.9-3.3%). For heart valve defects, aorta aneurysm/prosthesis, congenital anomalies and endocarditis, prevalence was 2.4%, 0.6%, 0.4% and 0.1%, respectively. Estimated number of eligible people in the Q fever high-incidence area was 11,724 (10,965-12,532). With 1330 people screened for vaccination, coverage of the vaccination campaign was 11%. For referred people, the adjusted coverage was 18%. Coverage was lowest among the very-old and highest for people aged 50-70 years.
Conclusion: The estimated coverage of the vaccination campaign was limited. This should be interpreted in the light of the complexity of this target-group with much co-morbidity, and of the vaccine that required invasive pre-vaccination screening. Calculation of prevalence rates of risk-conditions based on the IPCI-database was feasible. This procedure proved an efficient tool for future use, when prevalence estimates for policy, implementation or surveillance of subgroup-vaccination or other health-care interventions are needed.
Conflict of interest statement
Figures

References
-
- van der Hoek W, Schneeberger PM, Oomen T, Wegdam-Blans MC, Dijkstra F, Notermans DW, et al. Shifting priorities in the aftermath of a Q fever epidemic in 2007 to 2009 in The Netherlands: from acute to chronic infection. Euro Surveill. 2012;17(3):20059 - PubMed
-
- Parker NR, Barralet JH, Bell AM. Q fever. Lancet. 2006;367(9511):679–88. - PubMed
Publication types
MeSH terms
LinkOut - more resources
Full Text Sources
Other Literature Sources
Medical
