. 2016 Jan;23(1):18-28.
doi: 10.1038/cdd.2015.39. Epub 2015 Apr 24.

Synaptic dysfunction, memory deficits and hippocampal atrophy due to ablation of mitochondrial fission in adult forebrain neurons

Affiliations

Synaptic dysfunction, memory deficits and hippocampal atrophy due to ablation of mitochondrial fission in adult forebrain neurons

B Oettinghaus et al. Cell Death Differ. 2016 Jan.

Abstract

Well-balanced mitochondrial fission and fusion processes are essential for nervous system development. Loss of function of the main mitochondrial fission mediator, dynamin-related protein 1 (Drp1), is lethal early during embryonic development or around birth, but the role of mitochondrial fission in adult neurons remains unclear. Here we show that inducible Drp1 ablation in neurons of the adult mouse forebrain results in progressive, neuronal subtype-specific alterations of mitochondrial morphology in the hippocampus that are marginally responsive to antioxidant treatment. Furthermore, DRP1 loss affects synaptic transmission and memory function. Although these changes culminate in hippocampal atrophy, they are not sufficient to cause neuronal cell death within 10 weeks of genetic Drp1 ablation. Collectively, our in vivo observations clarify the role of mitochondrial fission in neurons, demonstrating that Drp1 ablation in adult forebrain neurons compromises critical neuronal functions without causing overt neurodegeneration.


Figures

Figure 1
Figure 1
Drp1 ablation in postmitotic forebrain neurons. (a) Drp1flx/flx and Drp1flx/flx CaMKIIα CreERT2−/+ mice were crossed, resulting in a Mendelian distribution of alleles. At 8 weeks of age, animals were injected with tamoxifen for 5 consecutive days to induce recombination of the floxed Drp1 locus. (b) Mice of the indicated genotype were killed at the indicated time points p.t.i. Hippocampal lysates were separated by sodium dodecyl sulfate-polyacrylamide gel electrophoresis and immunoblotted using the indicated antibodies. (c) Immmunohistochemical staining (NovaRED (Vectorlabs, Burlingame, CA, USA), counterstain hematoxylin) for Drp1 was performed on hippocampal CA1 formalin-fixed, paraffin-embedded tissue sections of Drp1iΔb/iΔb mice 4 weeks p.t.i. Arrows indicate unstained hippocampal dendrites. Scale bar, 5 μm
Figure 2
Figure 2
Mitochondrial morphology in primary neuronal cultures after Drp1 ablation. (a) Primary cortical neurons isolated from Drp1flx/flx E17 embryos were co-electroporated with mtYFP- and Cre-expression constructs prior to seeding. Images were taken at the indicated time points of differentiation
Figure 3
Figure 3
Mitochondrial morphology in the hippocampus after Drp1 ablation. Mice of the indicated genotype were killed at the indicated times p.t.i. Coronal sections of formalin-fixed, paraffin-embedded brains of Drp1iΔb/iΔb and control mice were immunostained for cytochrome c oxidase subunit 1. Images show CA1 and CA3 pyramidal neurons and DG granule cells. Scale bar, 10 μm
Figure 4
Figure 4
Electrophysiological properties are not affected in Drp1-ablated neurons. (a) Acute hippocampal slices of Drp1iΔb/iΔb 4 weeks p.t.i. and control animals were prepared. CA1 pyramidal neurons were patch-clamped and infused with biocytin, which was revealed by immunofluorescence. Scale bar, 40 μm. Note the regular dendritic morphology. (bd) One-second-long current steps of increasing amplitude were injected to induce action potentials in Drp1iΔb/iΔb 4 weeks p.t.i. and control CA1 pyramidal neurons; maximal amplitude and half width were plotted. Data represent average±S.E.M. of at least seven neurons. (e) Resting membrane potential of Drp1iΔb/iΔb 4 weeks p.t.i. and control CA1 pyramidal neurons. Data represent average±S.E.M. of at least seven neurons
Figure 5
Figure 5
Impaired synaptic transmission in Drp1-ablated neurons. (a) Representative fEPSPs before and after 10 s of 10 Hz stimulation. fEPSPs were recorded in the CA1 stratum radiatum in Drp1iΔb/iΔb and control hippocampal slice cultures upon Schaffer collateral stimulation. (b) Mean slope of fEPSPs during the time course of a 10-s 10-Hz stimulation was plotted. Data represent average±S.E.M. of at least six neurons. (c) Maximal mean fEPSP slope after 10-s 10-Hz stimulation. Data represent average±S.E.M. of at least six neurons. (d) Drp1iΔb/iΔb 4 weeks p.t.i. and control animals were placed in an eight-arm radial maze, which they were left to systematically explore. Correct alternation of arm visits was scored. Data represent average±S.E.M. of at least six animals. (e) Oxygen consumption rate of isolated hippocampal mitochondria of Drp1iΔb/iΔb and control mice was measured with a Seahorse Bioscience XF24 Analyzer. Substances were injected at the indicated time points. Data represent average±S.E.M. of at least four animals whose hippocampi were pooled; measurements performed with at least six replicates. (f) ATP content of isolated hippocampal mitochondria of Drp1iΔb/iΔb and control mice as measured with a bioluminescence assay. Data represent average±S.E.M. of at least four animals whose hippocampi were pooled; measurements were performed with at least eight replicates. (g) Synapses in TEM images of Drp1iΔb/iΔb 4 weeks p.t.i. and control hippocampi were screened for presynaptic mitochondria. Data represent average±S.E.M. of at least 4 animals of which at least 100 synapses each were screened. TEM image shows a representative synaptic structure with a presynaptic mitochondrion (M), presynaptic vesicles (V) and a postsynaptic dense area (PSD). Scale bar, 150 nm. Asterisks denote P-values of an unpaired, two-tailed Student's t-test: *P<0.05
Figure 6
Figure 6
Long-term Drp1 ablation causes hippocampal atrophy. (a) Representative camera lucida drawings and Sholl analysis of Golgi-stained Drp1iΔb/iΔb 10 weeks p.t.i. and control CA1 pyramidal neurons. Each data point represents the number of intersections of the dendritic tree with concentric perisomatic rings of increasing diameter (exemplified by dashed circles). Data represent average±S.E.M. of at least 100 neurons. (b) Hippocampal volume was recorded on H&E-stained, serial coronal cross-sections of Drp1iΔb/iΔb animals 8-weeks p.t.i. applying the Cavalieri principle. For cortical and midbrain volumes, only sections representing the coordinates bregma from 1.1 to −1.2 mm were considered. Data represent average±S.E.M. of at least five animals. (c) Number of spines visualized by Golgi staining per μm dendrite length (apical dendritic tree of CA1 pyramidal neurons). Data represent average±S.E.M. of at least 3 animals of which 1000 spines were counted. (d) Coronal cross-sections of Drp1iΔb/iΔb 10 weeks p.t.i. and control brains co-stained with presynaptic VGLUT2 (green) and postsynaptic marker PSD95 (red). A 150 × 150 × 5 μm3 confocal image stack in the CA1 stratum radiatum was recorded, and the number of overlapping puncta was determined. Data represent average±S.E.M. of at least five animals of which four stacks each were recorded. Scale bar, 5 μm. Asterisks denote P-values of an unpaired, two-tailed Student's t-test: *P<0.05
Figure 7
Figure 7
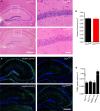
Drp1 ablation does not lead to hippocampal neurodegeneration. (a) H&E staining of coronal cross-sections of formalin-fixed, paraffin-embedded Drp1iΔb/iΔb 10 weeks p.t.i. and control brains showing the hippocampus and a magnification of the CA1 region. Scale bars, 1 mm (left) and 50 μm (right). (b) Neuronal nuclei in the CA1 region were quantified manually. Data represent average±S.E.M. of at least 5 animals of which at least 200 nuclei each were counted. (c) In situ TUNEL of coronal cross-sections of frozen Drp1iΔb/iΔb 10 weeks p.t.i. and control brains showing hippocampus. Positive control was preincubated with DNAse I; negative control incubated without terminal deoxynucleotidyl transferase. Scale bar, 1 mm. (d) Neuronal nuclei in the CA1 region were quantified over a 250-μm length. Data represent average±S.E.M. of at least five animals
Figure 8
Figure 8
The antioxidant mitoQ ameliorates mitochondrial morphology in Drp1-deficient CA1 and DG hippocampal neurons. (a and b) Oxidative stress levels represented by dihydrorhodamine (DHR) and MitoSox fluorescence in cortical and hippocampal tissue homogenates of Drp1iΔb/iΔb 4 weeks p.t.i. and control mice. Data represent average±S.E.M. of at least four animals (tissue pooled), and measurements were performed with a minimum of four replicates. (c) Thiobarbituric acid-reactive substance (TBARS) levels, reflecting lipid peroxidation, in Drp1iΔb/iΔb 4 weeks p.t.i. and control cortical and hippocampal lysates measured by colorimetric assay. Data represent average±S.E.M. of at least six animals. (d) Ratio of oxidized to total glutathione in hippocampal lysates of Drp1iΔb/iΔb 4 weeks p.t.i. and control mice measured by colorimetric assay. Data represent average±S.E.M. of at least six animals. (e) Drp1iΔb/iΔb animals treated or not with daily mitoQ injections of 20 mg/kg i.p. were killed 10 days p.t.i.. and coronal cross-sections of formalin-fixed, paraffin-embedded brains immunostained for cytochrome c oxidase subunit 1. Mitobulbs of randomly selected areas within the indicated hippocampal subregions were quantified. Scale bar, 10 μm. Data represent average±S.E.M. of at least four animals. Asterisks denote P-values of an unpaired, two-tailed Student's t-test. *P<0.05

Similar articles

Cited by

References

    1. Nunnari J, Suomalainen A. Mitochondria: in sickness and in health. Cell 2012; 148: 1145–1159. - PMC - PubMed
    1. Sheng Z-H. Mitochondrial trafficking and anchoring in neurons: New insight and implications. J Cell Biol 2014; 204: 1087–1098. - PMC - PubMed
    1. McLelland G-L, Soubannier V, Chen CX, McBride HM, Fon EA. Parkin and PINK1 function in a vesicular trafficking pathway regulating mitochondrial quality control. EMBO J 2014; 33: 282–295. - PMC - PubMed
    1. Twig G, Elorza A, Molina AJ, Mohamed H, Wikstrom JD, Walzer G et al. Fission and selective fusion govern mitochondrial segregation and elimination by autophagy. EMBO J 2008; 27: 433–446. - PMC - PubMed
    1. Chen H, Chomyn A, Chan DC. Disruption of fusion results in mitochondrial heterogeneity and dysfunction. J Biol Chem 2005; 280: 26185–26192. - PubMed

Publication types

MeSH terms