. 2015 Dec;22(12):1970-84.
doi: 10.1038/cdd.2015.44. Epub 2015 Apr 24.

ADAM12-directed ectodomain shedding of E-cadherin potentiates trophoblast fusion

Affiliations

ADAM12-directed ectodomain shedding of E-cadherin potentiates trophoblast fusion

M Aghababaei et al. Cell Death Differ. 2015 Dec.

Abstract

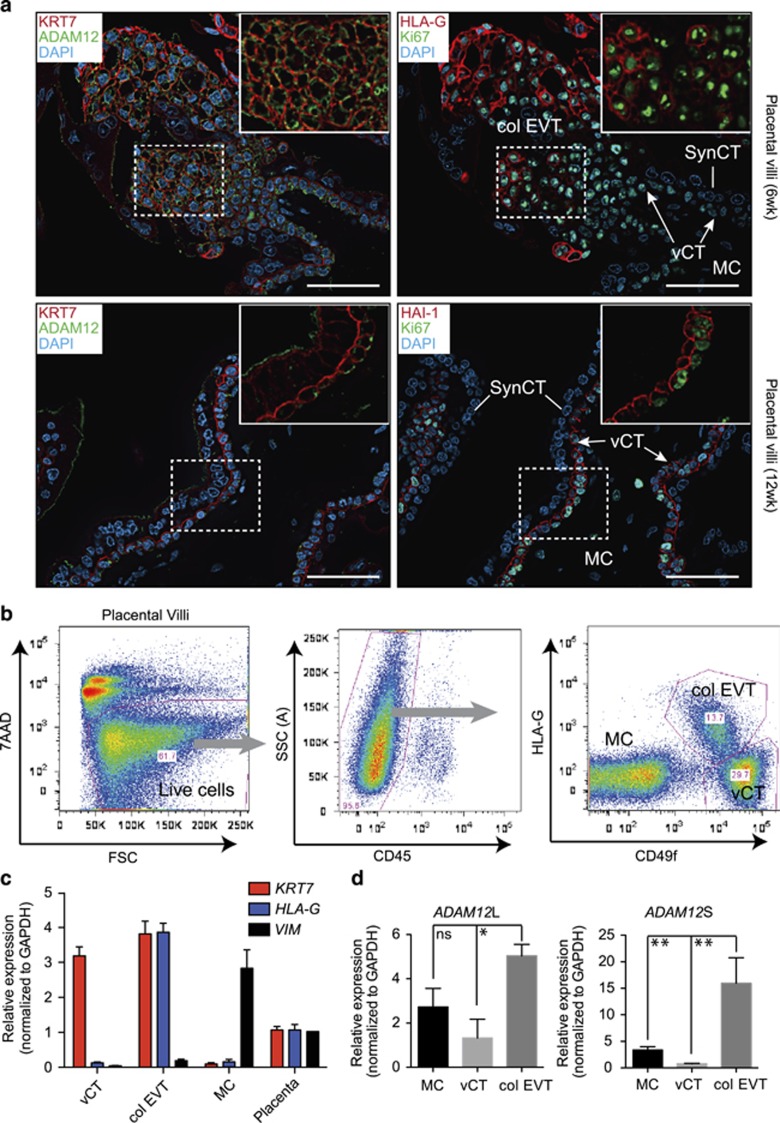
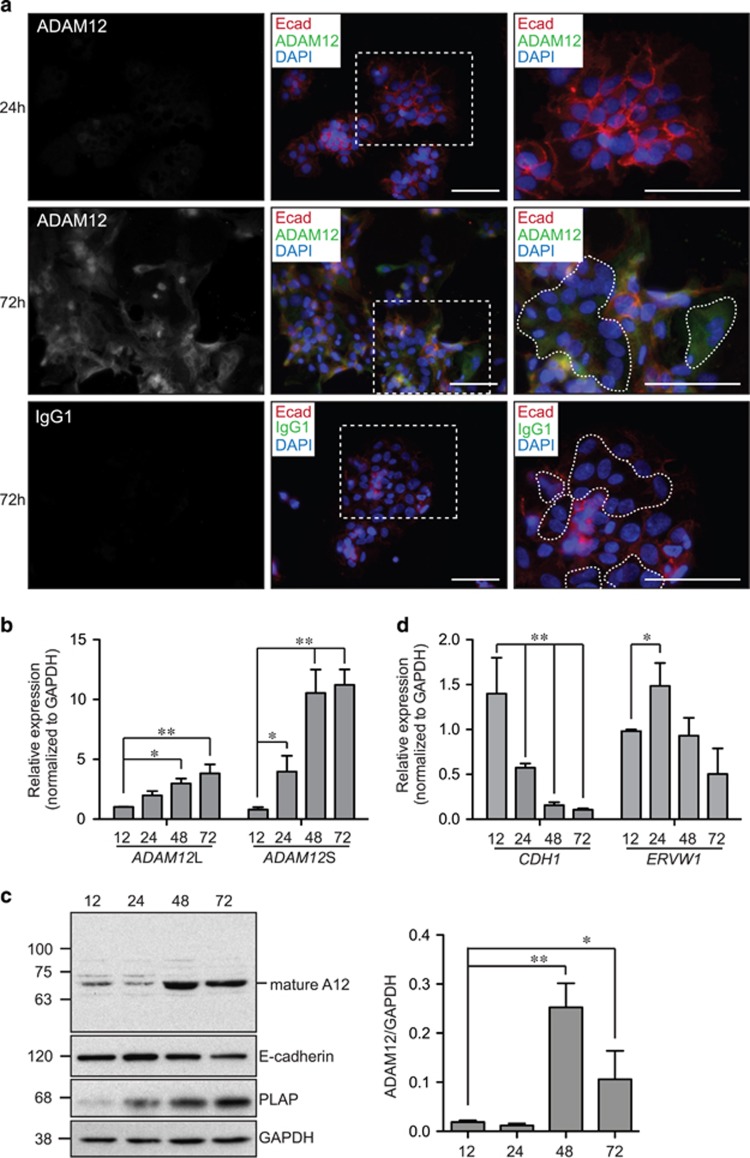
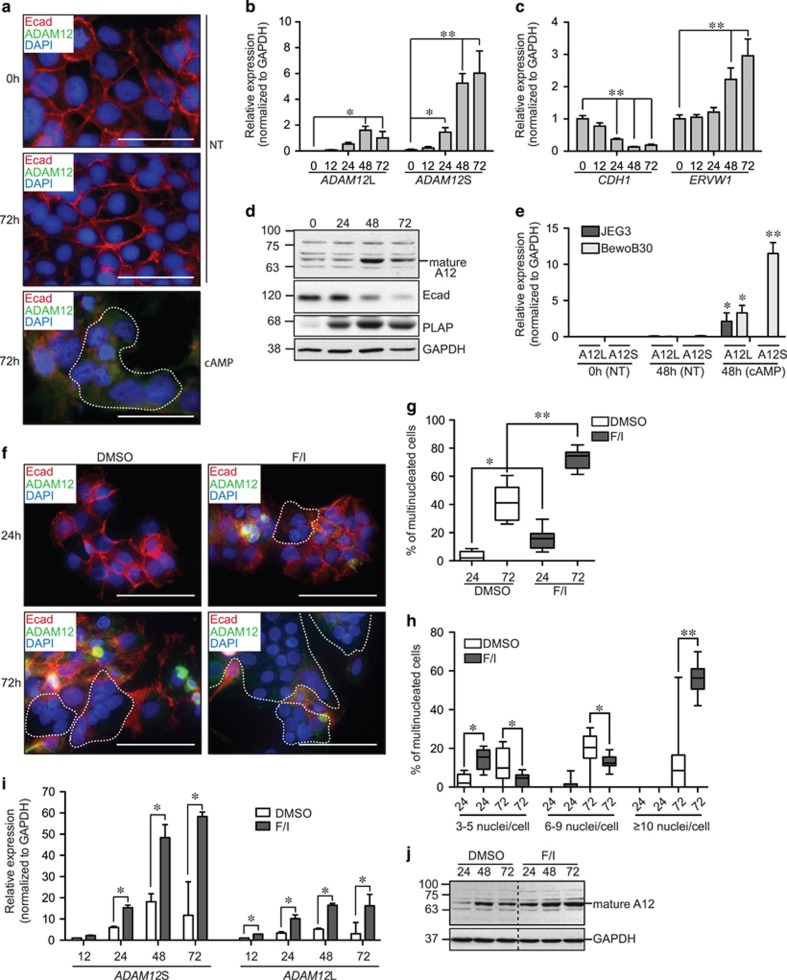
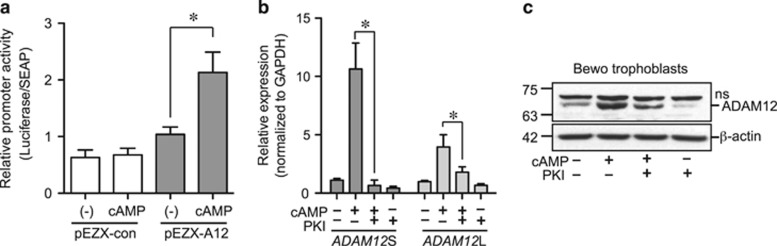
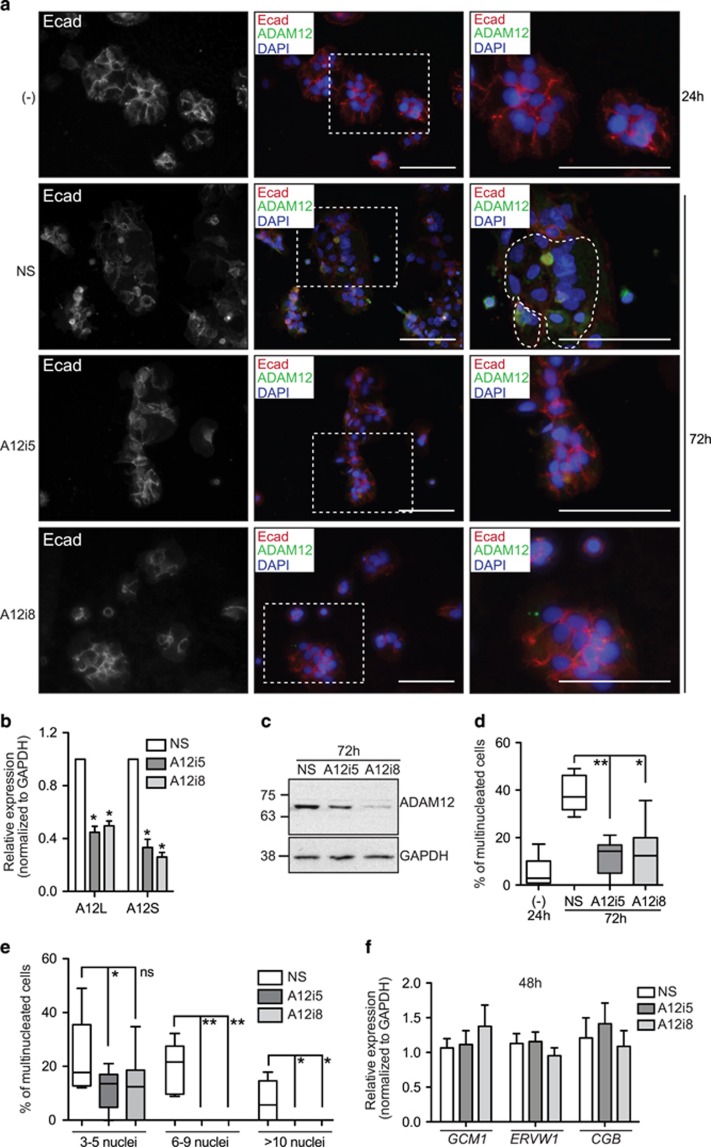
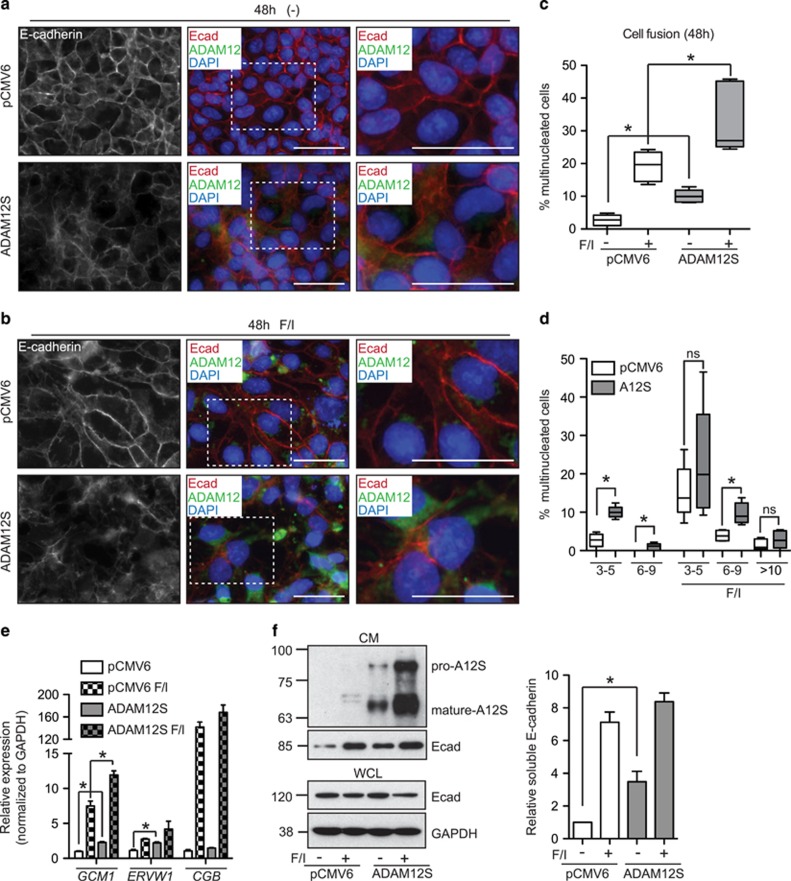
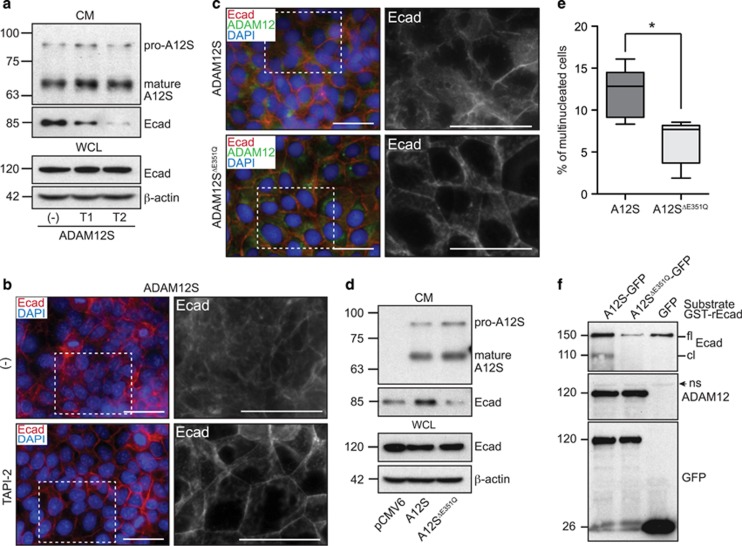
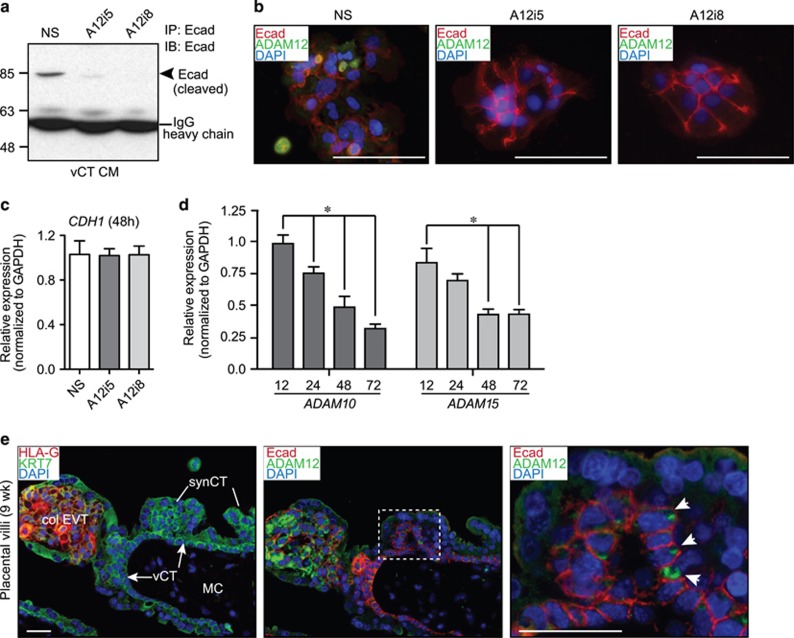
Trophoblasts, placental cells of epithelial lineage, undergo extensive differentiation to form the cellular components of the placenta. Trophoblast progenitor cell differentiation into the multinucleated syncytiotrophoblast is a key developmental process required for placental function, where defects in syncytiotrophoblast formation and turnover associate with placental pathologies and link to poor pregnancy outcomes. The cellular and molecular processes governing syncytiotrophoblast formation are poorly understood, but require the activation of pathways that direct cell fusion. The protease, A Disintegrin and Metalloproteinase 12 (ADAM12), controls cell fusion in myoblasts and is highly expressed in the placenta localizing to multiple trophoblast populations. However, the importance of ADAM12 in regulating trophoblast fusion is unknown. Here, we describe a function for ADAM12 in regulating trophoblast fusion. Using two distinct trophoblast models of cell fusion, we show that ADAM12 is dynamically upregulated and is under the transcriptional control of protein kinase A. siRNA-directed loss of ADAM12 impedes spontaneous fusion of primary cytotrophoblasts, whereas overexpression of the secreted variant, ADAM12S, potentiates cell fusion in the Bewo trophoblast cell line. Mechanistically, both ectopic and endogenous levels of ADAM12 were shown to control trophoblast fusion through E-cadherin ectodomain shedding and remodeling of intercellular boundaries. This study describes a novel role for ADAM12 in placental development, specifically highlighting its importance in controlling the differentiation of villous cytotrophoblasts into multinucleated cellular structures. Moreover, this work identifies E-cadherin as a novel ADAM12 substrate, and highlights the significance that cell adhesion molecule ectodomain shedding has in normal development.


Figures

Figure 1
Figure 1
ADAM12 localizes to multiple trophoblast subtypes within placental villi. (a) Immunofluorescence images of first trimester placental villi (6 and 12 week gestation) immunostained with antibodies directed against ADAM12 (green) and the cytotrophoblast markers KRT7 (red), HAI-1 (red) and HLA-G (red); proliferative cells are labeled with an antibody targeting Ki67 (green) and DAPI-stained nuclei are labeled blue. Images are representative of placental villi from 5 to 7 weeks gestation (N=5) and 10 to 12 weeks gestation (N=5). Bar=100 μm. 'col EVT' indicates EVT column; 'MC' indicates placenta mesenchymal core; 'synCT,' indicated by white lines, refers to the multinucleated synCT; 'vCT', indicated by white arrows, denotes vCTs. The perforated white box indicates enlarged inset image. (b) FACS plots demonstrate the trophoblast isolation strategy used to purify mesencymal core cells, columnar EVTs and vCTs. Live cells, depleted of CD31+ (endothelial) and CD45+ (immune) cells using immune-magnetic beads, were positively gated by 7AAD exclusion. Cells were further segregated by excluding CD45+ immune cells and by cell surface labeling of HLA-G and CD49f. Cell subtype proportions are indicated within each gated population (percent of cells within FACS plot). (c) Trophoblast subtype purity was assessed by qPCR analysis targeting the pan-trophoblast marker KRT7, the EVT-marker HLA-G and the mesenchymal lineage marker VIM; placental villi (Placenta) served as positive control and relative gene expression reference. (d) qPCR analysis of ADAM12L and ADAM12S in FACS-purified mesenchymal core cells, vCTs and column EVTs. GAPDH was used for normalization. Results are presented as mean±s.e.m. in bar graphs (*P≤ 0.05, **P≤0.01) from four distinct placental villi specimens (N=4)
Figure 2
Figure 2
Spontaneous cytotrophoblast differentiation drives ADAM12 expression. (a) Representative immunofluorescence images of vCTs probed with antibodies directed against ADAM12 (green) and E-cadherin (Ecad; red) cultured for 24 or 72 h. DAPI-stained nuclei are labeled blue. Perforated white box shows magnified region while dotted line outlines multi-nucleated syncytial-like cell structures. Bar=50 μm. IgG1-AlexaFluor-488 stain indicates the amount of secondary non-specific signal. (b) qPCR analysis of ADAM12L and ADAM12S in spontaneously differentiating vCTs over 72 h of culture. (c) Immunoblots showing ADAM12, E-cadherin and PLAP protein levels in whole cell lysates derived from primary vCTs cultured over 72 h. Molecular weights (kDa) are shown to the left and GAPDH indicates loading control. Mature ADAM12 (A12; 68 kDa) is highlighted and bar graph to the right denotes ADAM12 protein quantification over 72 h from four distinct cytotrophoblast cultures (N=4) assayed by densitometry. (d) qPCR analysis of CDH1 (E-cadherin) and ERVW1 mRNA transcripts in vCTs cultured over 72 h. The results are presented as mean±s.e.m. in bar graphs (*P≤ 0.05, **P≤0.01) from primary cytotrophoblasts isolated from four distinct term placentae (N=4). All qPCR gene expression reactions were normalized to endogenous GAPDH
Figure 3
Figure 3
cAMP-triggered cell fusion in trophoblasts drives ADAM12 expression. (a) Representative immunofluorescence images of Bewo cells (from N=6 experiments) probed with antibodies directed against ADAM12 (green) and E-cadherin (Ecad; red) following 0 and 72 h of culture in the absence (NT) or presence of cAMP. DAPI-stained nuclei are labeled blue and dotted white line outlines multi-nucleated syncytial-like structures. Bar=50 μm. qPCR analysis of (b) ADAM12L and ADAM12S and (c) CDH1 (E-cadherin) and ERVW1 mRNA transcripts in Bewo cells cultured in 1.0 mM cAMP over 72 h. GAPDH was used for normalization. (d) Representative immunoblots (N=4) showing ADAM12, E-cadherin and PLAP protein levels in whole cell lysates derived from Bewo cells treated with cAMP over 72 h. Molecular weights (kDa) are shown to the left and GAPDH indicates loading control. Mature ADAM12 (A12) (68 kDa) is indicated. (e) qPCR analysis of ADAM12L and ADAM12S in non-fusogenic JEG-3 and fusogenic Bewo cells left untreated (NT) or treated with cAMP for 48 h. Gene expression experiments were performed in triplicate and replicated N=4 times. (f) Representative immunofluorescence images of vCTs probed with antibodies against ADAM12 (green) and E-cadherin (Ecad; red) following 0 and 72 h of culture in forskolin/IBMX (F/I) or DMSO. DAPI-stained nuclei are labeled blue and dotted white line outlines multi-nucleated structures. Bar=50 μm. Quantification of (g) multi-nuclear cells (≥ 3 nuclei per cell) and (h) the proportion of multinucleated cells containing 3–5 nuclei, 6–9 nuclei, or ≥10 nuclei; box-plots depict the medians and IQRs of proportions of multinucleated vCTs treated with DMSO or with F/I over 72 h. Results are derived from three independent experiments from primary vCTs purified from three distinct plancetae (N=3). (i) qPCR analysis of ADAM12L and ADAM12S in vCTs treated with F/I or DMSO over 72 h. Gene expression experiments were performed in triplicate and replicated N=3 times. qPCR results are presented as mean±s.e.m. in bar graphs. (j) Representative immunoblot (N=3) showing ADAM12 protein levels in whole cell lysates derived from vCTs cells treated with F/I or DMSO over 72 h. Perforated black lines indicate samples run on same blot where lanes were not adjacent to eachother. Molecular weights (kDa) are shown to the left and GAPDH indicates loading control. *P≤0.05 or **P≤0.01
Figure 4
Figure 4
PKA controls ADAM12 gene expression in trophoblasts. (a) Bar graphs show quantification of ADAM12 promoter activity in non-treated (−) and cAMP-treated Bewo cells. Cells were transiently transfected with an empty pEZX-con or pEZX-ADAM12 promoter reporter luciferase vector. After 24 h of cAMP treatment, the luminescence of conditioned medium was measured. (b) qPCR analysis of ADAM12S and ADAM12L in Bewo cells left untreated or treated in combination with cAMP and the PKA-inhibitor PKI over 48 h. GAPDH was used for normalization. (c) Representative immunoblots (N=3) showing ADAM12 in whole cell lysates of Bewo cells left untreated or treated in combination with cAMP and the PKA-inhibitor PKI over 48 h. β-actin indicates loading control. Promoter activity and gene expression assays were performed in triplicate and repeated N=3 times. The results are presented as mean±s.e.m; *P≤0.05 compared with untreated (−) control
Figure 5
Figure 5
ADAM12 deficiency blocks spontaneous cytotrophoblast fusion. (a) Representative immunofluorescence images (from N=4 experiments) of vCTs probed with antibodies directed against ADAM12 (green) and E-cadherin (Ecad; red). Cell were untreated (−) or transfected with non-silencing (NS) or ADAM12-targeting siRNAs (A12i5, A12i8) and cultured for 24 or 72 h. DAPI-stained nuclei are labeled blue. Perforated white box shows magnified region while dotted line outlines multi-nucleated syncytial-like cell structures. Bar=50 μm. (b) qPCR analysis of ADAM12L (A12L) and ADAM12S (A12S) in NS and ADAM12 siRNA-transfected cells. GAPDH was used for normalization. (c) Immunoblot showing protein levels of ADAM12 in cell lysates from cytotrophoblasts transfected with control (NS) or ADAM12-directed siRNAs and cultured for 72 h. Molecular weights (kDa) are shown to the left and GAPDH indicates loading control. Box-plots represent quantification of the proportion of (d) multinucleated cytotrophoblasts (≥3 nuclei per cell) or (e) multinucleated cells containing 3–5 nuclei, 6–9 nuclei or ≥10 nuclei in cultures untreated (24 h) or transfected with NS or ADAM12-directed siRNAs (72 h). Medians are denoted by solid black lines, while top and bottom box edges denote first and third quartiles. Whiskers show the largest and smallest data point within 1.5 times the IQR. (f) qPCR analysis of GCM1, ERVW1 and CGB (βhCG) in siRNA-transfected cytotrophoblasts cultured over 48 h. Gene expression was performed in triplicate on primary cytotrophoblasts isolated from four distinct term placentae (N=4). GAPDH was used for normalization; qPCR data presented as mean±s.e.m. *P≤ 0.05 or **P≤0.01 compared with untreated NS control
Figure 6
Figure 6
ADAM12S overexpression potentiates trophoblastic cell fusion. (a) Representative immunofluorescence images (from N=6 experiments) of stably transfected Bewo cells probed with antibodies directed against ADAM12 (green) and E-cadherin (Ecad; red). Cells were transfected with pCMV6 or pCMV6-ADAM12S (ADAM12S) expression constructs and cultured for 48 h after seeding; DAPI-stained nuclei are labeled blue. Perforated white box shows magnified region. (b) As above, except Bewo cells are treated with forskolin/IBMX (F/I). Bar=50 μm. Quantification of (c) multi-nuclear cells (≥3 nuclei per cell) in (a) and (b) and (d) the proportion of multinucleated cells containing 3–5 nuclei, 6–9 nuclei or ≥10 nuclei; box-plots depict the medians and IQRs of proportions of multinucleated Bewo cells stably transfected with pCMV6 or ADAM12S expression constructs. (e) qPCR analysis of GCM1, ERVW1 and CGB (βhCG) in F/I-stimulated Bewo cells stably transfected with the control pCMV6 or ADAM12S expression constructs. Gene expression was performed in triplicate on three independent occasions (N=3); data presented as mean±s.e.m. (f) Representative immunoblot (N=4) showing ADAM12 and E-cadherin (Ecad) protein levels in CM or whole cell lysates from Bewo cells stably transfected with pCMV6 or ADAM12S. Molecular weights (kDa) are shown to the left, pro- and mature-ADAM12S (A12S) are shown on the right and GAPDH indicates loading control. Quantification of soluble 85 kDa E-cadherin from CM of above indicated cells is shown to the right; data presented as mean±s.e.m. *P≤0.05; **P≤0.01; ns=not significant
Figure 7
Figure 7
ADAM12S controls trophoblast fusion in part by E-cadherin ectodomain shedding. (a) Representative immunoblots (N=3) of CM or whole cell lysates (WCL) from ADAM12S-transfected Bewo cells cultured for 72 h in the absence (−) or presence of the broad-spectrum metalloproteinase inhibitors, TAPI-1 (T1) or TAPI-2 (T2). Lysates were probed with antibodies directed against ADAM12 (pro-A12S; mature-A12S) or E-cadherin (Ecad). Molecular weights (kDa) are shown to the left and β-actin indicate loading controls. (b) Representative immunofluorescence images (N=3) of ADAM12S-transfected Bewo cells probed with anti-E-cadherin antibody (Ecad; red). Cells were either untreated (−) or cultured in the presence of TAPI-2; DAPI-stained nuclei are labeled blue. White perforated box indicates magnified area. (c) ADAM12 (green) and E-cadherin (Ecad; red) immunofluorescence images of Bewo cells stably transfected with either wildtype ADAM12S or protease-dead ADAM12SΔE351Q expression constructs; Bars=50 μm. (d) Immunoblots (N=3) of ADAM12S and E-cadherin in CM or WCL of Bewo cells stably transfected with the control pCMV6 construct as well as expression constructs described in (c). Molecular weights (kDa) are shown to the left and β-actin indicates loading control. (e) Box-plots depicting median and IQR values of the percent of multi-nucleated cells in ADAM12S and ADAM12SΔE351Q Bewo cells (N=3) cultured over 72 h; *P≤0.05. (f) Representative immunoblots (N=3) probed with antibodies directed against E-cadherin (Ecad), GFP and ADAM12 showing ADAM12-directed E-cadherin cleavage. Immunoprecipitated ADAM12-GFP was incubated with recombinant GST N-tagged E-cadherin (GST-rEcad); immunoprecipitated GFP and ADAM12ΔE351Q-GFP serve as controls. The full-length (fl) and cleaved (cl) E-cadherin products are indicated; ns denotes non-specific bands. Molecular weights (kDa) are shown to the left
Figure 8
Figure 8
ADAM12 participates in E-cadherin-directed intercellular junction remodeling during cytotrophoblast fusion. (a) Representative immunoblot of E-cadherin protein immunoprecipitated from CM derived from villous cytotrophoblast cultures (vCT CM) transfected with non-silencing control siRNA (NS) or siRNAs targeting ADAM12 (A12i5 and A12i8). Immunoprecipitated protein was subsequently immunoblotted using an antibody directed against the extracellular domain of E-cadherin. The IgG heavy chain is indicated, while protein loading is normalized by Ponceau staining. Molecular weights (kDa) are shown to the left. (b) Immunofluorescence images of siRNA-transfected cytotrophoblasts (as above) probed with antibodies directed against E-cadherin (Ecad; red) and ADAM12 (green); DAPI-stained nuclei are labeled blue. Cells were allowed to differentiate for 72 h post seeding. Images are representative of three independent experiments (N=3). (c) qPCR analysis of CDH1 in spontaneously fusing vCTs at 48 h of culture. Gene expression experiments were performed in triplicate and repeated on cells isolated from three distinct placentae (N=3). (d) qPCR analysis of ADAM10 and ADAM15 mRNA transcripts in differentiating primary cytotrophoblasts cultured over 72 h. GAPDH was used for normalization. Gene expression experiments were performed in triplicate and repeated on cells isolated from three distinct placentae (N=3). Data presented as mean±s.e.m; *P≤0.05. (e) Representative images of 9 week gestation first trimester placental villi (N=5 placental villi) immunostained for HLA-G (red), KRT7 (green), E-cadherin (Ecad; red) and ADAM12 (green). Nuclei are labeled with DAPI (blue). Column EVTs (col EVT), vCTs, synCT and mesenchymal core cells (MC) are indicated. Perforated box shows area of image magnification to right. White arrowheads indicate E-cadherin positivity in vCTs differentiating into synCT. Bars=50 μm

Similar articles

Cited by

References

    1. Pijnenborg R, Vercruysse L, Carter AM. Deep trophoblast invasion and spiral artery remodelling in the placental bed of the chimpanzee. Placenta 2011; 32: 400–408. - PubMed
    1. Avagliano L, Marconi AM, Romagnoli S, Bulfamante GP. Abnormal spiral arteries modification in stillbirths: the role of maternal prepregnancy body mass index. J Matern Fetal Neonatal Med 2012; 25: 2789–2792. - PubMed
    1. Oren-Suissa M, Podbilewicz B. Cell fusion during development. Trends Cell Biol 2007; 17: 537–546. - PubMed
    1. Chaddha V, Viero S, Huppertz B, Kingdom J. Developmental biology of the placenta and the origins of placental insufficiency. Semin Fetal Neonatal Med 2004; 9: 357–369. - PubMed
    1. Pidoux G, Gerbaud P, Dompierre J, Lygren B, Solstad T, Evain-Brion D et al. A PKA-ezrin-connexin 43 signaling complex controls gap junction communication and thereby trophoblast cell fusion. J Cell Sci 2014; 127: 4172–4185. - PubMed

Publication types

MeSH terms

LinkOut - more resources