

Electric Field Model of Transcranial Electric Stimulation in Nonhuman Primates: Correspondence to Individual Motor Threshold
- PMID: 25910001
- PMCID: PMC4552449
- DOI: 10.1109/TBME.2015.2425406
Electric Field Model of Transcranial Electric Stimulation in Nonhuman Primates: Correspondence to Individual Motor Threshold
Abstract
Objective: To develop a pipeline for realistic head models of nonhuman primates (NHPs) for simulations of noninvasive brain stimulation, and use these models together with empirical threshold measurements to demonstrate that the models capture individual anatomical variability.
Methods: Based on structural MRI data, we created models of the electric field (E-field) induced by right unilateral (RUL) electroconvulsive therapy (ECT) in four rhesus macaques. Individual motor threshold (MT) was measured with transcranial electric stimulation (TES) administered through the RUL electrodes in the same subjects.
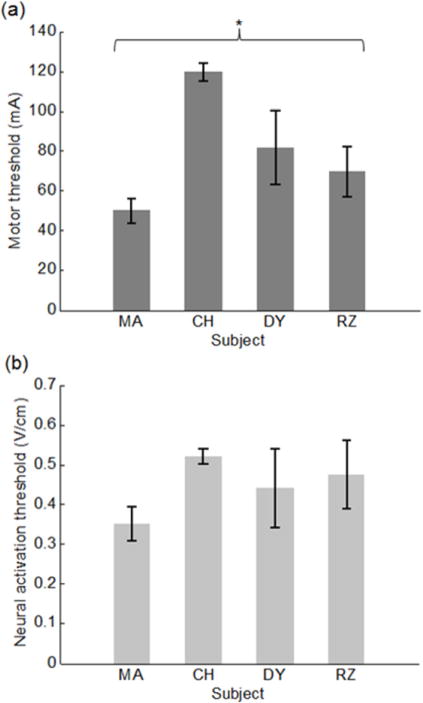
Results: The interindividual anatomical differences resulted in 57% variation in median E-field strength in the brain at fixed stimulus current amplitude. Individualization of the stimulus current by MT reduced the E-field variation in the target motor area by 27%. There was significant correlation between the measured MT and the ratio of simulated electrode current and E-field strength (r(2) = 0.95, p = 0.026). Exploratory analysis revealed significant correlations of this ratio with anatomical parameters including of the superior electrode-to-cortex distance, vertex-to-cortex distance, and brain volume (r(2) > 0.96, p < 0.02). The neural activation threshold was estimated to be 0.45 ±0.07 V/cm for 0.2-ms stimulus pulse width.
Conclusion: These results suggest that our individual-specific NHP E-field models appropriately capture individual anatomical variability relevant to the dosing of TES/ECT. These findings are exploratory due to the small number of subjects.
Significance: This study can contribute insight in NHP studies of ECT and other brain stimulation interventions, help link the results to clinical studies, and ultimately lead to more rational brain stimulation dosing paradigms.
Figures


Similar articles
-
Anatomical variability predicts individual differences in transcranial electric stimulation motor threshold.Annu Int Conf IEEE Eng Med Biol Soc. 2013;2013:815-8. doi: 10.1109/EMBC.2013.6609625. Annu Int Conf IEEE Eng Med Biol Soc. 2013. PMID: 24109812
-
Minimum Electric Field Exposure for Seizure Induction with Electroconvulsive Therapy and Magnetic Seizure Therapy.Neuropsychopharmacology. 2017 May;42(6):1192-1200. doi: 10.1038/npp.2016.276. Epub 2016 Dec 9. Neuropsychopharmacology. 2017. PMID: 27934961 Free PMC article.
-
Electric field characteristics of electroconvulsive therapy with individualized current amplitude: a preclinical study.Annu Int Conf IEEE Eng Med Biol Soc. 2013;2013:3082-5. doi: 10.1109/EMBC.2013.6610192. Annu Int Conf IEEE Eng Med Biol Soc. 2013. PMID: 24110379
-
A review of computational models of transcranial electrical stimulation.Crit Rev Biomed Eng. 2013;41(1):21-35. doi: 10.1615/critrevbiomedeng.2013007163. Crit Rev Biomed Eng. 2013. PMID: 23510007 Review.
-
Selection of stimulus parameters for deep brain stimulation.Clin Neurophysiol. 2004 Nov;115(11):2431-41. doi: 10.1016/j.clinph.2004.05.031. Clin Neurophysiol. 2004. PMID: 15465430 Review.
Cited by
-
Comparison of electric field strength and spatial distribution of electroconvulsive therapy and magnetic seizure therapy in a realistic human head model.Eur Psychiatry. 2016 Aug;36:55-64. doi: 10.1016/j.eurpsy.2016.03.003. Epub 2016 Jun 16. Eur Psychiatry. 2016. PMID: 27318858 Free PMC article.
-
Prediction of Force Recruitment of Neuromuscular Magnetic Stimulation From 3D Field Model of the Thigh.IEEE Trans Neural Syst Rehabil Eng. 2022;30:748-757. doi: 10.1109/TNSRE.2022.3151637. Epub 2022 Mar 28. IEEE Trans Neural Syst Rehabil Eng. 2022. PMID: 35192464 Free PMC article.
-
Cortical origin of theta error signals.Cereb Cortex. 2023 Nov 27;33(23):11300-11319. doi: 10.1093/cercor/bhad367. Cereb Cortex. 2023. PMID: 37804250 Free PMC article.
-
A Computational Assessment of Target Engagement in the Treatment of Auditory Hallucinations with Transcranial Direct Current Stimulation.Front Psychiatry. 2018 Feb 22;9:48. doi: 10.3389/fpsyt.2018.00048. eCollection 2018. Front Psychiatry. 2018. PMID: 29520240 Free PMC article.
-
How electroconvulsive therapy works in the treatment of depression: is it the seizure, the electricity, or both?Neuropsychopharmacology. 2024 Jan;49(1):150-162. doi: 10.1038/s41386-023-01677-2. Epub 2023 Jul 24. Neuropsychopharmacology. 2024. PMID: 37488281 Free PMC article. Review.
References
-
- Lisanby SH, et al. Neurophysiological characterization of magnetic seizure therapy (MST) in non-human primates. Suppl Clin Neurophysiol. 2003;56:81–99. - PubMed
-
- Moscrip TD, et al. A primate model of anterograde and retrograde amnesia produced by convulsive treatment. J ECT. 2004;20(1):26–36. - PubMed
-
- Peterchev AV, et al. Pulse amplitude adjustment: a novel means of individualizing and predicting dosage requirements for electroconvulsive therapy and magnetic seizure therapy. J ECT. 2010;26:154.
-
- Peterchev AV, et al. Optimal frequency for seizure induction. J ECT. 2010;26:154.
