. 2015 Apr 23;161(3):647-660.
doi: 10.1016/j.cell.2015.04.013.

Widespread macromolecular interaction perturbations in human genetic disorders

Affiliations

Widespread macromolecular interaction perturbations in human genetic disorders

Nidhi Sahni et al. Cell. .

Abstract

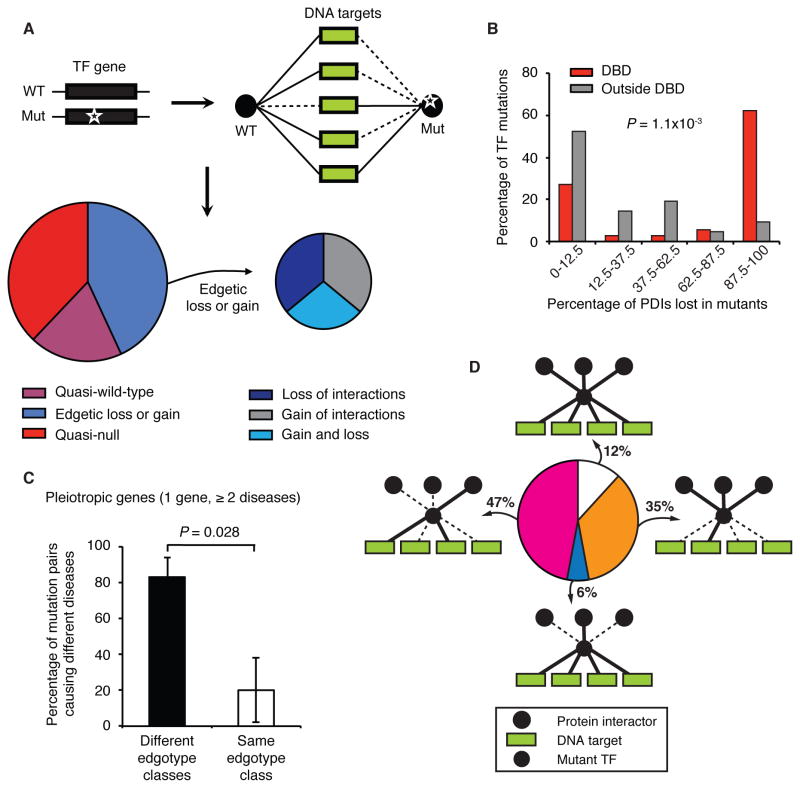
How disease-associated mutations impair protein activities in the context of biological networks remains mostly undetermined. Although a few renowned alleles are well characterized, functional information is missing for over 100,000 disease-associated variants. Here we functionally profile several thousand missense mutations across a spectrum of Mendelian disorders using various interaction assays. The majority of disease-associated alleles exhibit wild-type chaperone binding profiles, suggesting they preserve protein folding or stability. While common variants from healthy individuals rarely affect interactions, two-thirds of disease-associated alleles perturb protein-protein interactions, with half corresponding to "edgetic" alleles affecting only a subset of interactions while leaving most other interactions unperturbed. With transcription factors, many alleles that leave protein-protein interactions intact affect DNA binding. Different mutations in the same gene leading to different interaction profiles often result in distinct disease phenotypes. Thus disease-associated alleles that perturb distinct protein activities rather than grossly affecting folding and stability are relatively widespread.


Figures

Figure 1
Figure 1. Systematic Characterization of Human Disease Missense Mutations
(A) Two possible effects of missense disease mutations: protein folding/stability changes and molecular interaction perturbations. (B) Understanding mutational effects by edgotyping links genotype to phenotype. Solid and dashed lines represent retained and perturbed interactions, respectively. (C) Experimental pipeline for characterizing alterations of molecular interactions, including protein-chaperone (PCI), protein-protein (PPI) and protein-DNA (PDI) interactions. WT: WT, Mut: mutation. TF: transcription factor. “1”, detected PPI; “0”, not detected PPI. Dashed oval: variants in the same gene. See also Figure S1.
Figure 2
Figure 2. Most Disease Missense Mutations Do Not Impair Protein Folding or Stability
(A) Differential Z score distributions in LUMIER assay. Normalized differential Z scores are calculated as the difference in chaperone binding between all mutant/WT pairs expressed at detectable levels (n = 12,131). Non-expressed pairs serve as controls (n = 1,567). (B–H) Interaction scatter plots for 2,332 disease alleles. Alleles were assayed for interaction with QCFs HSP90 (B), HSC70 (C), BAG2 (D), CHIP (E), PMSD2 (F), GRP78 (G) and GRP94 (H). EGFR L858R and v-Src can interact with HSP90 (Shimamura et al., 2005; Taipale et al., 2012), and TTR D18G and ELANE G181V can interact with GRP78 (Kollner et al., 2006; Sorgjerd et al., 2006); hence used as controls. Filled circles with black border represent significantly increased chaperone binding. Correlations by Pearson coefficient of determination, R2. (I) Clustering analysis based on chaperone interaction profile similarity. (J) Validation by co-immunoprecipitation (co-IP). LUMIER scores are shown below the blots. See also Figure S2.
Figure 3
Figure 3. Mutant Proteins with Enhanced Binding to QCFs Are Likely to Be Unstable
(A) Protein expression levels measured by ELISA. X-axis shows all tested mutants (All), mutants with no change (non-binding) or an increase in binding to QCFs. (B) Solvent accessibility of mutant proteins. (C) Disorder analysis of mutant proteins. (D) Stability predictions by FoldX. ΔΔG, free energy change. Dashed line (A, D) represents the median of all mutants. P values (A, D) and (B, C) by one-sided Wilcoxon rank sum test and Chi-square test, respectively. For n values, see Table S7B. *, P < 0.05; **, P < 0.01; ***, P < 0.001. See also Figure S2–3.
Figure 4
Figure 4. Interaction Perturbation Profiles Distinguish Disease Mutations from Non-disease Variants
(A) Three classes of PPI profiles (edgotypes) for mutations. (B) Percentage of protein pairs recovered in GPCA at increasing score thresholds. Shading indicates standard error of the proportion. (C) Distribution of different edgotype classes for disease mutations. (DE) Differential LUMIER interaction scores among different edgotype classes, for binding to HSP90 (B) and HSC70 (C). P values by one-sided unpaired t-test. (F) Differential expression among different edgotype classes (ELISA log2 ratio of mutant over WT). QW: n = 75, E: n = 49, QN: n = 42. P values by one-sided Wilcoxon rank sum test. (G) Distribution of different edgotype classes for non-disease variants. (H) PCI comparison for non-disease variant (N) and disease mutant (D) proteins with HSP90 and HSC70. “Union”, variants with increased binding to HSP90 or HSC70. P values by one-sided Fisher’s exact test. Error bars indicate standard error of the proportion. *, P < 0.05. See also Figure S4–5.
Figure 5
Figure 5. Edgetic Mutations Perturb Interaction Interfaces with Protein Partners Expressed in Disease-Relevant Tissue
(A) PolyPhen-2 scores for mutations in different edgotype classes. P values by one-sided Wilcoxon rank sum test. (B) Percentage of mutations within Pfam domains. P values by one-sided position-shuffling test. (C) Percentage of mutations in exposed residues. QW: n = 83; E: n = 61; QN: n = 50. (D) Percentage of mutations at PPI interfaces. QW: n = 59; E: n = 32; QN: n = 16. (E) Percentage of interfacial mutations for perturbed (n = 14) and unperturbed (n = 18) interactions, compared to random mutations. (F) Percentage of perturbed (n = 118) and unperturbed (n = 85) interactors expressed in disease relevant tissues. 30 random genes from RNA-Seq dataset are assessed for each disease gene. P values from C to F by one-sided Fisher’s exact test. Error bars (B to F), standard error of the proportion. See also Figure S5.
Figure 6
Figure 6. Heterogeneous Genetic Mutations Give Rise to Diverse Disease Outcomes through Distinct Interaction Perturbations
(A) Schematic of pleiotropic disease outcomes resulting from distinct interaction patterns (edgotypes) caused by distinct mutations. Percentage of mutation pairs causing different diseases out of all pairs with different or the same edgotype classes is shown. n = 52. Error bars, standard error of the proportion. P value by one-sided Fisher’s exact test. (B) Example of edgotyping four disease mutations in the pleiotropic gene TPM3. (C) Most perturbed partners of TPM3 are expressed in the disease-relevant tissue. (D) Edgetic mutations in EFHC1 perturb epilepsy-related protein partners. (E) Correlation between the fraction of PPI perturbation and age of onset for mutation pairs causing the same disease. P value by comparing the observed value to 100,000 random controls (n = 13; Extended Experimental Procedures). See also Figure S6.
Figure 7
Figure 7. Integration of Protein-Protein and Protein-DNA Interaction Perturbations
(A) PDI edgotype distribution for disease mutations in 22 TFs that bind to more than one enhancer. (B) Histogram showing percentage of mutations within and outside DBDs as a function of the percentage of PDI loss. Numbers on x-axis indicate bin range. P value by one-sided Wilcoxon rank sum test. (C) Percentage of TF mutation pairs that cause different diseases out of all pairs with different or the same PDI edgotype classes (n = 17). Error bars, standard error of the proportion. P value by one-sided Fisher’s exact test. (D) PPI-PDI integration enables mutation characterization at higher resolution. Percentage of mutations is shown for: PPI unperturbed and PDI unperturbed; PPI unperturbed and PDI perturbed; PPI perturbed and PDI unperturbed; and PPI perturbed and PDI perturbed in the integrated network. See also Figure S7.

Comment in

References

    1. 1000 Genomes Project Consortium. An integrated map of genetic variation from 1,092 human genomes. Nature. 2012;491:56–65. - PMC - PubMed
    1. Adzhubei IA, Schmidt S, Peshkin L, Ramensky VE, Gerasimova A, Bork P, Kondrashov AS, Sunyaev SR. A method and server for predicting damaging missense mutations. Nature methods. 2010;7:248–249. - PMC - PubMed
    1. Amberger J, Bocchini C, Hamosh A. A new face and new challenges for Online Mendelian Inheritance in Man (OMIM) Hum Mutat. 2011;32:564–567. - PubMed
    1. Balasubramanian S, Xia Y, Freinkman E, Gerstein M. Sequence variation in G-protein-coupled receptors: analysis of single nucleotide polymorphisms. Nucleic acids research. 2005;33:1710–1721. - PMC - PubMed
    1. Braun P, Tasan M, Dreze M, Barrios-Rodiles M, Lemmens I, Yu H, Sahalie JM, Murray RR, Roncari L, De Smet AS, et al. An experimentally derived confidence score for binary protein-protein interactions. Nature methods. 2009;6:91–97. - PMC - PubMed

Publication types