. 2015 Apr 23;161(3):661-673.
doi: 10.1016/j.cell.2015.03.003.

Human gene-centered transcription factor networks for enhancers and disease variants

Affiliations

Human gene-centered transcription factor networks for enhancers and disease variants

Juan I Fuxman Bass et al. Cell. .

Abstract

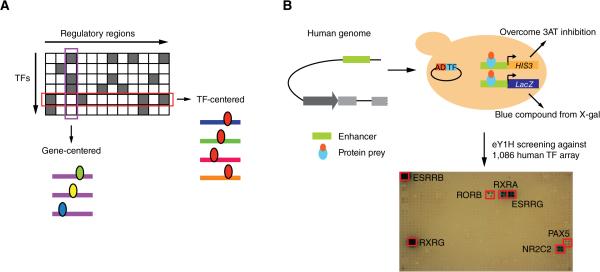
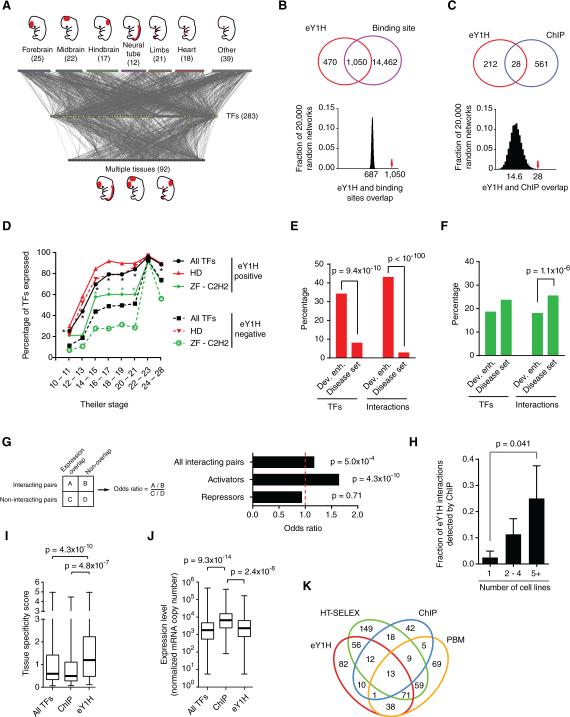
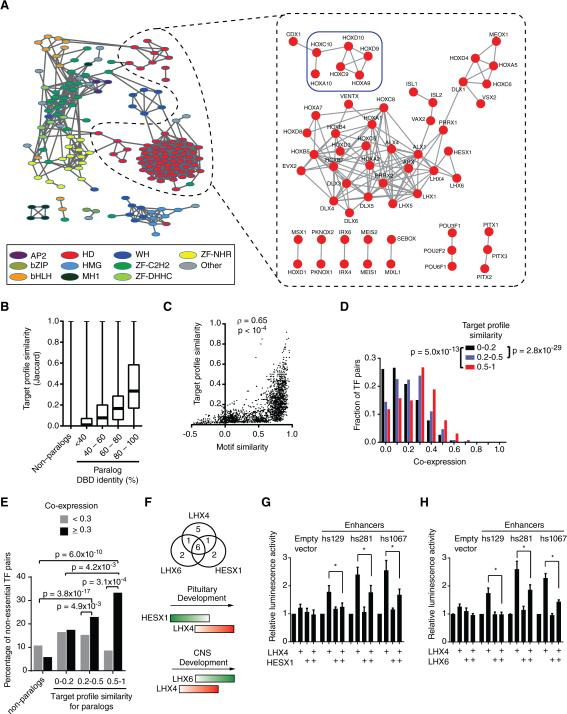
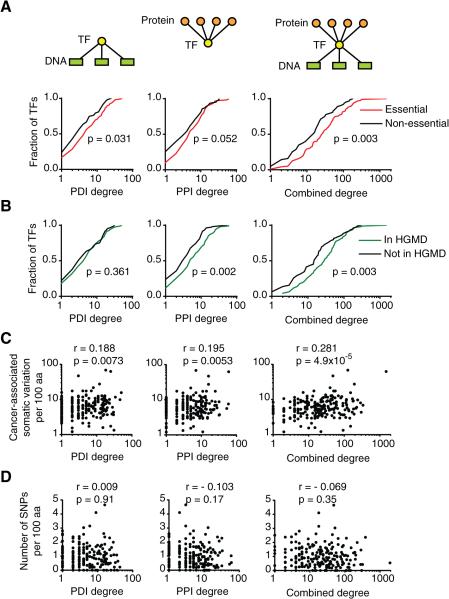
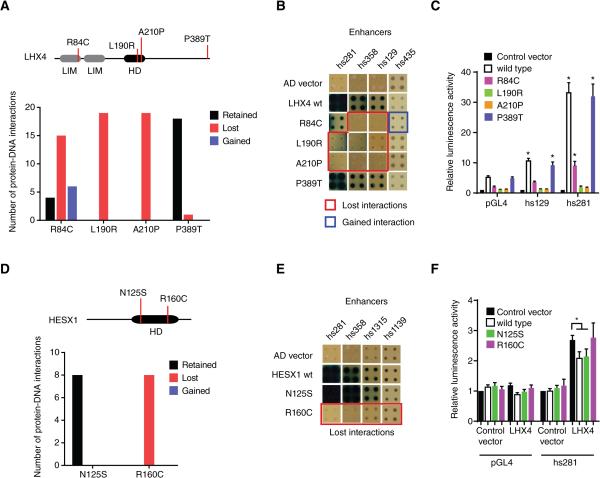
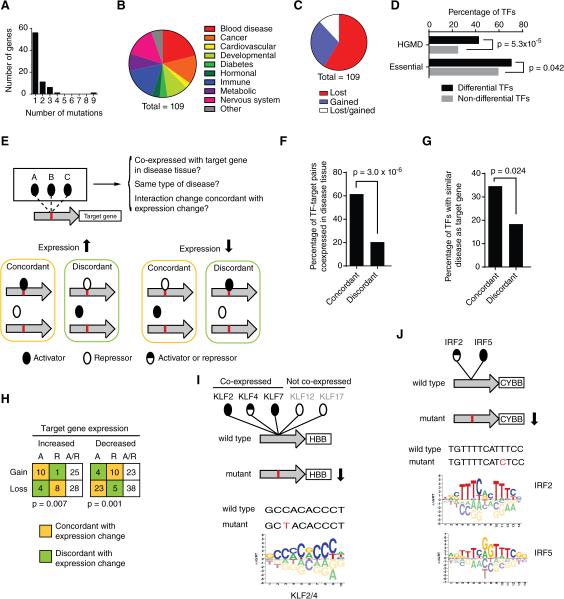
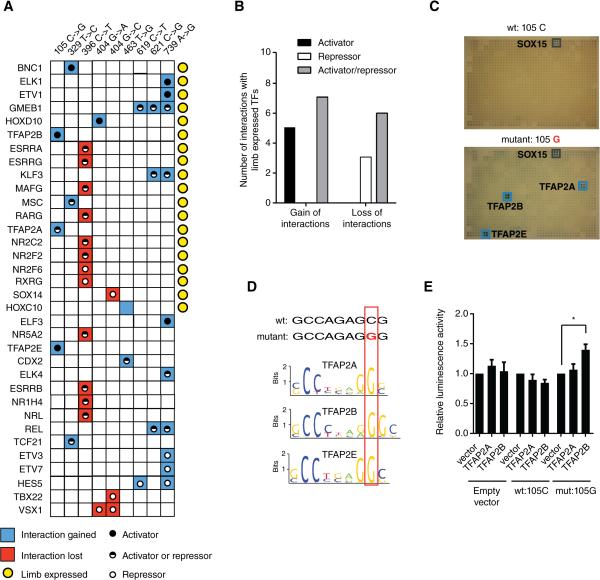
Gene regulatory networks (GRNs) comprising interactions between transcription factors (TFs) and regulatory loci control development and physiology. Numerous disease-associated mutations have been identified, the vast majority residing in non-coding regions of the genome. As current GRN mapping methods test one TF at a time and require the use of cells harboring the mutation(s) of interest, they are not suitable to identify TFs that bind to wild-type and mutant loci. Here, we use gene-centered yeast one-hybrid (eY1H) assays to interrogate binding of 1,086 human TFs to 246 enhancers, as well as to 109 non-coding disease mutations. We detect both loss and gain of TF interactions with mutant loci that are concordant with target gene expression changes. This work establishes eY1H assays as a powerful addition to the toolkit of mapping human GRNs and for the high-throughput characterization of genomic variants that are rapidly being identified by genome-wide association studies.


Figures

Figure 1
Figure 1. Gene-Centered Yeast One-Hybrid Assays
(A) Gene-centered versus TF-centered approaches for mapping protein-DNA interactions. Rectangles – regulatory regions; ellipses – TFs. (B) Cartoon of eY1H assays. A DNA sequence of interest is cloned upstream of two reporter genes (HIS3 and LacZ) and integrated into the yeast genome (i.e., each DNA bait is tested in duplicate by activation of each reporter in the same yeast nucleus). The resulting yeast DNA bait strain is mated to a collection yeast strains harboring TFs fused to the Gal4 activation domain (AD). Positive interactions are determined by the ability of the diploid yeast to grow in the absence of histidine and overcome the addition of 3AT a competitive inhibitor of the HIS3 enzyme, and turn blue in the presence of X-gal. Each TF is tested in quadruplicate. Red boxes show positive interactions.
Figure 2
Figure 2. A Human Gene-Centered TF-Enhancer Interaction Network
(A) The TF-enhancer interaction network comprises 2,230 interactions between 246 human developmental enhancers and 283 TFs. Enhancers that are active in a single tissue at day E11.5 (top nodes) or multiple tissues (bottom nodes) are connected to the TFs (middle yellow nodes) with which they interact. (B, C) eY1H interactions significantly overlap with the occurrence of known TF binding sites (B) and ChIP peaks (C). The Venn diagrams on the left illustrate the number of overlapping interactions. The eY1H network was randomized 20,000 times by edge switching (Martinez et al., 2008) and the overlap in each randomized network was calculated (right panel). The numbers under the histogram peaks indicate the average overlap in the randomized networks. The red arrows indicate the observed overlap in the real network. (D) Timing of expression during mouse development for homeodomain (HD) and ZF-C2H2 families. The fraction of TFs whose expression was detected at a particular Theiler Stage during development. *p < 0.01 by Fisher's exact test. (E, F) Percentage of TFs or interactions involving homeodomains (E) or ZF-C2H2 TFs (F) for two datasets. Statistical significance determined by proportion comparison test. (G) Overlap between enhancer activity and TF expression pattern. The fraction of TF-enhancer pairs that overlap in expression was compared between interacting and non-interacting pairs. The same analysis was performed for known activators and repressors. Statistical significance was determined using Fisher's exact test. (H) The fraction of eY1H interactions that were also detected by ChIP were partitioned based on the number of cell lines in which a particular TF was tested by ChIP. p = 0.041 by Mann-Whitney's U test. (I) Tissue specificity score for TFs detected by eY1H (n = 266), ChIP (n = 96) or all TFs present in the eY1H array (n = 896), based on their expression levels across 34 tissues (Ravasi et al., 2010). This score quantifies the departure of the observed TF expression pattern from the null distribution of uniform expression across all tissues, using relative entropy. Each box spans from the first to the third quartile, the horizontal lines inside the boxes indicate the median value and the whiskers indicate minimum and maximum values. Statistical significance determined by Mann-Whitney's U tests. (J) The maximum expression level across 34 tissues were obtained from (Ravasi et al., 2010) for each TF detected eY1H (n = 266), ChIP (n = 96) or all TFs present in the eY1H array (n = 896) are plotted. Each box spans from the first to the third quartile, the horizontal lines inside the boxes indicate the median value and the whiskers indicate minimum and maximum values. Statistical significance determined by Mann-Whitney's U tests. (K) Venn diagram depicting the overlap between TFs detected by eY1H and those detected by high-throughput SELEX (HT-SELEX), ChIP-seq and protein binding microarrays (PMBs). See also Figure S1, and Tables S1-S3.
Figure 3
Figure 3. TF Redundancy and Opposing Functions
(A) TF association network. Each node represents a TF and edges connect TFs with a target profile similarity ≥0.2 (left, all TF families) or ≥0.45 (right, homeodomains). TFs with degree ≥ 3 in the eY1H network are shown. Node color indicates TF families. Colored squares highlight sets of TFs discussed in main text. AP2 – activating protein 2; bZIP – Basic Leucine Zipper Domain; bHLH – basic helix-loop-helix; HD – homeodomain; HMG – High-Mobility Group; MH1 – Mad homology 1; WH – Winged Helix; ZF-C2H2 – Zinc Finger C2H2; ZF-DHHC – Zinc Finger DHHC; ZF-NHR – Nuclear Hormone Receptor. (B) Target profile similarity between TFs according to DNA binding domain identity. For each pair of TF paralogs with different DNA binding domain amino acid identity their target profile similarity was determined. Each box spans from the first to the third quartile, the horizontal lines inside the boxes indicate median value and the whiskers indicate minimum and maximum values. All pairwise comparisons between groups are significant (p < 0.01) by Dunn's multiple comparison test. (C) Correlation between motif similarity and target profile similarity. For each TF pair target profile similarity was plotted against their DNA motif similarity determined as the Pearson correlation coefficient of the Z-scores obtained for all possible 8-mers in protein binding microarrays. (D) Histogram of spatiotemporal co-expression for TF pairs according to their target profile similarity. Statistical significance determined by Mann-Whitney's U tests. (E) Redundancy between TFs. Each pair of TF paralogs was binned according to their target profile similarity and according their spatiotemporal co-expression. The percentage of TF-pairs for which both TF knockouts are viable was determined. Statistical significance was determined using the proportion comparison test. (F) Top: overlap between enhancers bound by LHX4, LHX6 and HESX1. Bottom: cartoon of developmental expression. Red – transcriptional activator; green – transcriptional repressor. (G) HESX1 represses LHX4-induced enhancer activity. HEK293T cells were co-transfected with enhancer constructs cloned upstream of a Firefly luciferase reporter vector, and the indicated TF expression vectors. After 48 hrs, cells were harvested and luciferase assays were performed. Relative luminescence activity is plotted as fold change compared to cells co-transfected with control vector expressing GFP. Experiments were performed three times in 3-6 replicates. Average relative luminescence activity ± SEM is plotted. *p<0.05 by Student's t-test. (H) LHX6 represses LHX4-induced enhancer activity. Experiments were performed three times in 3-6 replicates. Average relative luminescence activity ± SEM is plotted. *p<0.05 by Student's t-test. See also Figures S2 and S3.
Figure 4
Figure 4. Relationship Between TF Connectivity and Human Disease
(A) Cumulative distribution of TF protein-DNA interaction (PDI), protein-protein interaction (PPI) and combined degrees for essential and non-essential TFs. Combined TF degree is defined as the product of PPI and PDI degrees and represents the number of paths connecting the protein interactors of a TF with its DNA targets. Statistical significance determined by Mann-Whitney's U tests. (B) Cumulative distribution of TF degrees for TF reported as disease-associated genes in the Human Gene Mutation Databse (HGMD) and genes not reported in HGMD. Statistical significance determined by Mann-Whitney's U tests. (C) Correlation between TF degree and the number of protein-altering SNPs and short indel variants per 100 amino acids in cancer samples obtained from the Catalogue of Somatic mutations in Cancer (COSMIC). Statistical significance was determined using Pearson correlation coefficient. (D) Correlation between TF degree and the number of protein-altering SNPs and short indel variants per 100 amino acids in the 1000 genomes project. Statistical significance was determined using Pearson correlation coefficient.
Figure 5
Figure 5. Disease-Associated Coding Mutations in TFs
(A) Four missense mutations in LHX4 were tested for loss or gain of protein-DNA interactions in eY1H assays against 152 enhancers. The top panel depicts a cartoon of LHX4, including the location of the mutations and the homeodomain (HD) and LIM domains. The bottom panel shows the number of interactions retained (black bar), lost (red bar) or gained (blue blue) for each mutant compared to wild type interactions. (B) Examples of interactions lost and gained for LHX4 missense mutations. Each TF-enhancer combination was tested in quadruplicate three times. One random quadruplicate test is shown corresponding to four enhancers. Red squares – interaction lost with TF mutant; blue square – retained interaction with TF mutant; AD vector – empty prey vector. (C) Transcriptional activation mediated by wild type and mutant LHX4 alleles. HEK293T cells were co-transfected with enhancer constructs cloned upstream of a Firefly luciferase reporter vector, and the indicated TF expression vectors. Relative luminescence activity is plotted as fold change compared to cells co-transfected with empty expression vector. Experiments were performed four times with three replicates each. Average relative luminescence activity ± SEM is plotted. *p<0.05 vs empty expression vector by Student's t-test. (D) Two missense mutations in HESX1 were tested for changes in protein-DNA interactions as in (A). (E) Examples of interactions lost for HESX1 missense mutations. (F) Repression of LHX4-induced enhancer activity by wild type and mutant HESX1 alleles. HEK293T cells were co-transfected with enhancer constructs cloned upstream of a Firefly luciferase reporter vector, and the indicated TF expression vectors. Relative luminescence activity is plotted as fold change compared to cells co-transfected with control vector expressing GFP. Experiments were performed six times with three replicates each. Average relative luminescence activity ± SEM is plotted. *p<0.05 by Student's t-test. See also Table S4.
Figure 6
Figure 6. Disease-Associated Non-Coding Mutations
(A) Number of mutations per gene for which differential TF interactions were detected by eY1H assays. (B) Distribution of diseases associated with tested non-coding mutations. (C) Distribution of mutations that result in loss of interactions, gain of interaction or both. (D) Fraction of essential or disease-associated TFs (per HGMD) differentially interacting with non-coding mutations (differential TFs) and the remaining TFs in the eY1H human TF collection (non-differential TFs). Statistical significance determined by proportion comparison test. (E) Cartoon depicting data integration used to obtain a supporting evidence score for differential eY1H interactions (see Extended Experimental Procedures). (F, G) Percentage of differential TF-target gene pairs in which the TF is co-expressed with the target gene in the disease tissue (F) or is associated with a similar disease or mouse phenotype (G) for interaction changes concordant or discordant with target gene expression changes. Statistical significance determined by proportion comparison test. (H) Number of interactions lost or gained involving activators (A), repressors (R) or bifunctional TFs (A/R, activators and repressors) for mutations that cause increased or decreased target gene expression. Only interactions in which the TF is co-expressed with the target gene in disease relevant tissue, or associated with a similar disease or phenotype are shown. Statistical significance was determined using Fisher's exact test. (I, J) Examples of differential eY1H interactions with HBB promoter (I) and the promoter of the CYBB gene (J). Disease-associated mutations are indicated in red. Reported TF binding site logos are shown (Weirauch et al., 2014). See also Tables S5 and S6.
Figure 7
Figure 7. Mutations in the Limb SHH Enhancer
(A) Summary of interactions lost (red) or gained (blue) for different mutations in the ZRS enhancer of sonic hedgehog. Yellow circles – TFs expressed in limb during development; black dots – activators; white dots – repressors; black/white dots – TF that can be both activators or repressors. (B) Number of interaction changes occurring with limb-expressed activators, repressors or bifunctional TFs (activators/repressors) for interactions gained or lost in ZRS enhancer mutations. p = 0.018 by Fisher's exact test. (C) Gain of interactions detected by eY1H assays in the 105C→G mutant in the ZRS enhancer of sonic hedgehog. Blue boxes indicate positive interactions. (D) DNA binding motifs for TFAP2A, TFAP2B and TFAP2E discriminate wild type and mutant enhancer sequences. (E) HEK293T cells were co-transfected with enhancer fragments containing wild type (105C) or mutant (105G) sequences cloned upstream of a Firefly luciferase reporter vector, and the indicated TF expression vectors. Relative luminescence activity is plotted as fold change compared to cells co-transfected with control vector expressing GFP. Experiments were performed four times in 3-6 replicates. Average relative luminescence activity ± SEM is plotted. *p<0.05 by Student's t-test. See also Table S5.

References

    1. Alhashem YN, Vinjamur DS, Basu M, Klingmuller U, Gaensler KM, Lloyd JA. Transcription factors KLF1 and KLF2 positively regulate embryonic and fetal beta-globin genes through direct promoter binding. The Journal of biological chemistry. 2011;286:24819–24827. - PMC - PubMed
    1. Arda HE, Taubert S, Conine C, Tsuda B, Van Gilst MR, Sequerra R, Doucette-Stam L, Yamamoto KR, Walhout AJM. Functional modularity of nuclear hormone receptors in a C. elegans gene regulatory network. Molecular Systems Biology. 2010;6:367. - PMC - PubMed
    1. Arda HE, Walhout AJM. Gene-centered regulatory networks. Briefings in functional genomics and proteomics. 2009 doi:10.1093/elp049. - PMC - PubMed
    1. Badis G, Berger MF, Philippakis AA, Talukder S, Gehrke AR, Jaeger SA, Chan ET, Metzler G, Vedenko A, Chen X, et al. Diversity and complexity in DNA recognition by transcription factors. Science. 2009;324:1720–1723. - PMC - PubMed
    1. Brady S, Zhang L, Megraw M, Martinez NJ, Jiang E, Yi CS, Liu W, Zeng A, Taylor-Teeples M, Kim D, et al. A stele-enriched gene regulatory network in the Arabidopsis root. Mol Syst Biol. 2011;7:459. - PMC - PubMed

Publication types

Substances