. 2015 Jun 12;290(24):15279-91.
doi: 10.1074/jbc.M114.628610. Epub 2015 Apr 24.

The V4 and V5 Variable Loops of HIV-1 Envelope Glycoprotein Are Tolerant to Insertion of Green Fluorescent Protein and Are Useful Targets for Labeling

Affiliations

The V4 and V5 Variable Loops of HIV-1 Envelope Glycoprotein Are Tolerant to Insertion of Green Fluorescent Protein and Are Useful Targets for Labeling

Shuhei Nakane et al. J Biol Chem. .

Abstract

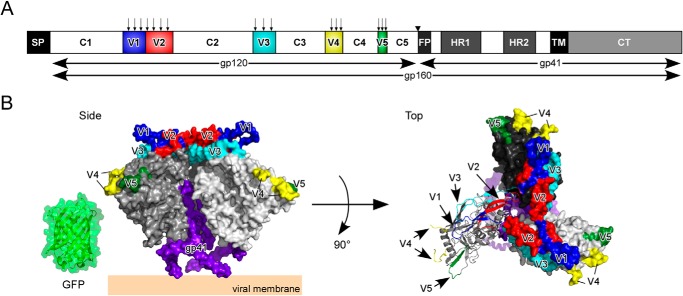
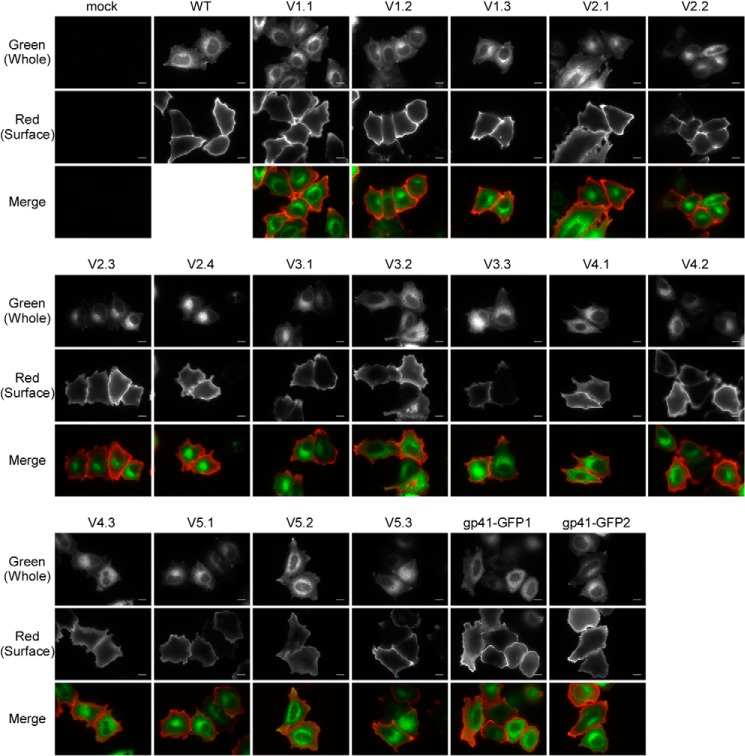
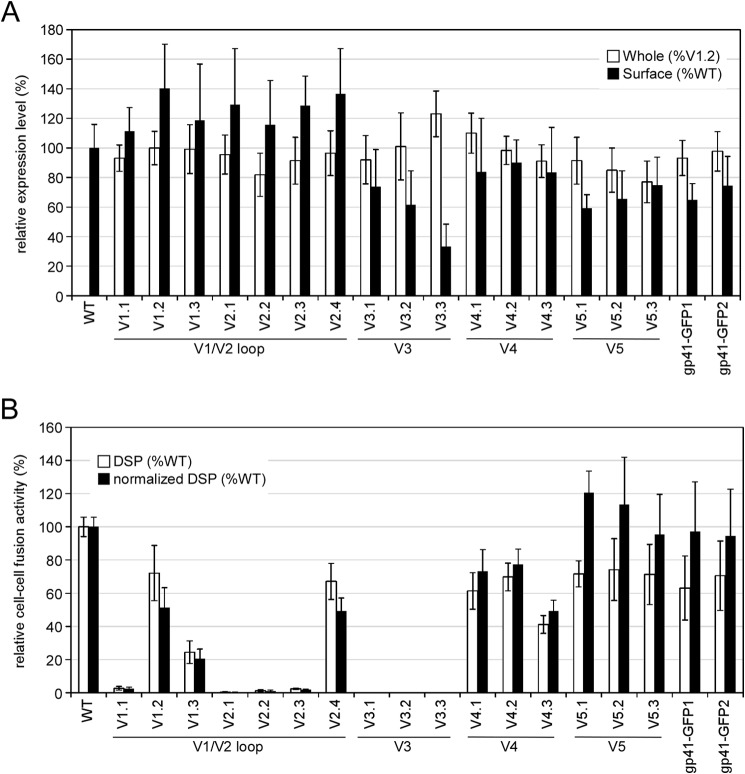
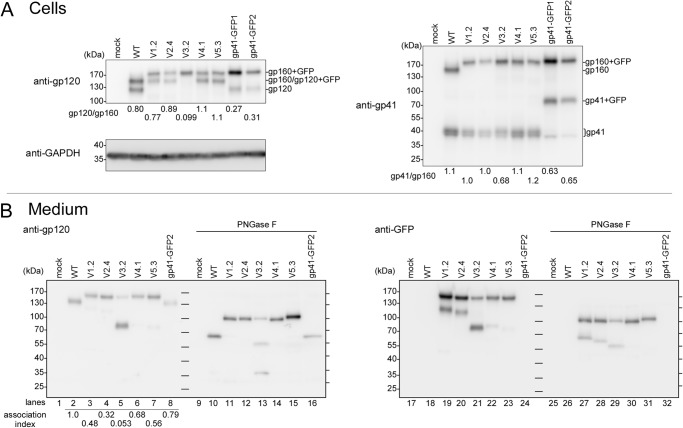
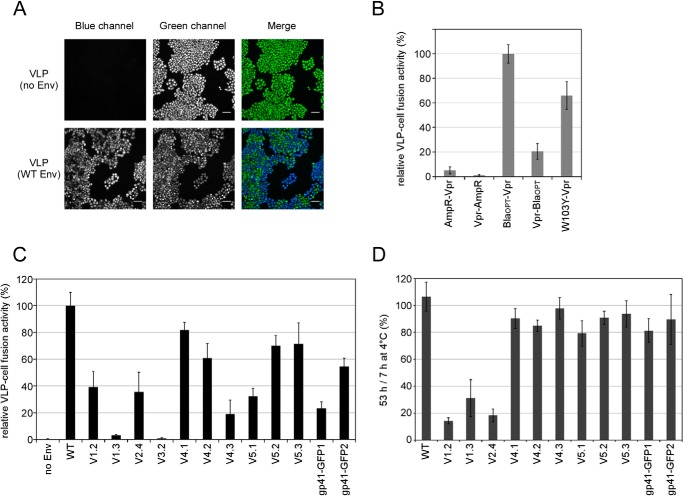
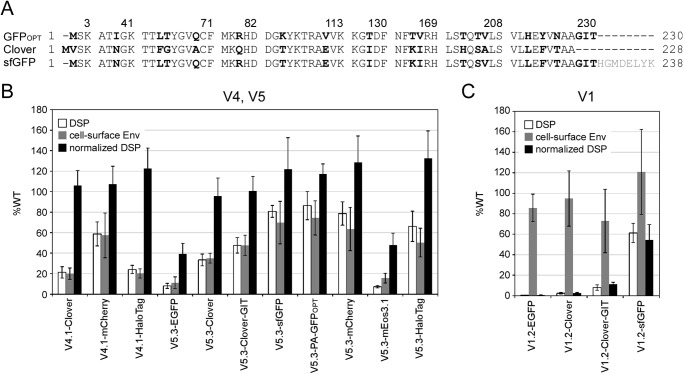
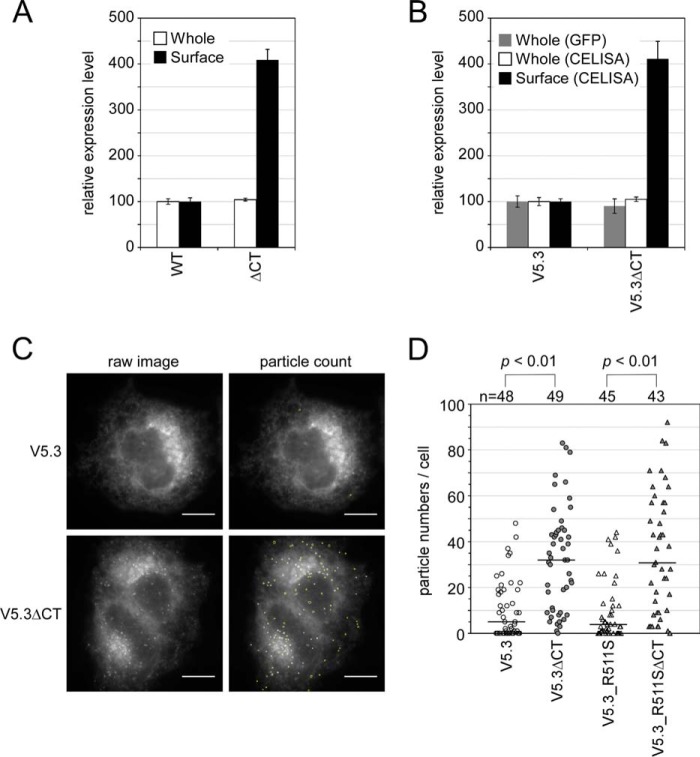
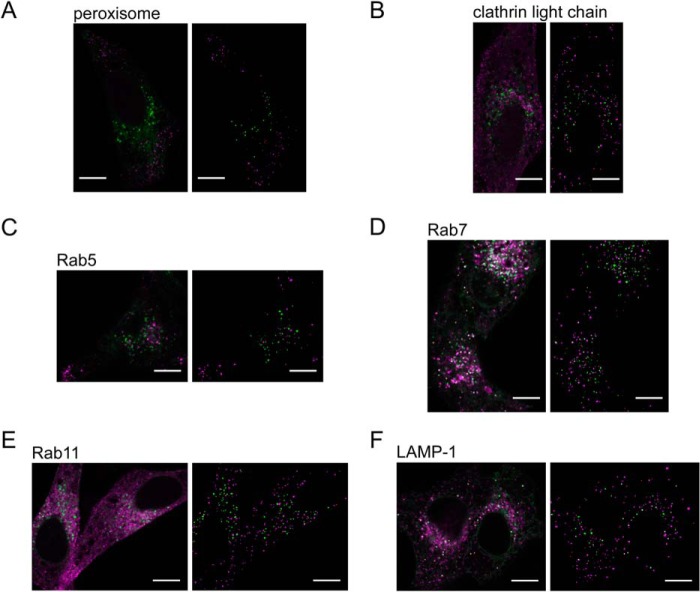
The mature human immunodeficiency virus type 1 (HIV-1) envelope glycoprotein (Env) comprises the non-covalently associated gp120 and gp41 subunits generated from the gp160 precursor. Recent structural analyses have provided quaternary structural models for gp120/gp41 trimers, including the variable loops (V1-V5) of gp120. In these models, the V3 loop is located under V1/V2 at the apical center of the Env trimer, and the V4 and V5 loops project outward from the trimeric protomers. In addition, the V4 and V5 loops are predicted to have less movement upon receptor binding during membrane fusion events. We performed insertional mutagenesis using a GFP variant, GFPOPT, placed into the variable loops of HXB2 gp120. This allowed us to evaluate the current structural models and to simultaneously generate a GFP-tagged HIV-1 Env, which was useful for image analyses. All GFP-inserted mutants showed similar levels of whole-cell expression, although certain mutants, particularly V3 mutants, showed lower levels of cell surface expression. Functional evaluation of their fusogenicities in cell-cell and virus-like particle-cell fusion assays revealed that V3 was the most sensitive to the insertion and that the V1/V2 loops were less sensitive than V3. The V4 and V5 loops were the most tolerant to insertion, and certain tag proteins other than GFPOPT could also be inserted without functional consequences. Our results support the current structural models and provide a GFPOPT-tagged Env construct for imaging studies.

Keywords: envelope glycoprotein; human immunodeficiency virus (HIV); imaging; membrane fusion; mutagenesis; virus entry.


Figures

FIGURE 1.
FIGURE 1.
GFPOPT-Env constructs and a prefusion Env structural model. A, schematic representation of HIV-1 Env domain organization: SP, signal peptide; C1–C5, constant domains; V1–V5, variable loops; FP, fusion peptide; HR, heptad repeat; TM, transmembrane domain; CT, cytoplasmic tail. The arrows above V1–V5 indicate GFPOPT insertion sites. The inverted triangle between C5 and FP indicates the furin-like protease-processing site. The width of each box is proportional to the amino acid length of each domain for the HXB2 strain. B, the structural model of trimeric gp140 (Protein Data Bank code 4NCO) (12). Three protomers of gp120 are shown in white, gray, and black. One protomer is shown in ribbon representation in the top view, and the others are shown in surface representation. The V1, V2, V3, V4, and V5 loops are colored in blue, red, cyan, yellow, and green, respectively. The GFP structure (Protein Data Bank code 2Y0G) (52) is shown on the same scale. The model was made using PyMOL (The PyMOL Molecular Graphics System, Version 1.4.1, Schrödinger, LLC, New York, NY).
FIGURE 2.
FIGURE 2.
Whole-cell and cell surface distributions of GFPOPT-Env analyzed by fluorescence microscopy. HeLa cells were transiently transfected with each construct, and fluorescence was detected using a 100× objective lens. The whole-cell distributions of GFPOPT-Env were determined by measuring the fluorescence signals derived from the inserted GFPOPT. The surface expression of GFPOPT-Env was observed by indirect immunofluorescence without permeabilization. Indirect immunofluorescence was performed with or without permeabilization for the detection of whole-cell or surface Env expression, respectively. The scale bar indicates 10 μm.
FIGURE 3.
FIGURE 3.
Expression profiles and cell-cell fusion activities of GFPOPT-Env insertion mutants. A, whole-cell and cell surface expression levels of Env in transiently transfected 293MSR cells. The whole-cell expression levels of GFPOPT-Env were quantified by imaging cytometry (IN Cell Analyzer 1000) using GFP signals and are shown as percent V1.2 expression (white bars). The surface expression levels of Env were determined by CELISA and are shown as percent WT expression (black bars). The same plates were used for both imaging cytometry and CELISA. B, cell-cell fusion activities of the mutants were examined by DSP assays. The relative fusion activities based on RL activity are shown by white bars. The normalized cell-cell fusion activities by surface expression levels of Env are shown by black bars. Data represent the means ± S.D. for more than nine wells from at least three independent experiments. Error bars represent S.D.
FIGURE 4.
FIGURE 4.
Western blotting of Env variants in transfected cells and culture medium. A, protein profiles of several representative Env proteins in transfected 293FT cells. The molecular masses of gp160 (160 kDa), gp120 (120 kDa), and gp41 (41 kDa) were increased to 190, 150, and 70 kDa, respectively, when GFPOPT was inserted or attached to the native protein. The ratios of gp120:gp160 and gp41:gp160 are shown below each lane. Endogenous GAPDH was used as a loading control. B, immunoprecipitated gp120 from culture medium. Half of each sample was treated with PNGase F to remove N-linked glycans. The ladder lines in the middle and on the right side of each blot represent the positions of molecular mass markers. The predicted molecular masses of gp120 and gp120 + GFP (150 kDa) after PNGase F treatment are 58 and 84 kDa, respectively. The association index was calculated as follows: ([mutant gp120]cell × [wild-type gp120]supernatant)/([mutant gp120]supernatant × [wild-type gp120]cell) (53). Proteins were analyzed by 5–15% SDS-PAGE and Western blotting with the indicated primary antibodies.
FIGURE 5.
FIGURE 5.
VLP-cell fusion activity of GFPOPT-Env constructs. A, representative cell images from a BlaM assay. MAGI cells were incubated with VLPs bearing WT Env and β-lactamase-Vpr fusion proteins and compared with cells incubated with VLPs without Env. Cells were loaded with CCF4 dye and the β-lactamase substrate and exhibited green fluorescence when they were excited with light at 400 nm (green channel). After VLP-cell fusion, the dye was cleaved by β-lactamase and fluoresced blue (blue channel). Images for the same display range of pixel levels for each blue and green channel are shown. The scale bar indicates 100 μm. B, optimization of the BlaM assay. VLPs bearing WT Env and each β-lactamase-Vpr were compared in the BlaM assay. After VLP fusion, cells were incubated with CCF4 dyes at 15 °C for 13 h. The BlaOPT-Vpr construct showed the highest assay sensitivity and was used in the other VLP-cell fusion assays. Data represent the means ± S.D. for 11 wells from four independent experiments. C, VLP-cell fusion activity of GFPOPT-Env as determined by the BlaM assay. Equivalent quantities of VLPs (5 ng of p24) were used for the assay. Dyes were developed at 4 °C overnight. Data represent the means ± S.D. for at least six wells from at least two independent experiments. D, examination of the effect of GFPOPT-Env stability on VLPs. VLPs were incubated at 4 °C for 7 or 53 h, and VLP-cell fusion activities were compared based on the observed blue:green ratios in the BlaM assay. Data represent the means ± S.D. for at least five wells from two independent experiments. Error bars represent S.D.
FIGURE 6.
FIGURE 6.
Tolerance of the V1, V4, and V5 loops for foreign protein insertion. A, amino acid sequence alignment among GFP variants. Only the alignments around the nonidentical amino acid residues (boldface) are shown. The numbers above the alignments are from GFPOPT. The sfGFP used in this study carried a deletion of 8 amino acid residues at the C terminus (indicated as gray letters). B and C, several foreign proteins were inserted into the V4, V5 (B), or V1 (C) loop of gp120. The relative cell-cell fusion activities measured by the DSP assay, cell surface expression levels measured by the CELISA, and normalized cell-cell fusion activities are shown by white, gray, and black bars, respectively. Clover-GIT had an additional Gly-Ile-Thr sequence at the C terminus. Data represent the means ± S.D. for at least seven wells from two independent experiments. Error bars represent S.D.
FIGURE 7.
FIGURE 7.
Difference of intracellular distributions between Env proteins with or without CTs in HeLa cells. A and B, expression levels of WT Env and ΔCT (A) or V5.3 and its ΔCT variant (V5.3ΔCT) (B) in the HXB-2 strain were compared using CELISA with (whole) or without (surface) permeabilization. GFP levels quantified by imaging cytometry were also used to estimate the whole-cell expression levels of the GFPOPT-Env constructs. Data represent the means ± S.D. for at least eight wells from at least two independent experiments. C, the Env distributions were examined by fluorescence microscopy using GFP fluorescence and a 100× objective lens. The observed Env particles were semiautomatically counted using ImageJ software and are outlined in yellow. The scale bar indicates 10 μm. D, comparison of the numbers of GFPOPT-Env particles per cell image. The numbers above the graph indicate the number of examined cells from two independent experiments. Statistical analysis was performed using Welch's t test. Error bars represent S.D.
FIGURE 8.
FIGURE 8.
Colocalization analysis between V5. 3ΔCT vesicles and subcellular markers. A–F, HeLa cells were co-transfected with the V5.3ΔCT expression plasmid and each subcellular marker and observed by confocal microscopy. Merged images of V5.3ΔCT (green) with each subcellular marker (magenta) are shown on the left. The colocalized pixels are shown in white with yellow outlines. Extracted vesicle images using ImageJ software are shown in the binary images on the right. The scale bar indicates 10 μm.

References

    1. Moulard M., Decroly E. (2000) Maturation of HIV envelope glycoprotein precursors by cellular endoproteases. Biochim. Biophys. Acta 1469, 121–132 - PubMed
    1. Curlin M. E., Zioni R., Hawes S. E., Liu Y., Deng W., Gottlieb G. S., Zhu T., Mullins J. I. (2010) HIV-1 envelope subregion length variation during disease progression. PLoS Pathog. 6, e1001228. - PMC - PubMed
    1. Zolla-Pazner S., Cardozo T. (2010) Structure-function relationships of HIV-1 envelope sequence-variable regions refocus vaccine design. Nat. Rev. Immunol. 10, 527–535 - PMC - PubMed
    1. Yuan T., Li J., Zhang M. Y. (2013) HIV-1 envelope glycoprotein variable loops are indispensable for envelope structural integrity and virus entry. PLoS One 8, e69789. - PMC - PubMed
    1. Wyatt R., Sullivan N., Thali M., Repke H., Ho D., Robinson J., Posner M., Sodroski J. (1993) Functional and immunologic characterization of human immunodeficiency virus type 1 envelope glycoproteins containing deletions of the major variable regions. J. Virol. 67, 4557–4565 - PMC - PubMed

Publication types

MeSH terms

Substances

LinkOut - more resources