. 2015 Apr 24:2015:bau122.
doi: 10.1093/database/bau122. Print 2015.

ProtoBug: functional families from the complete proteomes of insects

Affiliations

ProtoBug: functional families from the complete proteomes of insects

Nadav Rappoport et al. Database (Oxford). .

Abstract

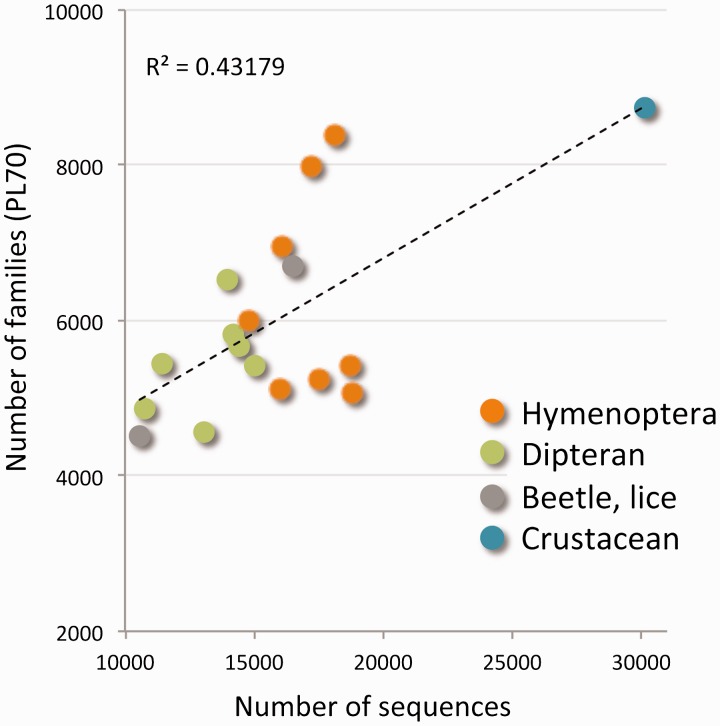
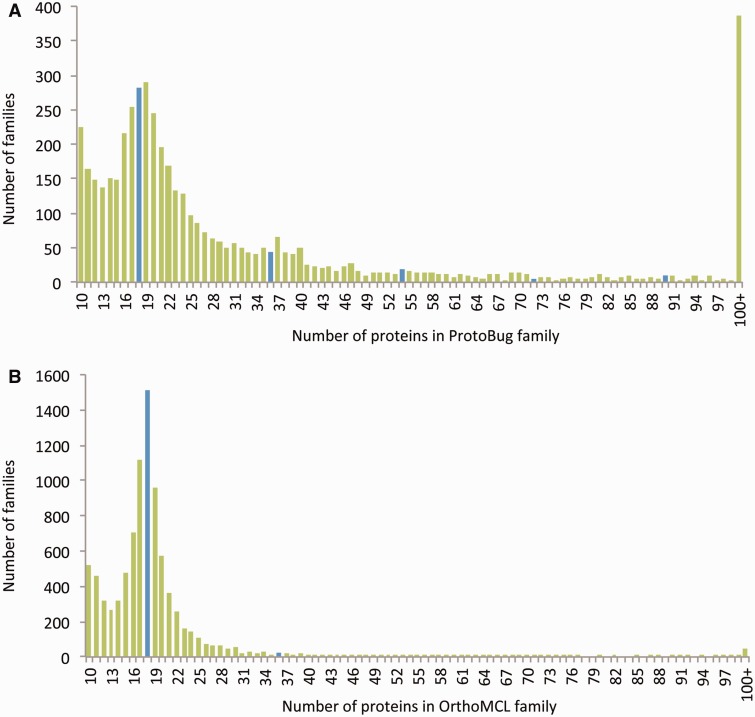
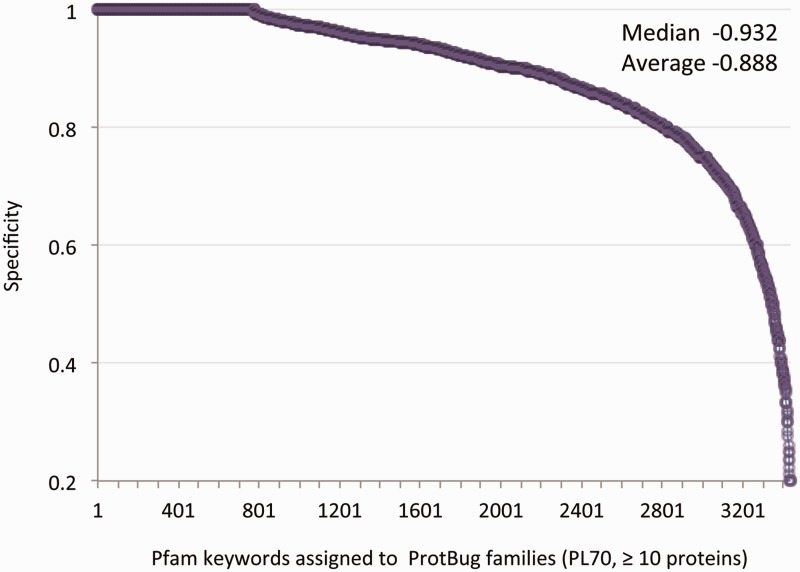
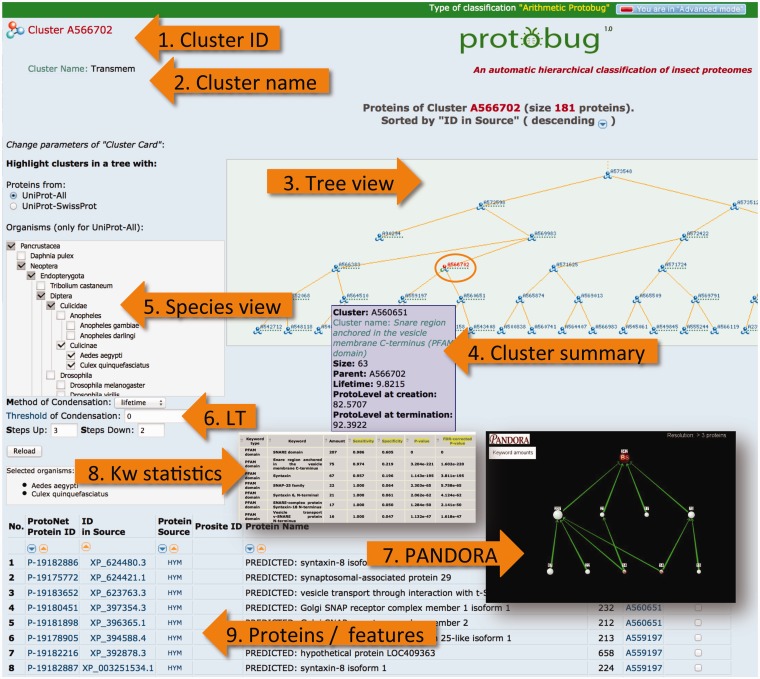
ProtoBug (http://www.protobug.cs.huji.ac.il) is a database and resource of protein families in Arthropod genomes. ProtoBug platform presents the relatedness of complete proteomes from 17 insects as well as a proteome of the crustacean, Daphnia pulex. The represented proteomes from insects include louse, bee, beetle, ants, flies and mosquitoes. Based on an unsupervised clustering method, protein sequences were clustered into a hierarchical tree, called ProtoBug. ProtoBug covers about 300,000 sequences that are partitioned to families. At the default setting, all sequences are partitioned to ∼20,000 families (excluding singletons). From the species perspective, each of the 18 analysed proteomes is composed of 5000-8000 families. In the regime of the advanced operational mode, the ProtoBug provides rich navigation capabilities for touring the hierarchy of the families at any selected resolution. A proteome viewer shows the composition of sequences from any of the 18 analysed proteomes. Using functional annotation from an expert system (Pfam) we assigned domains, families and repeats by 4400 keywords that cover 73% of the sequences. A strict inference protocol is applied for expanding the functional knowledge. Consequently, secured annotations were associated with 81% of the proteins, and with 70% of the families (≥10 proteins each). ProtoBug is a database and webtool with rich visualization and navigation tools. The properties of each family in relation to other families in the ProtoBug tree, and in view of the taxonomy composition are reported. Furthermore, the user can paste its own sequences to find relatedness to any of the ProtoBug families. The database and the navigation tools are the basis for functional discoveries that span 350 million years of evolution of Arthropods. ProtoBug is available with no restriction at: www.protobug.cs.huji.ac.il. Database URL: www.protobug.cs.huji.ac.il


Figures

Figure 1.
Figure 1.
Protein families of the Arthropods complete proteomes. The scatter plot shows the number of protein families from the ProtoBug tree with respect to the number of raw sequences for each of the 18 analysed proteomes. The families are disjoint clusters from the partition at PL70. Although some organisms appear in >8000 families, most organisms participate in 5000–5500 protein families. The organisms are colored by the main clades. The extreme value of ∼30 000 proteins belongs to D. pulex.
Figure 2.
Figure 2.
Size distribution of the protein families from Arthropods-complete proteomes. The families listed are based on all 18 complete proteomes. The protein families are ranked by their sizes according to ProtoBug clusters (A) and OrthoMCL (B) algorithms. The blue bars shows the families of size 18 and the multiplications (i.e. 36, 54, etc.). Note a clear difference in cluster size distribution between the two clustering modes. Specifically, there are ∼400 families with more than 100 proteins among the ProtoBug family collection.
Figure 3.
Figure 3.
Specificity for all annotated families. Each data-point represents a unique annotation from a set of Pfam keywords. There are 3437 Pfam keywords that are associated with 4504 families (>10 proteins each). The annotation inference is restricted to a minimal specificity of 0.2. The average and median specificity are shown.
Figure 4.
Figure 4.
Quantitative attributes of ProtoBug families. Each panel summarizes the statistics for families according to annotation purity. All ProtoBug PL70 families (4504 with ≥10 proteins each) were ranked by the CS and the top and bottom 800 families (18%) are defined as group A and B, respectively. The statistics is presented as Plotbox with the bottom and top of the box shows the first and third quartiles, and the line inside the box shows the median. The whiskers cover the extreme 5% of the quartiles and the outliers are indicated by the dots. Note that the scale for some of the attributes is logarithmic.
Figure 5.
Figure 5.
A keyword-centric view for ProtoBug families according to CS and the number of proteins. Representatives of Pfam keywords are: (A) Cytochrome P450; (B) Ligand-gated ion channel; (C) 7tm odorant receptor; (D) Cadherin domain. Each plot shows the 100 clusters with the highest CSs versus the cluster size (log scale). In most instances the PL70 family and the maximal CS for this keywords coincides (orange symbol in A–D). Insets for C and D show a zoom for the top 15 clusters. For all the keywords, a sharp drop in CS and a substantial increase in the size of the family mark the deterioration in the cluster quality towards the root of the Protobug tree.
Figure 6.
Figure 6.
ProtoBug cluster page and several viewers from the simplified and advanced modes. The advanced mode is selected at the top right corner of the page. The cluster A566702 includes 181 proteins. A cluster is uniquely identified by its ID (1). Cluster name (2) is provided for clusters that show a minimal degree of consistency with the different resources for keyword (Pfam, Phobius, Clantox and Taxonomy). Tree viewer (3) is sensitive to the selection of the species (5) and the compression of the tree according to the LT (6). Family annotation is analysed using PANDORA viewer (7) and statistical significance (8). The proteins of the clusters are listed (9) with their immediate attributes (length, source and association to their child clusters).

References

    1. Weinstock G.M., Robinson G.E., Gibbs R.A., et al. . (2006) Insights into social insects from the genome of the honeybee Apis mellifera. Nature, 443, 931–949. - PMC - PubMed
    1. Wurm Y., Wang J., Riba-Grognuz O., et al. . (2011) The genome of the fire ant Solenopsis invicta. Proc. Natl Acad. Sci. USA, 108, 5679–5684. - PMC - PubMed
    1. Brady S.G., Schultz T.R., Fisher B.L., et al. . (2006) Evaluating alternative hypotheses for the early evolution and diversification of ants. Proc. Natl Acad. Sci. USA, 103, 18172–18177. - PMC - PubMed
    1. Loewenstein Y., Raimondo D., Redfern O.C., et al. . (2009) Protein function annotation by homology-based inference. Genome Biol., 10, 207. - PMC - PubMed
    1. Magrane M., Consortium U. (2011) UniProt Knowledgebase: a hub of integrated protein data. Database, 2011, bar009. - PMC - PubMed

Publication types

LinkOut - more resources