. 2015 Jun;168(2):735-51.
doi: 10.1104/pp.15.00486. Epub 2015 Apr 24.

Environmental control of branching in petunia

Affiliations

Environmental control of branching in petunia

Revel S M Drummond et al. Plant Physiol. 2015 Jun.

Abstract

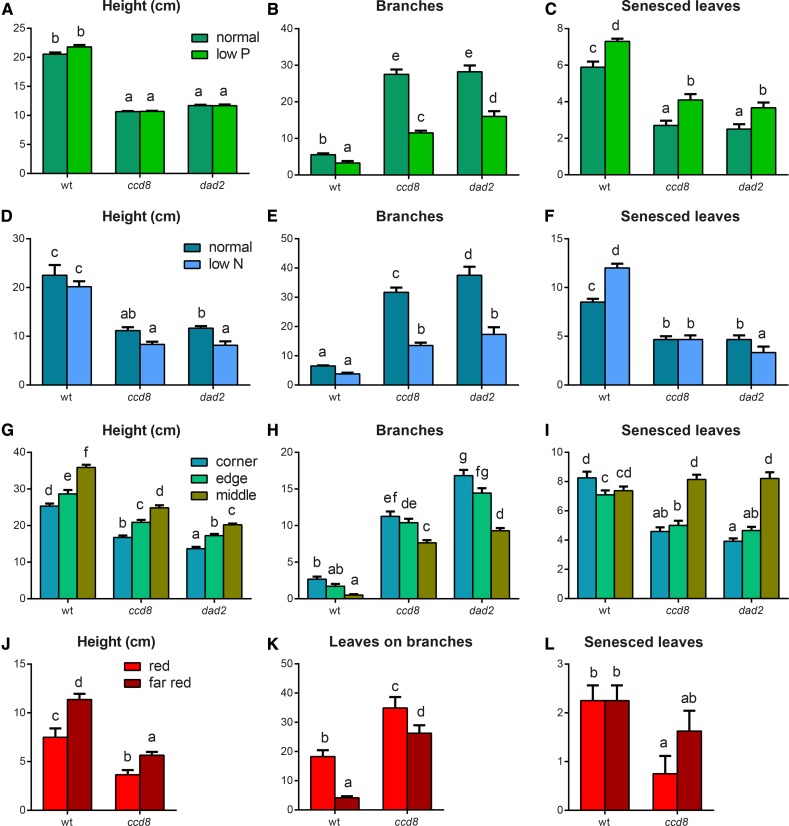
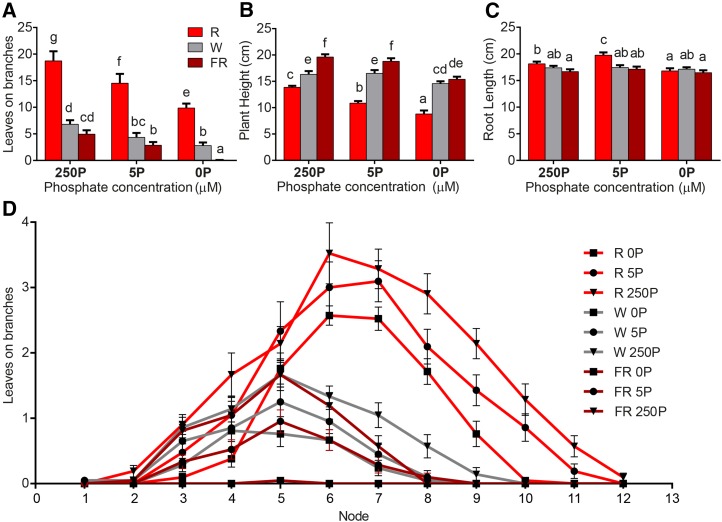
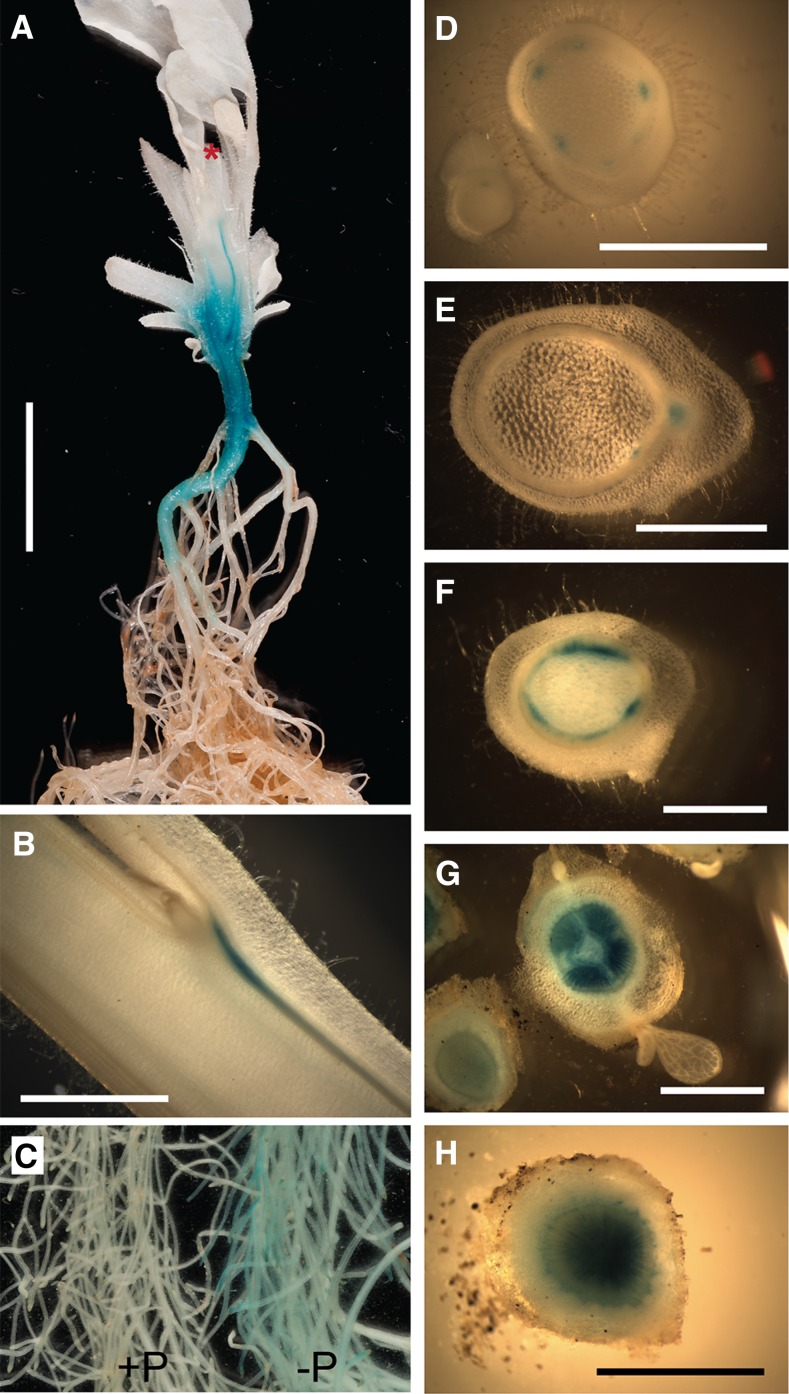
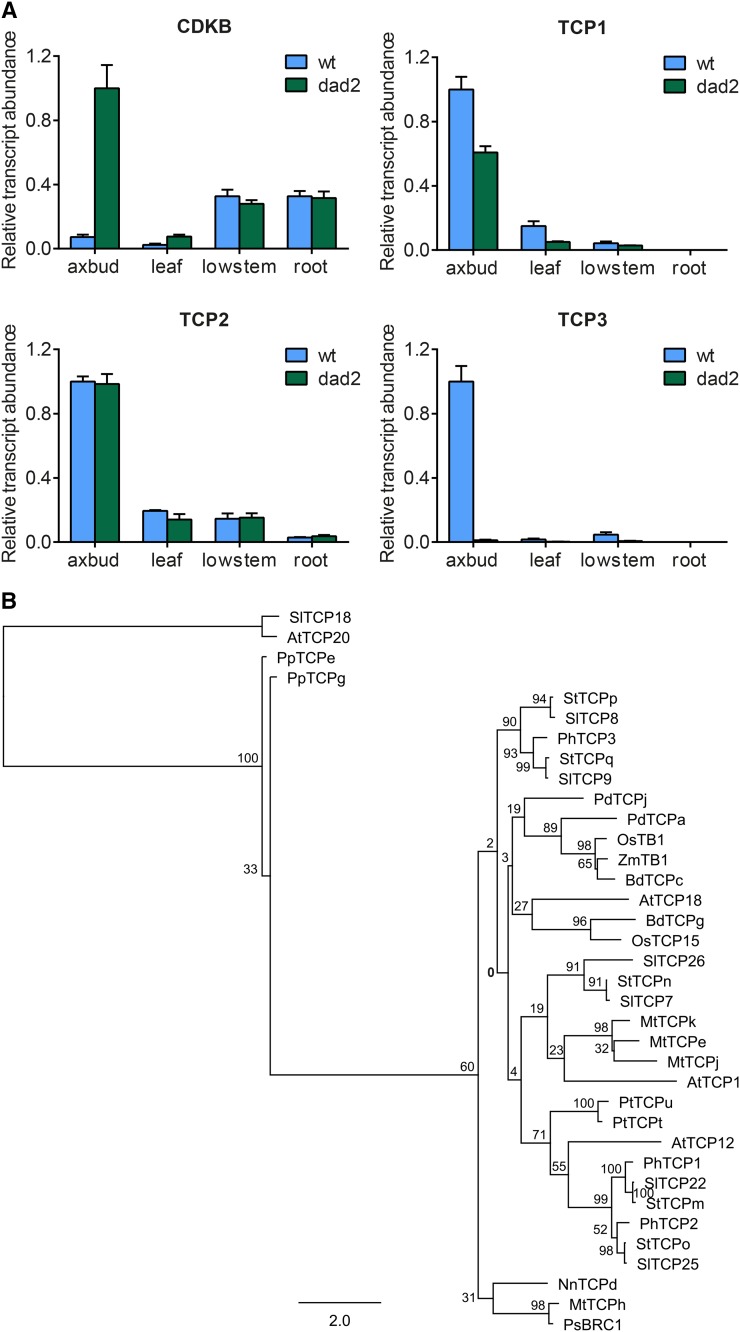
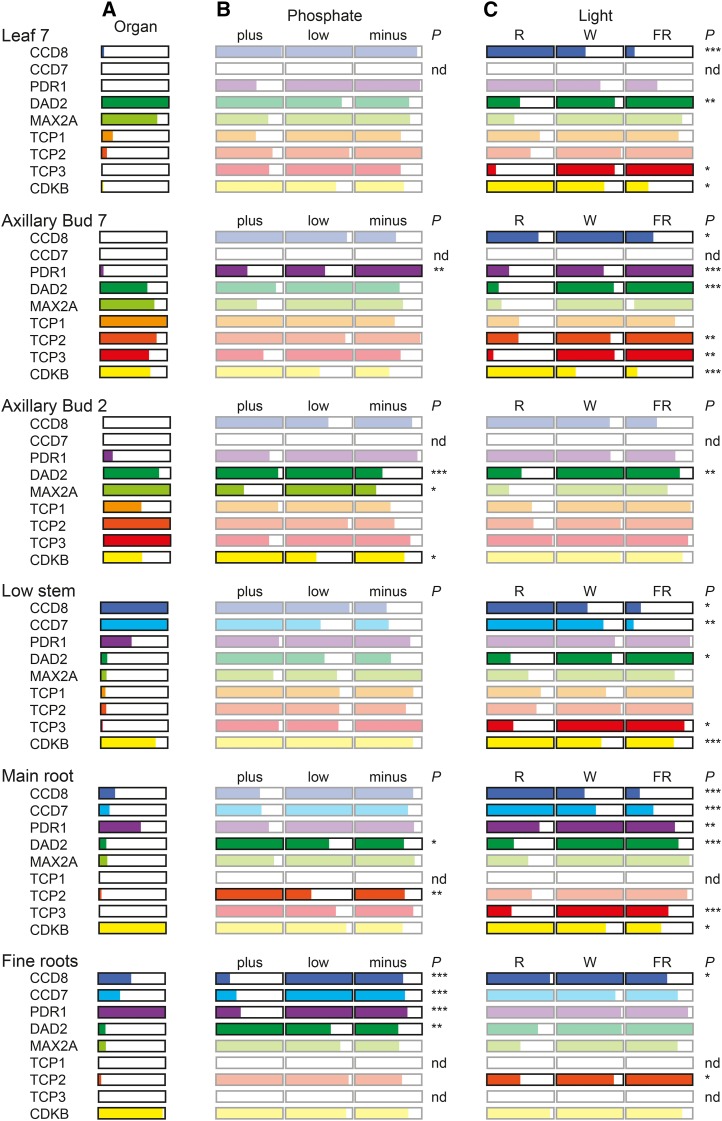
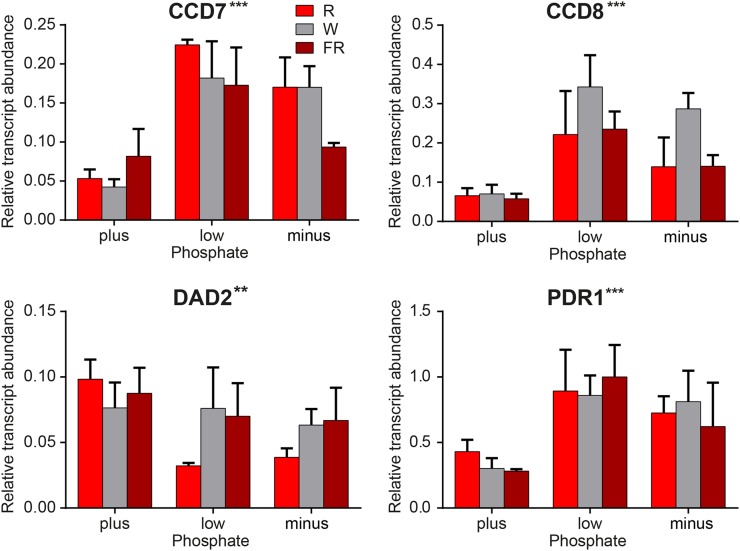
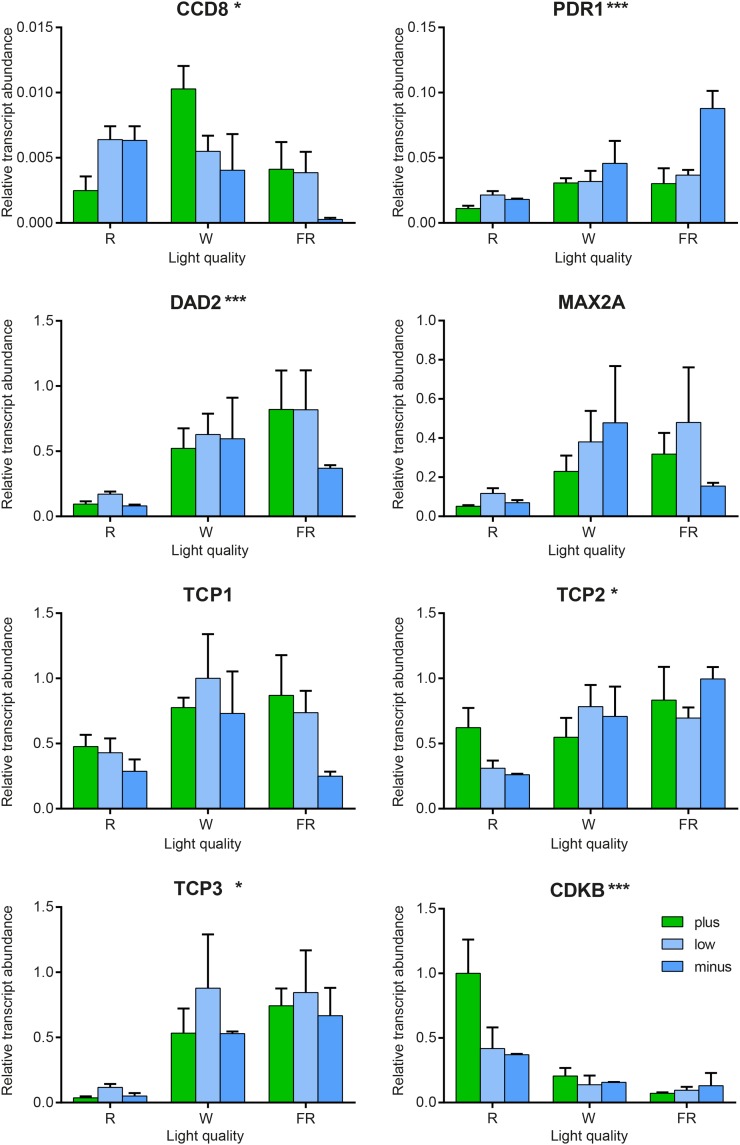
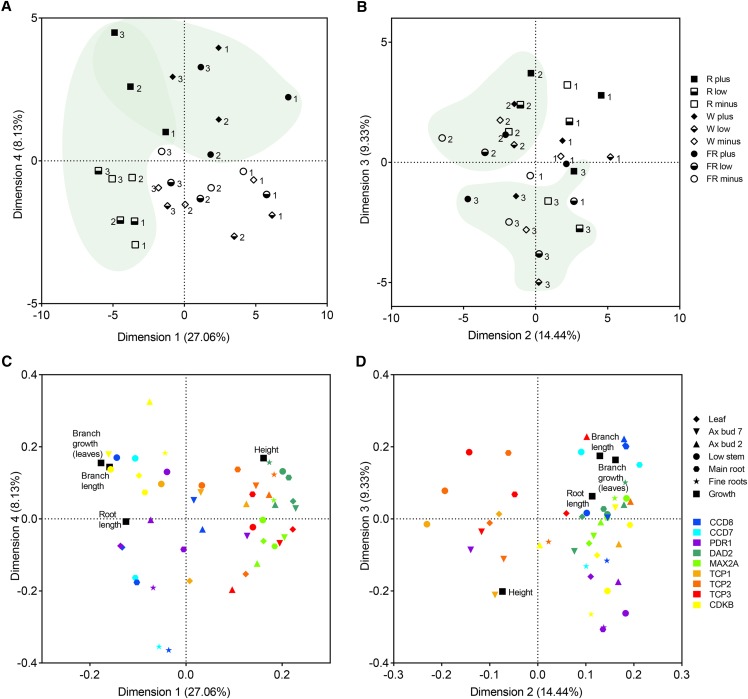
Plants alter their development in response to changes in their environment. This responsiveness has proven to be a successful evolutionary trait. Here, we tested the hypothesis that two key environmental factors, light and nutrition, are integrated within the axillary bud to promote or suppress the growth of the bud into a branch. Using petunia (Petunia hybrida) as a model for vegetative branching, we manipulated both light quality (as crowding and the red-to-far-red light ratio) and phosphate availability, such that the axillary bud at node 7 varied from deeply dormant to rapidly growing. In conjunction with the phenotypic characterization, we also monitored the state of the strigolactone (SL) pathway by quantifying SL-related gene transcripts. Mutants in the SL pathway inhibit but do not abolish the branching response to these environmental signals, and neither signal is dominant over the other, suggesting that the regulation of branching in response to the environment is complex. We have isolated three new putatively SL-related TCP (for Teosinte branched1, Cycloidia, and Proliferating cell factor) genes from petunia, and have identified that these TCP-type transcription factors may have roles in the SL signaling pathway both before and after the reception of the SL signal at the bud. We show that the abundance of the receptor transcript is regulated by light quality, such that axillary buds growing in added far-red light have greatly increased receptor transcript abundance. This suggests a mechanism whereby the impact of any SL signal reaching an axillary bud is modulated by the responsiveness of these cells to the signal.


Figures

Figure 1.
Figure 1.
Petunia growth responses to individual environmental signals: light and nutrients. All graphs show phenotypic data as indicated. Values are means ± se. A to C, Petunia plants (the wild type [wt; line V26], ccd8, and dad2) were grown in nutrient-controlled hydroponics. After germination, the plants were established in standard-nutrient medium for 4 weeks. The medium was replaced with either standard-nutrient (250 µm P; dark green) or low-nutrient (5 µm P; light green) medium, and growth was continued for 4 weeks (n = 9–10). D to F, Petunia plants (the wild type, ccd8, and dad2) were grown in nutrient-controlled hydroponics. After germination, the plants were established in standard-nutrient medium for 3 weeks. The medium was replaced with either standard-nutrient (750 µm N; dark blue) or low-nutrient (250 µm N; light blue) medium, and growth was continued for 4 weeks (n = 6). G to I, Petunia plants (the wild type, ccd8, and dad2) were grown on soil supplemented with fertilizer for 7 weeks at a peak density of one plant per 25 cm2. The plants were subjected to three levels of crowded conditions for 7 weeks: corner (three neighbors; blue), edge (five neighbors; green), or middle (eight neighbors; mustard; n = 11–20). J to L, Petunia plants (the wild type and ccd8) were germinated and then established in hydroponics in white light for 5 weeks. The lighting was then supplemented with red light (R:FR ratio = 2.3) or far-red light (R:FR ratio = 0.4) for 3 weeks. Bright red bars show red light treatment, and dark red bars show far-red light treatment (n = 8). The statistical significance of differences was determined by ANOVA, and values with no common lowercase identifiers are significantly different from each other (P = 0.05).
Figure 2.
Figure 2.
Light quality and nutrient status (P) work in concert to control branching in petunia. Petunia plants were germinated and grown on soil in a glasshouse for 20 d and then transferred to hydroponics for 17 d (R:FR ratio = 1; 250 µm P) before being transferred to nine treatment environments for 7 d. The treatments were made up of a three-by-three array of P availability (250, 5, and 0 µm P) by light quality (R:FR ratio = 4–10 for red light [R], 1 for white light [W], and 0.2–0.3 for far-red light [FR]). A to C, The total numbers of leaves on all branches were counted (as a measure of branching), and plant height and root length were measured. The statistical significance of differences was determined by ANOVA, and values with no common lowercase identifiers are significantly different from each other (P = 0.05). D, The numbers of leaves on branches at each node are plotted individually for the nine treatments. Values are means ± se (n = 21).
Figure 3.
Figure 3.
Expression of the PhCCD7 gene as visualized from a PCCD7-GUS construct in transgenic petunia plants. All plants shown are 6 to 7 weeks old; plants in A and C were grown in hydroponics, and plants shown in B and D to H were soil grown. A, Longitudinal section of the bottom half of the stem of a plant and root system of a plant; most leaves, branches, and the top half of the main shoot have been removed. The red star indicates the position where the stem was cut. B, Longitudinal section through a section of stem showing an axillary bud and subtending leaf. C, Fine roots from two plants that were grown in normal-P (+P; left) or in low-P (−P; right) medium. D to H, Cross sections from a single plant at the upper stem (D), midstem (E; approximately node 12), low stem (F), hypocotyl-low stem junction (G), and main root (H). Bars = 1 cm (A) or 2 mm (B–H).
Figure 4.
Figure 4.
Petunia TCP genes involved in the SL signaling pathway. A, Relative transcript abundance in 8-week-old wild-type (wt) and dad2 petunia organs. Values are means ± se (n = 3). Samples were as follows: axbud, axillary bud samples from the four nodes above the highest branch; lowstem, 2 cm of stem above the cotyledons (nodes and internodes); leaf, expanded leaf blade; and root, fine roots. Relative transcript abundance as rescaled against the sample with the greatest expression for each gene is indicated on the graphs. B, Phylogenetic analysis of the TB1 subclade of the class II TCP proteins. Sequences with similarity to known TCP proteins were identified in public databases by iterative BLAST search, and an initial alignment using Geneious was manually edited. Phylogenetic relationships were determined using the PhyML plugin to create a maximum likelihood tree. Numbers are percentage bootstrap values for 100 replicates. Names are given as two letters for the species (At, Arabidopsis; Sl, tomato; St, potato; Ph, petunia; Bd, B. distachyon; Os, rice; Mt, M. truncatula; Ps, pea; Pt, P. tremula; Pd, date palm; Pp, P. patens; Ap, Anemone pulsatilla; Nn, Nelumbo nucifera; Zm, maize) followed by TCP and a number where the gene has been assigned a TCP number in the literature and a letter where such an assignment has not yet been made. AtTCP18 and AtTCP12 are commonly known as BRC1 and BRC2, respectively. SlTCP18 and AtTCP20 are class I TCP proteins and were used as the outgroup.
Figure 5.
Figure 5.
The transcription of the SL synthesis and reception pathway genes is altered in response to environmental cues. The relative transcript abundance of SL-related genes was quantified in six organs from plants treated in an array of light quality by P availability using quantitative reverse transcription-PCR. The data have been grouped by organ (A), P treatment (B), and light treatment (C), averaged, and within each grouping normalized to 1. Each bar represents average abundance on a linear scale from 0 to 1. The transcript abundance of a given gene (organ average) is directly comparable across all organs within the organ grouping (A) but only within an organ when grouped by P or light (B and C). Transcript abundance is not directly comparable between different genes because of normalization. The statistical significance of any changes seen within the P or light treatments has been tested by ANOVA, and the level of significance is indicated as follows: *, P < 0.05; **, P < 0.01; and ***, P < 0.001. Where P > 0.05, the bars have been faded to 20% of their original intensity. For P treatment, plus = 250 µm P, low = 5 µm P, and minus = 0 µm P; for light treatment, R (red light) = R:FR ratio > 4, W (white light) = R:FR ratio = 1, and FR (far-red light) = R:FR ratio < 0.3. Organ average n = 27, P or light n = 9. nd, Transcript not detected.
Figure 6.
Figure 6.
Details of transcript abundance changes in response to P availability in fine root samples. Relative transcript abundance is shown for selected genes in fine root samples from wild-type petunia treated with varied P availability and light quality. For each gene, the samples are grouped by P treatment, with the colored bars representing light treatment as follows: R:FR ratio > 4 (red; red light [R]), R:FR ratio = 1 (gray; white light [W]), and R:FR ratio < 0.3 (dark red; far-red light [FR]). Values are means with se (n = 3). The values of abundance for each gene are normalized to the greatest abundance of that transcript in any sample. Asterisks next to each gene name indicate the P value in Figure 5.
Figure 7.
Figure 7.
Details of transcript abundance changes in response to light quality (R:FR ratio) in axillary bud 7 samples. Relative transcript abundance is shown for the genes tested in the axillary bud 7 samples from wild-type petunia treated with varied P availability and light quality. The CCD7 transcript was not detected in these samples. For each gene, the samples are grouped by light treatment (R, red light; W, white light; and FR, far-red light), with the colored bars representing P availability as follows: green, 250 µm P; blue, 5 µm P; and dark blue, 0 µm P . Values are means with se (n = 3). The values of abundance for each gene are normalized to the greatest abundance of that transcript in any sample. Asterisks next to each gene name indicate the P value in Figure 5.
Figure 8.
Figure 8.
PCA of growth and molecular data. Principal component scores (A and B) and latent vectors (C and D) are shown for the first four dimensions from a PCA of growth characteristics (branch growth, root length, and plant height) and gene expression. Gene expression for gene/organ combinations where no expression was detected was excluded from this analysis (i.e. CCD7 expression was not detected in axillary bud or leaf samples, PhTCP1 expression was not detected in root samples, and PhTCP3 expression was not detected in fine roots). Dimensions 1 and 4 (A and C) explain 27.06% and 8.13% of the variance in the data, respectively, and show separation of the environmental treatments, whereas dimensions 2 and 3 (B and D) explain 14.44% and 9.33% of the variance and show some separation of the biological replicates. Light treatments are as follows: R, red light; W, white light; and FR, far-red light.

Similar articles

Cited by

References

    1. Abe S, Sado A, Tanaka K, Kisugi T, Asami K, Ota S, Kim HI, Yoneyama K, Xie X, Ohnishi T, et al. (2014) Carlactone is converted to carlactonoic acid by MAX1 in Arabidopsis and its methyl ester can directly interact with AtD14 in vitro. Proc Natl Acad Sci USA 111: 18084–18089 - PMC - PubMed
    1. Aguilar-Martínez JA, Poza-Carrión C, Cubas P (2007) Arabidopsis BRANCHED1 acts as an integrator of branching signals within axillary buds. Plant Cell 19: 458–472 - PMC - PubMed
    1. Arite T, Iwata H, Ohshima K, Maekawa M, Nakajima M, Kojima M, Sakakibara H, Kyozuka J (2007) DWARF10, an RMS1/MAX4/DAD1 ortholog, controls lateral bud outgrowth in rice. Plant J 51: 1019–1029 - PubMed
    1. Arite T, Kameoka H, Kyozuka J (2012) Strigolactone positively controls crown root elongation in rice. J Plant Growth Regul 31: 165–172
    1. Arite T, Umehara M, Ishikawa S, Hanada A, Maekawa M, Yamaguchi S, Kyozuka J (2009) d14, a strigolactone-insensitive mutant of rice, shows an accelerated outgrowth of tillers. Plant Cell Physiol 50: 1416–1424 - PubMed

Publication types

MeSH terms

Associated data

LinkOut - more resources