

Expanding Duplication of Free Fatty Acid Receptor-2 (GPR43) Genes in the Chicken Genome
- PMID: 25912043
- PMCID: PMC4453067
- DOI: 10.1093/gbe/evv072
Expanding Duplication of Free Fatty Acid Receptor-2 (GPR43) Genes in the Chicken Genome
Abstract
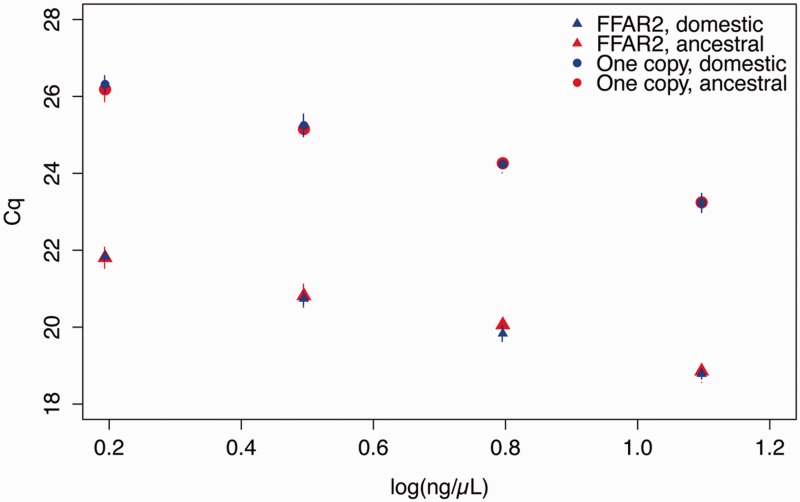
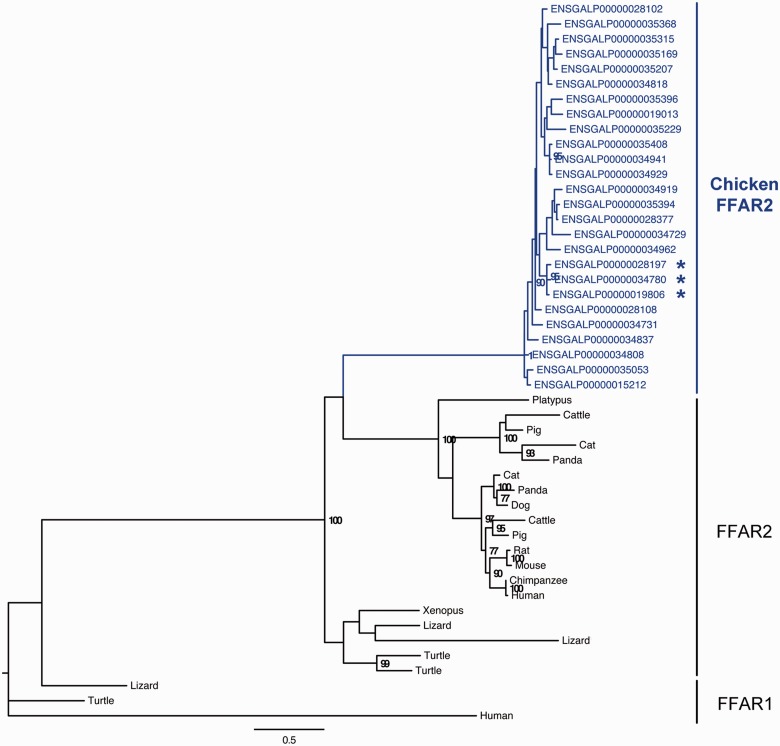
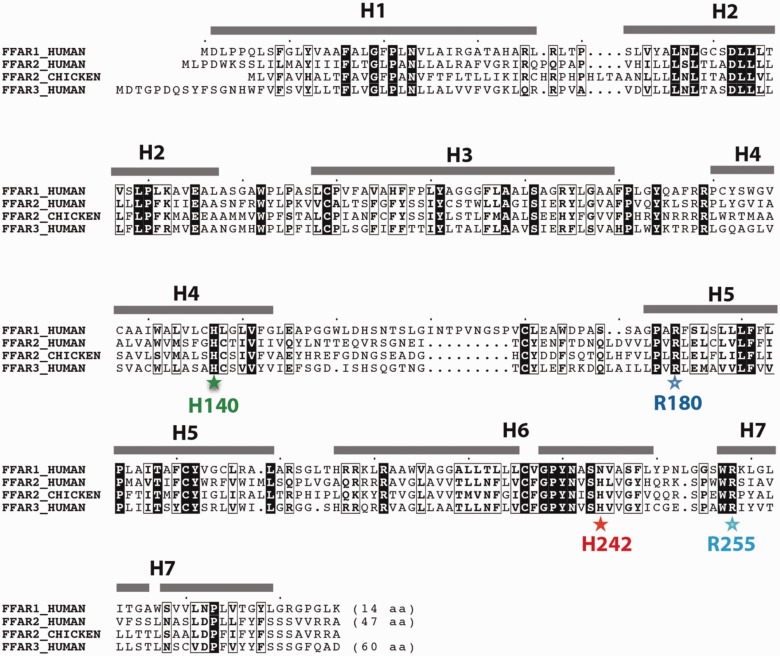
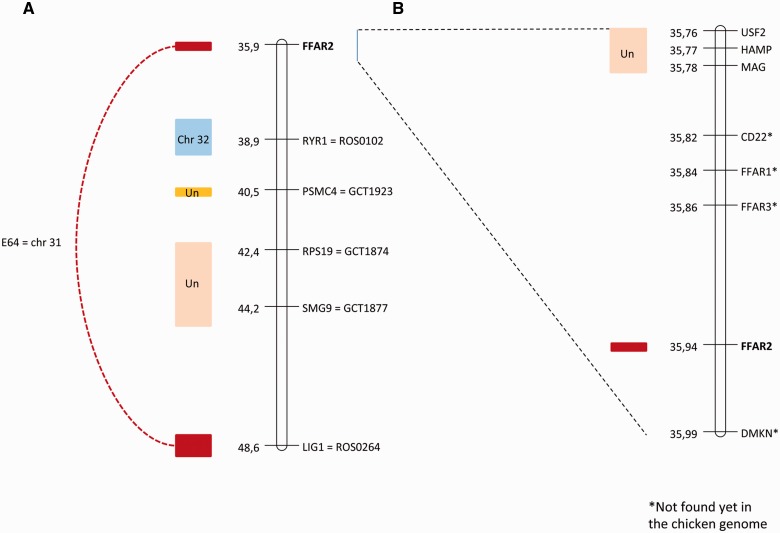
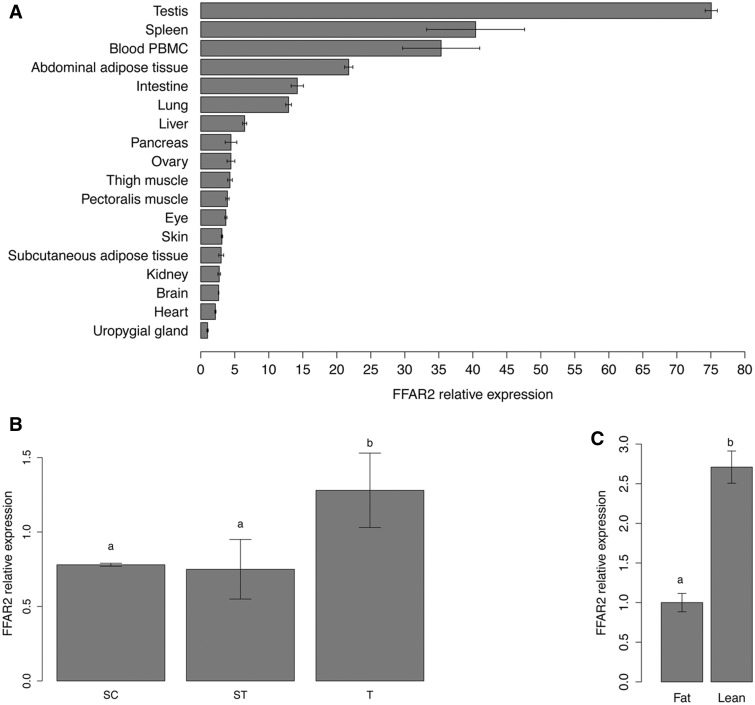
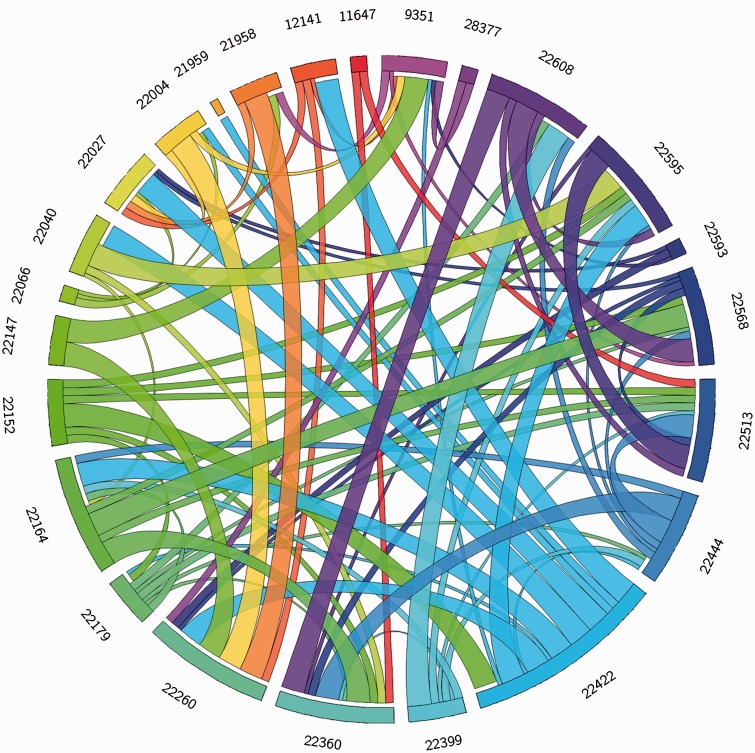
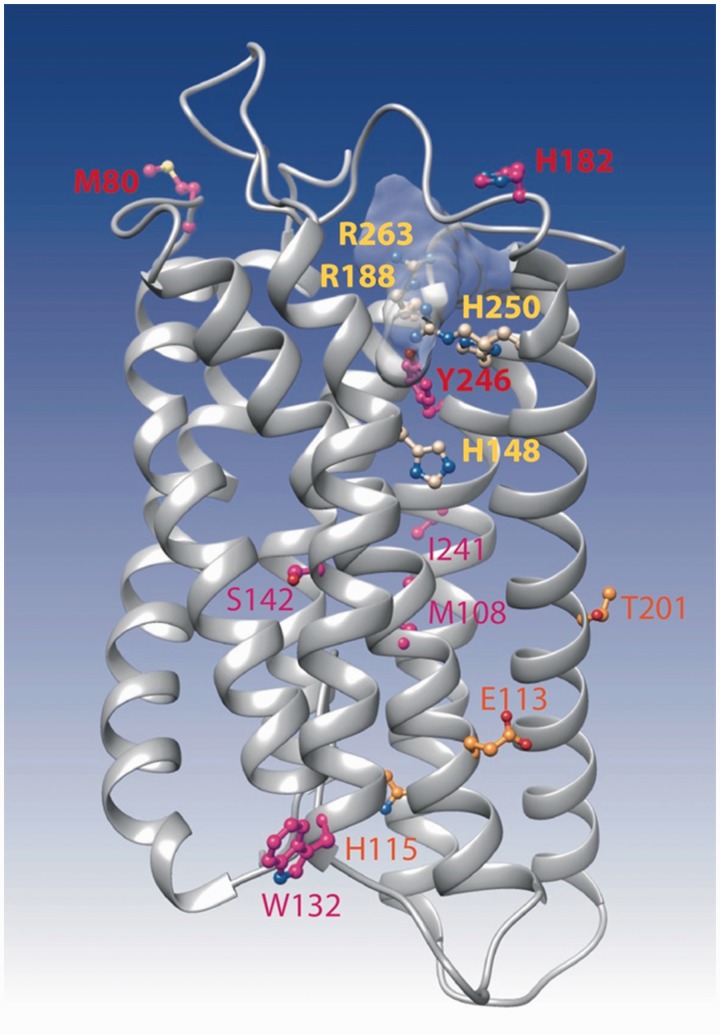
Free fatty acid receptors (FFAR) belong to a family of five G-protein coupled receptors that are involved in the regulation of lipid metabolism, so that their loss of function increases the risk of obesity. The aim of this study was to determine the expansion of genes encoding paralogs of FFAR2 in the chicken, considered as a model organism for developmental biology and biomedical research. By estimating the gene copy number using quantitative polymerase chain reaction, genomic DNA resequencing, and RNA sequencing data, we showed the existence of 23 ± 1.5 genes encoding FFAR2 paralogs in the chicken genome. The FFAR2 paralogs shared an identity from 87.2% up to 99%. Extensive gene conversion was responsible for this high degree of sequence similarities between these genes, and this concerned especially the four amino acids known to be critical for ligand binding. Moreover, elevated nonsynonymous/synonymous substitution ratios on some amino acids within or in close-vicinity of the ligand-binding groove suggest that positive selection may have reduced the effective rate of gene conversion in this region, thus contributing to diversify the function of some FFAR2 paralogs. All the FFAR2 paralogs were located on a microchromosome in a same linkage group. FFAR2 genes were expressed in different tissues and cells such as spleen, peripheral blood mononuclear cells, abdominal adipose tissue, intestine, and lung, with the highest rate of expression in testis. Further investigations are needed to determine whether these chicken-specific events along evolution are the consequence of domestication and may play a role in regulating lipid metabolism in this species.
Keywords: FFAR; chicken; duplication; evolution; gene conversion; positive selection.
© The Author(s) 2015. Published by Oxford University Press on behalf of the Society for Molecular Biology and Evolution.
Figures
Similar articles
-
Invited review: nutrient-sensing receptors for free fatty acids and hydroxycarboxylic acids in farm animals.Animal. 2017 Jun;11(6):1008-1016. doi: 10.1017/S175173111600238X. Epub 2016 Nov 10. Animal. 2017. PMID: 27829484 Review.
-
A revised evolutionary history of the CYP1A subfamily: gene duplication, gene conversion, and positive selection.J Mol Evol. 2006 Jun;62(6):708-17. doi: 10.1007/s00239-005-0134-z. Epub 2006 Apr 28. J Mol Evol. 2006. PMID: 16752211
-
A genome-wide screen identifies a single beta-defensin gene cluster in the chicken: implications for the origin and evolution of mammalian defensins.BMC Genomics. 2004 Aug 13;5(1):56. doi: 10.1186/1471-2164-5-56. BMC Genomics. 2004. PMID: 15310403 Free PMC article.
-
GPR41/FFAR3 and GPR43/FFAR2 as cosensors for short-chain fatty acids in enteroendocrine cells vs FFAR3 in enteric neurons and FFAR2 in enteric leukocytes.Endocrinology. 2013 Oct;154(10):3552-64. doi: 10.1210/en.2013-1142. Epub 2013 Jul 24. Endocrinology. 2013. PMID: 23885020
-
Genome duplication and gene-family evolution: the case of three OXPHOS gene families.Gene. 2008 Sep 15;421(1-2):1-6. doi: 10.1016/j.gene.2008.05.011. Epub 2008 Jun 23. Gene. 2008. PMID: 18573316 Review.
Cited by
-
Uncovering the core principles of the gut-lung axis to enhance innate immunity in the chicken.Front Immunol. 2022 Oct 4;13:956670. doi: 10.3389/fimmu.2022.956670. eCollection 2022. Front Immunol. 2022. PMID: 36268022 Free PMC article.
-
An evolutionary approach to recover genes predominantly expressed in the testes of the zebrafish, chicken and mouse.BMC Evol Biol. 2019 Jul 3;19(1):137. doi: 10.1186/s12862-019-1462-8. BMC Evol Biol. 2019. PMID: 31269894 Free PMC article.
-
Degree of Saturation and Free Fatty Acid Content of Fats Determine Dietary Preferences in Laying Hens.Animals (Basel). 2020 Dec 19;10(12):2437. doi: 10.3390/ani10122437. Animals (Basel). 2020. PMID: 33352702 Free PMC article.
-
Molecular characterization of free fatty acid receptors FFAR2 and FFAR3 in the domestic cat.Vet Med Sci. 2021 Jan;7(1):77-85. doi: 10.1002/vms3.356. Epub 2020 Sep 15. Vet Med Sci. 2021. PMID: 32929853 Free PMC article.
-
Free Fatty Acid Receptors 2 and 3 as Microbial Metabolite Sensors to Shape Host Health: Pharmacophysiological View.Biomedicines. 2020 Jun 8;8(6):154. doi: 10.3390/biomedicines8060154. Biomedicines. 2020. PMID: 32521775 Free PMC article. Review.
References
-
- Bjursell M, et al. Improved glucose control and reduced body fat mass in free fatty acid receptor 2-deficient mice fed a high-fat diet. J Physiol Endocrinol Metab. 2011;300(1):E211–E220. - PubMed
-
- Bowie JU, Luthy R, Eisenberg D. A method to identify protein sequences that fold into a known three-dimensional structure. Science. 1991;253:164–170. - PubMed
-
- Burt D. Emergence of the chicken as a model organism: implications for agriculture and biology. Poult Sci. 2007;86:1460–1471. - PubMed
-
- Chirgwin JM, Przybyla AE, MacDonald RJ, Rutter WJ. Isolation of biologically active ribonucleic acid from sources enriched in ribonuclease. Biochemistry. 1979;18:5294–5299. - PubMed
Publication types
MeSH terms
Substances
LinkOut - more resources
Full Text Sources
Other Literature Sources
