. 2015 May 7;161(4):803-16.
doi: 10.1016/j.cell.2015.04.012. Epub 2015 Apr 23.

Neuronal Activity Promotes Glioma Growth through Neuroligin-3 Secretion

Affiliations

Neuronal Activity Promotes Glioma Growth through Neuroligin-3 Secretion

Humsa S Venkatesh et al. Cell. .

Abstract

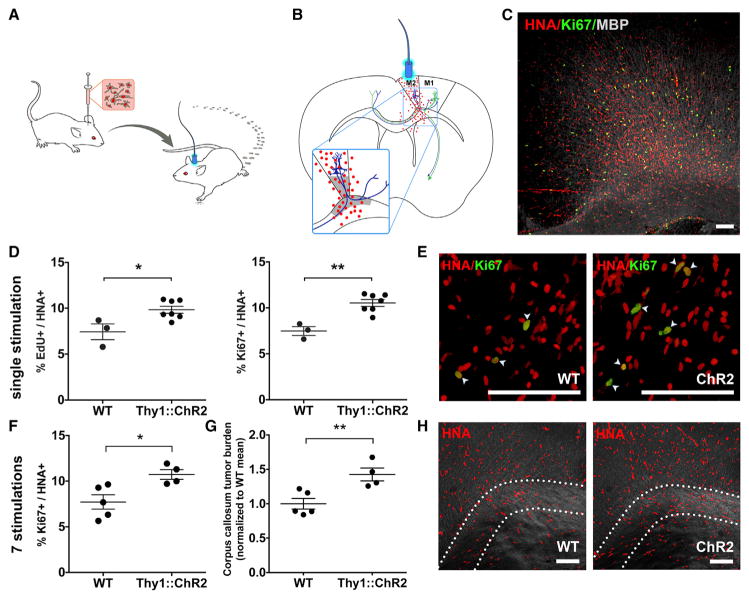
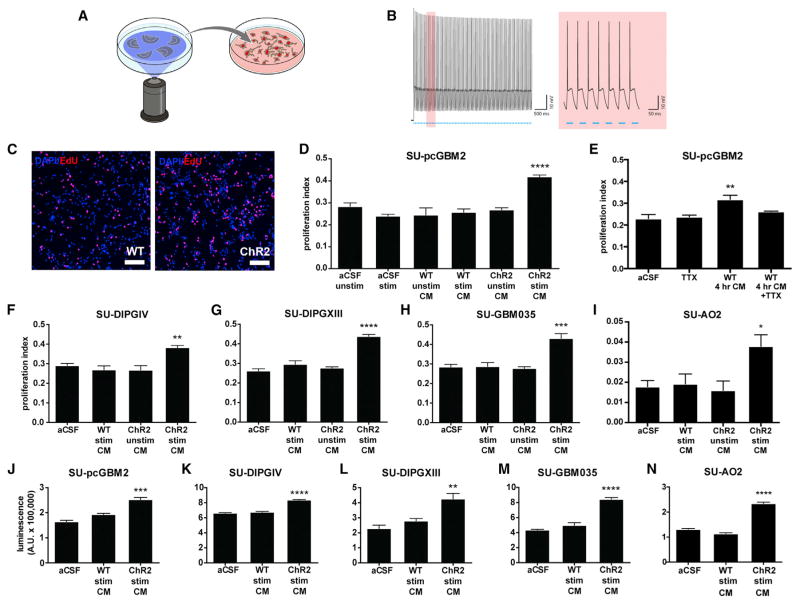
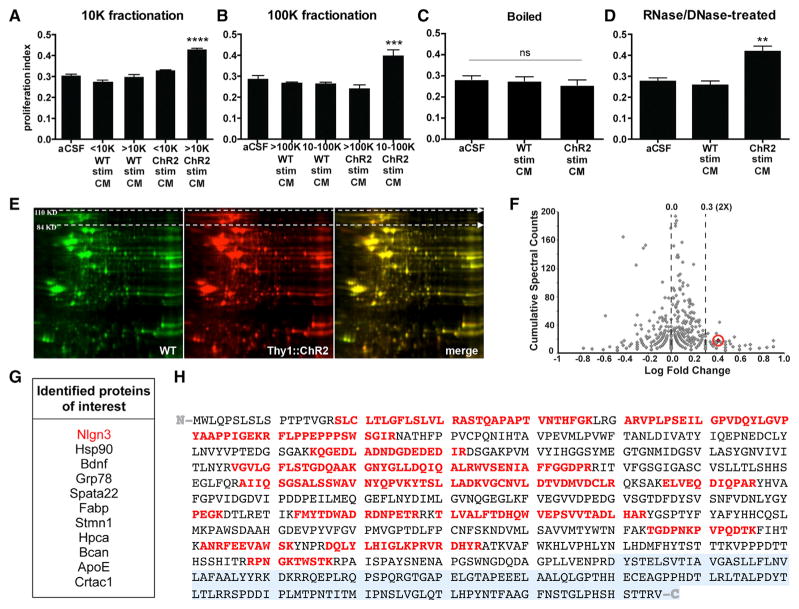
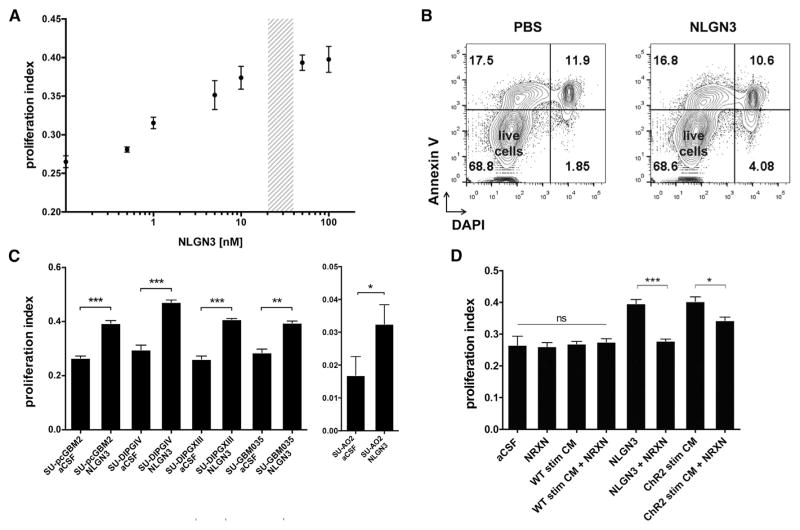
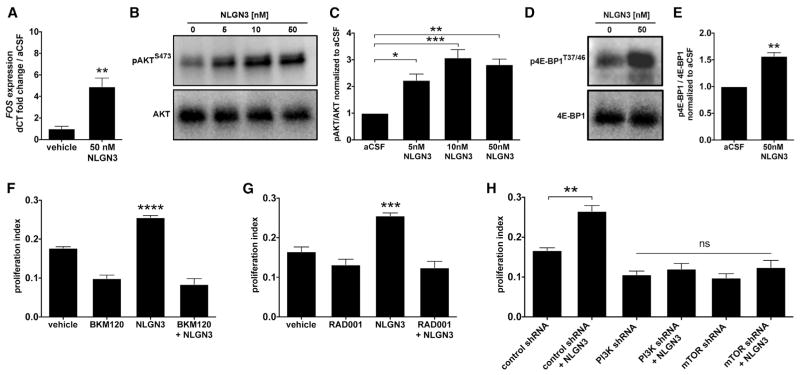
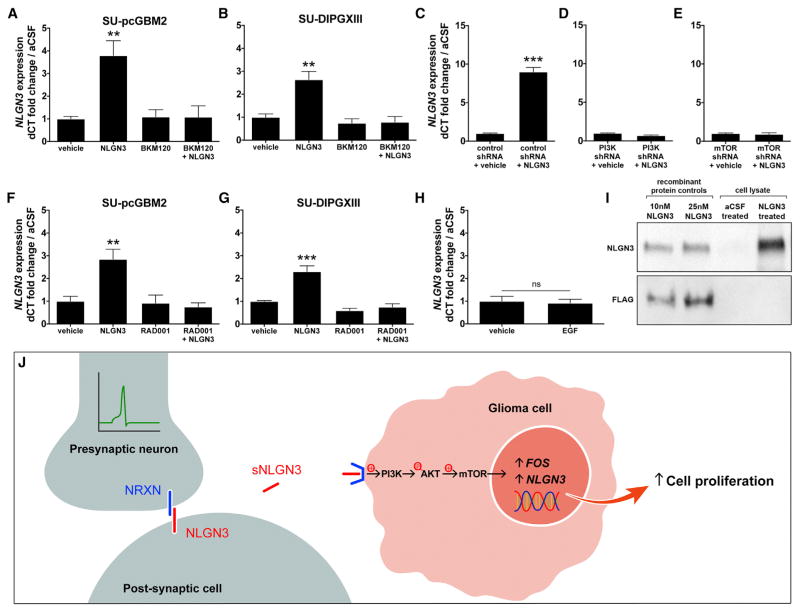
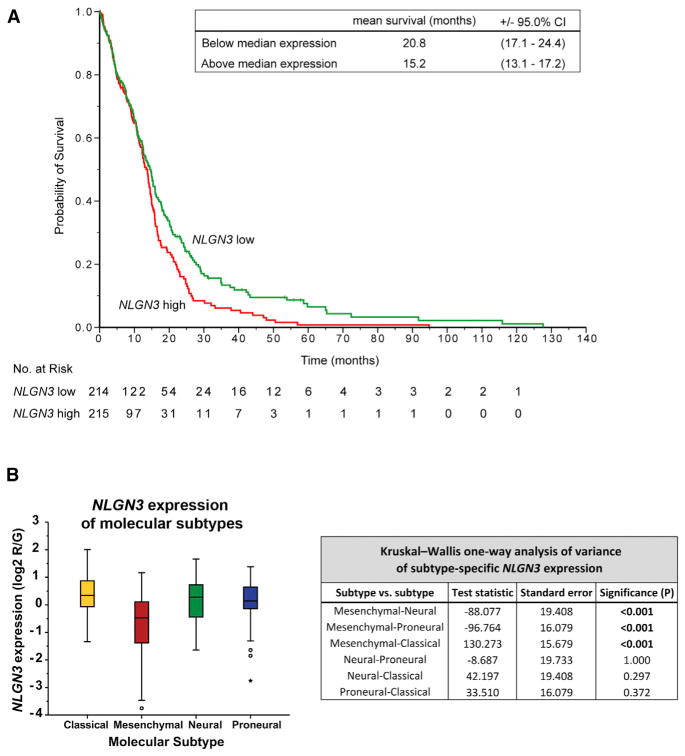
Active neurons exert a mitogenic effect on normal neural precursor and oligodendroglial precursor cells, the putative cellular origins of high-grade glioma (HGG). By using optogenetic control of cortical neuronal activity in a patient-derived pediatric glioblastoma xenograft model, we demonstrate that active neurons similarly promote HGG proliferation and growth in vivo. Conditioned medium from optogenetically stimulated cortical slices promoted proliferation of pediatric and adult patient-derived HGG cultures, indicating secretion of activity-regulated mitogen(s). The synaptic protein neuroligin-3 (NLGN3) was identified as the leading candidate mitogen, and soluble NLGN3 was sufficient and necessary to promote robust HGG cell proliferation. NLGN3 induced PI3K-mTOR pathway activity and feedforward expression of NLGN3 in glioma cells. NLGN3 expression levels in human HGG negatively correlated with patient overall survival. These findings indicate the important role of active neurons in the brain tumor microenvironment and identify secreted NLGN3 as an unexpected mechanism promoting neuronal activity-regulated cancer growth.


Figures

Figure 1
Figure 1. Neuronal Activity Promotes High-Grade Glioma Proliferation and Growth In Vivo
(A) In vivo optogenetic high-grade glioma (HGG) orthotopic xenograft model. (B) Schematic illustration of the optogenetically stimulatable premotor circuit. Thy1::ChR2+ premotor cortex (M2) neurons depicted in blue; primary motor cortex (M1) projection neurons, green; tumor cells depicted as red dots. Gray shading indicates region of analysis. (C) Confocal micrograph of infiltrating pHGG (SU-pcGBM2) cells expressing human nuclear antigen (HNA, red), proliferation marker Ki67 (green) in premotor cortical deep layers and subjacent corpus callosum (MBP, white). (D and E) Single optogenetic stimulation session paradigm. (D) Proliferation index of pHGG cells in identically manipulated WT;NSG (n = 3) and Thy1::ChR2;NSG (n = 7) mice, measured by the proportion of HNA+ cells expressing EdU (left graph) or Ki67 (right graph) 24 hr after one optogenetic stimulation session. (E) Confocal micrograph illustrating proliferating (Ki67+, green) pHGG cells (HNA+, red) xenografted in WT;NSG (“WT”; left) or Thy1::ChR2;NSG mice (“ChR2”; right). (F–H) Repetitive optogenetic stimulation sessions paradigm. Xenografted WT;NSG (n = 5) and Thy1::ChR2;NSG (n = 4) mice evaluated 48 hr after seven daily sessions of optogenetic stimulation. (F) Proliferation index (Ki67+/HNA+) as in (D) above after seven stimulations. (G) Tumor cell burden increases following 1 week of brief daily optogenetic stimulation sessions, measured as HNA+ cell density within the region of corpus callosum containing active premotor projections; data normalized to WT mean. (H) Confocal micrographs with differential interference contrast (DIC) background to illustrate regional tissue architecture; HNA+ pHGG cells (red) are infiltrating premotor cortex and subjacent corpus callosum. Dotted line indicates region of analysis in corpus callosum. Data shown as mean ± SEM. *p < 0.05, **p < 0.01 by unpaired two-tailed Student’s t test. Scale bars, 100 μm. See also Figure S1 and Movie S1.
Figure 2
Figure 2. Activity-Regulated Secreted Factors Promote Glioma Cell Proliferation
(A) Schematic depicts optogenetic stimulation of acute cortical slices and collection of conditioned medium (CM). (B) Electrophysiological demonstration by patch-clamp recording (left; trace highlighted in red is magnified at right) of 20 Hz neuronal firing in response to 20 Hz blue light pulses throughout the 30 s stimulation period in the Thy1::ChR2 cortical slice. (C) Representative confocal micrographs show increased uptake of EdU (red) in cells (DAPI, blue) exposed to CM from stimulated Thy1::ChR2 slices (active CM) versus those exposed to CM from blue light-exposed WT slices (WT CM). (D) Proliferation index of SU-pcGBM2 cells exposed to optogenetically stimulated or unstimulated Thy1::ChR2 cortical slice CM, blue light-exposed WT cortical slice CM (“WT stim CM”) or non-exposed WT cortical slice CM (“WT unstim CM”), or plain media (aCSF). (E) Proliferation index of SU-pcGBM2 cells after exposure to CM generated from light-unexposed WT slice conditioning for 4 hr in the presence or absence of 1 μM tetrodotoxin (TTX). (F–I) Active CM similarly increased the proliferation index of DIPG (F and G), adult GBM (H), and anaplastic oligodendroglioma (I) cultures. (J–N) Active CM increased the viable cell number measured by CellTiter-Glo after 72 hr of incubation with active or light-exposed WT CM in pediatric and adult GBM (J and M), DIPG (K and L), and anaplastic oligodendroglioma (N) cells. All experiments analyzed by one-way ANOVA and performed with n = 3 biological replicates. Data shown as mean ± SEM. *p < 0.05, **p < 0.01, ***p < 0.001, ****p < 0.0001. Scale bars, 100 μm. See also Figure S2 and Table S1.
Figure 3
Figure 3. Cortical Neuronal Activity-Regulated Glioma Mitogen(s) Are Protein(s)
(A and B) Fractionation of CM by molecular size reveals that the activity-regulated mitogenic factors are >10 kDa (A) and <100 kDa (B). (C) Heating active CM to 100°C inactivates the mitogen(s). (D) RNA and DNA digestion of active CM does not change its mitogenic effect. All experiments analyzed by one-way ANOVA and performed with n = 3 biological replicates. Data shown as mean ± SEM. **p < 0.01, ***p < 0.001, ****p < 0.0001. n.s. indicates p > 0.05. (E) Representative two-dimensional gel electrophoresis separating proteins in light-exposed WT CM (green) and active CM (red) by size (vertical axis) and charge (horizontal axis); merged images, right-most panel. (F) Volcano plot of spectral counting data shows the ratio of peptides in a given protein found in active CM versus CM from unstimulated Thy1::ChR2 slices. Neuroligin-3 (Nlgn3) is highlighted and circled in red. (G) List of candidate proteins of interest identified from proteomic analyses. (H) Nlgn3 peptide sequence. Peptides in red were identified by mass spectrometry of the Nlgn3 isolated from active CM. Despite excellent coverage across the N-terminal ectodomain of the protein, no part of the C-terminal endodomain (transmembrane and intracellular domains, shaded gray) was identified in the isolated soluble Nlgn3. See also Figure S3 and Table S2.
Figure 4
Figure 4. Secreted Neuroligin-3 Mediates Neuronal Activity-Regulated Glioma Proliferation
(A) Seven-point dose curve plots SU-pcGBM2 proliferation index as measured by EdU+/DAPI+ staining 24 hr after exposure to recombinant NLGN3 at a 0–100 nM concentration range. Shaded region indicates concentration present in active CM. (B) After 24 hr exposure to PBS or NLGN3 (50 nM), SU-pcGBM2 cells were stained with DAPI (x axis) and Annexin V-FITC (y axis) to detect cell death by FACS analysis, performed in biological duplicate. Live Annexin V/DAPI cells shown in lower-left quadrant of contour plots; pre-apoptotic Annexin V+/DAPI cells, left upper quadrant; dead Annexin V+/DAPI+ cells, right upper quadrant. No increase in cell death was seen with NLGN3 exposure. (C) Proliferation indices of various patient-derived HGG cell lines exposed to 50 nM NLGN3 for 24 hr (unpaired two-tailed Student’s t tests). (D) Neurexin-1β (NRXN, 500 nM), which binds NLGN3 with high affinity, effectively blocks the mitogenic effect of recombinant NLGN3 (50 nM) and abrogates the mitogenic effect of active CM (unpaired two-tailed Student’s t tests). Exposure to NRXN alone or added to light-exposed WT CM (“WT Stim CM”) does not affect pHGG cell proliferation (one-way ANOVA). For all experiments, n = 3 biological replicates unless otherwise noted. Data shown as mean ± SEM. *p < 0.05, **p < 0.01, ***p < 0.001. n.s. indicates p > 0.05. See also Figure S4.
Figure 5
Figure 5. Secreted Neuroligin-3 Recruits the PI3K Pathway and Promotes Feedforward Expression of NLGN3
(A) FOS mRNA expression increases after 1 hr exposure to 50 nM NLGN3 compared to vehicle (p < 0.01 by unpaired two-tailed Student’s t test). (B) NLGN3 increases PI3K pathway signaling. Representative western blot shows increased phosphorylation of AKT (pAKTS473, top; total AKT, bottom) in response to NLGN3 concentrations ranging from 0 to 50 nM. (C) Quantification of the pAKTS473/AKT ratio fold change (normalized to aCSF) observed in (B). (D) Representative western blot demonstrates increased phosphorylation of 4E-BP1, a downstream reporter of mTOR, after 50 nM NLGN3 exposure. (Top) 4E-BP1T37/46; (bottom) total 4E-BP1. (E) Quantification of p4E-BP1T37/46/4E-BP1 ratio fold change after NLGN3 exposure normalized to aCSF control (unpaired two-tailed Student’s t test). (F) 50 nM NLGN3-induced increase in SU-pcGBM2 proliferation index (EdU assay) is blocked by inhibition of PI3K by BKM120 (100 nM). (G) Similar to (F), inhibition of mTOR by RAD001 (100 nM) blocks 50 nM NLGN3-induced proliferation in SU-pcGBM2 cells. (H) Genetic knockdown using specific shRNA against either PI3K or mTOR blocks effect of 50 nM NLGN3 on proliferation index (EdU assay in SU-pcGBM2). *p < 0.05, **p < 0.01, ***p < 0.001, ****p < 0.0001 by one-way ANOVA with Tukey’s post hoc tests to further examine pairwise comparisons unless otherwise indicated. All experiments performed in n = 3 biological replicates. Data shown as mean ± SEM. See also Figure S5 and Table S3.
Figure 6
Figure 6. Secreted Neuroligin-3 Promotes Feedforward Expression of NLGN3 through Recruitment of the PI3K-mTOR Pathway
(A) NLGN3 mRNA expression in SU-pcGBM2 cells after 12 hr exposure to vehicle, 50 nM NLGN3, 100 nM BKM120, or 50 nM NLGN3 + 100 nM BKM120. (B) As in (A), SU-DIPGXIII NLGN3 mRNA expression after exposure to NLGN3 and BKM120 alone or in combination. (C–E) NLGN3 mRNA expression in SU-pcGBM2 cells after shRNA-mediated knockdown of either PI3K or mTOR. Only cells exposed to scrambled shRNA control exhibit increased NLGN3 expression after NLGN3 exposure (unpaired two-tailed Student’s t test.) (F) NLGN3 mRNA expression in SU-pcGBM2 cells after 12 hr exposure to vehicle, 50 nM NLGN3, 100 nM RAD001, or 50 nM NLGN3 + 100 nM RAD001. (G) As in (F), SU-DIPGXIII NLGN3 mRNA expression after exposure to NLGN3 and RAD001 alone or in combination. (H) NLGN3 mRNA expression in SU-pcGBM2 cells does not change after 12 hr exposure to 50 nM EGF versus vehicle (unpaired two-tailed Student’s t test). All qPCR data (A–H) are normalized to vehicle-treated samples and represent fold change of the delta CT in reference to β-actin. (I) Western blot analysis illustrating NLGN3 protein expression. Lanes 1 and 2 = 10 nM and 25 nM recombinant FLAG-tagged NLGN3, respectively. Lanes 3 and 4 = lysate from SU-pcGBM2 cells exposed to aCSF or 50 nM recombinant FLAG-tagged NLGN3, respectively. Top panel probed with anti-NLGN3; bottom panel probed with anti-FLAG. (J) Schematic illustrating the model of neuronal activity-regulated NLGN3 secretion from a post-synaptic cell, subsequent recruitment of glioma cell PI3K-mTOR pathway, expression of FOS and NLGN3, and proliferation. n = 3 biological replicates unless otherwise stated. Data shown as mean ± SEM. *p < 0.05, **p < 0.01, ***p < 0.001 by one-way ANOVA unless otherwise stated. n.s. indicates p > 0.05. See also Figure S6 and Table S3.
Figure 7
Figure 7. Neuroligin-3 Expression Inversely Correlates with Survival in Human Glioblastoma
(A) A two-class model stratified by median NLGN3 expression in 429 GBM cases with molecular subtype data from the TCGA (http://cancergenome.nih.gov). Mean overall survival decreases by ~5.6 months in patients with tumors exhibiting above-median NLGN3 expression; p < 0.05 by the log-rank test. (B) GBM subtype-specific NLGN3 expression. Box plots show the smallest and largest observations (top and bottom whiskers, respectively), the interquartile (IQ) range (box), and the median (black line). Data points more than 1.5 times the IQ range lower than the first quartile or 1.5 times the IQ range higher than the third quartile were considered outliers (shown as circles outside the box and whisker plot). Corresponding table of Kruskal-Wallis one-way ANOVAs with p values indicates pairwise comparisons of NLGN3 expression in the four subtypes and significance of differential NLGN3 expressions. See also Figure S7, Table S4.

Comment in

References

    1. Arenkiel BR, Peca J, Davison IG, Feliciano C, Deisseroth K, Augustine GJ, Ehlers MD, Feng G. In vivo light-induced activation of neural circuitry in transgenic mice expressing channelrhodopsin-2. Neuron. 2007;54:205–218. - PMC - PubMed
    1. Bergles DE, Roberts JD, Somogyi P, Jahr CE. Glutamatergic synapses on oligodendrocyte precursor cells in the hippocampus. Nature. 2000;405:187–191. - PubMed
    1. Bergles DE, Jabs R, Steinhäuser C. Neuron-glia synapses in the brain. Brain Res Brain Res Rev. 2010;63:130–137. - PMC - PubMed
    1. Boyden ES, Zhang F, Bamberg E, Nagel G, Deisseroth K. Millisecond-timescale, genetically targeted optical control of neural activity. Nat Neurosci. 2005;8:1263–1268. - PubMed
    1. Buckingham SC, Campbell SL, Haas BR, Montana V, Robel S, Ogunrinu T, Sontheimer H. Glutamate release by primary brain tumors induces epileptic activity. Nat Med. 2011;17:1269–1274. - PMC - PubMed

Publication types

Associated data