. 2015 May 7;161(4):833-44.
doi: 10.1016/j.cell.2015.04.011. Epub 2015 Apr 23.

Structure of the Angiotensin receptor revealed by serial femtosecond crystallography

Affiliations

Structure of the Angiotensin receptor revealed by serial femtosecond crystallography

Haitao Zhang et al. Cell. .

Abstract

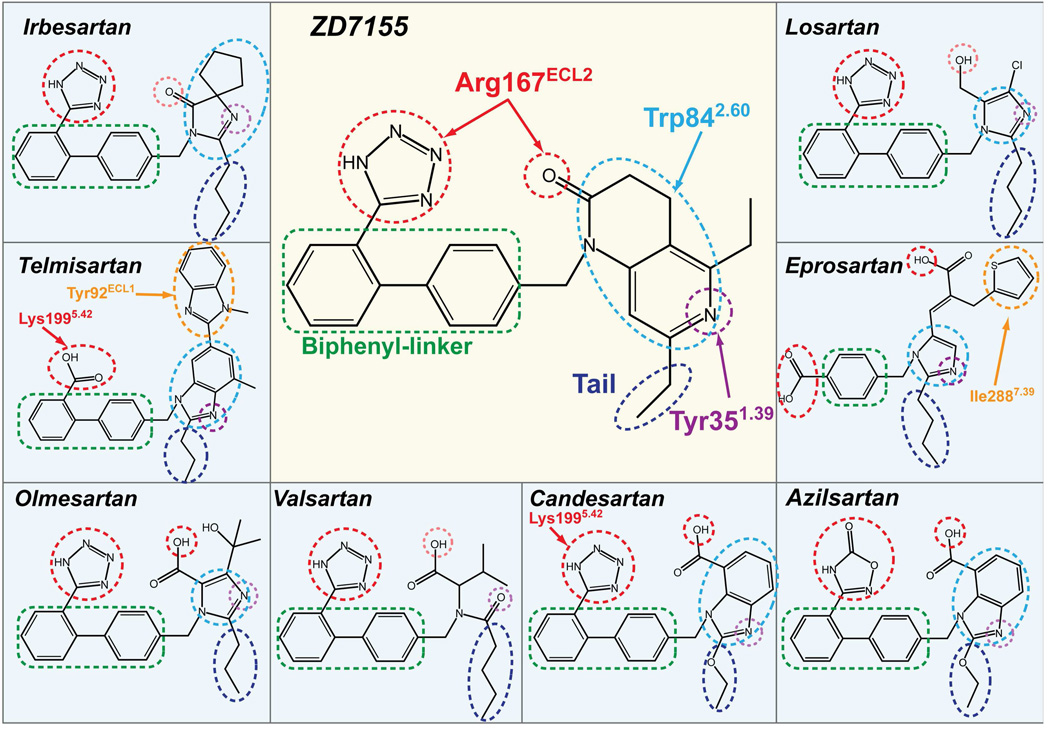
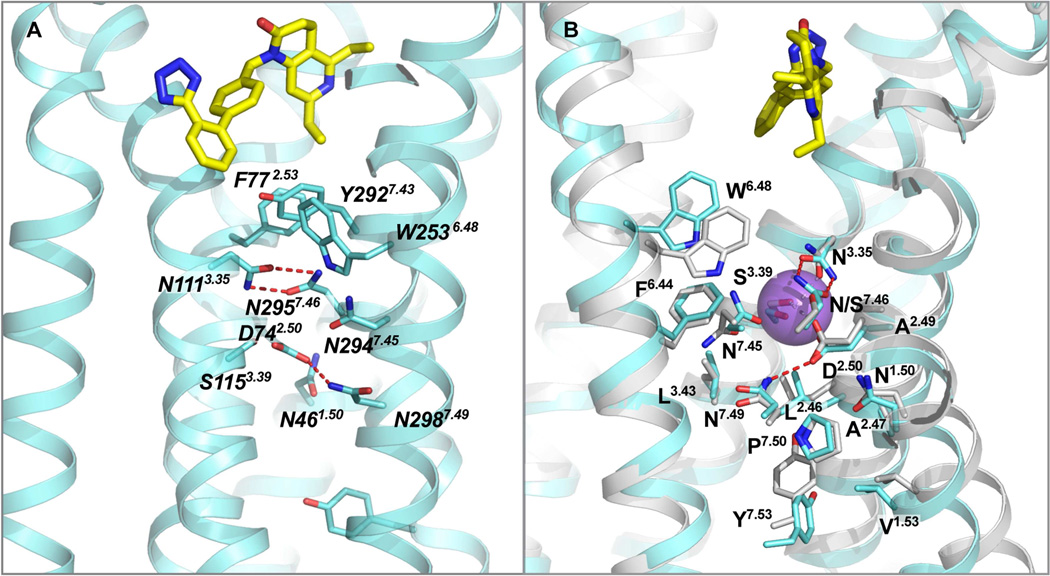
Angiotensin II type 1 receptor (AT(1)R) is a G protein-coupled receptor that serves as a primary regulator for blood pressure maintenance. Although several anti-hypertensive drugs have been developed as AT(1)R blockers (ARBs), the structural basis for AT(1)R ligand-binding and regulation has remained elusive, mostly due to the difficulties of growing high-quality crystals for structure determination using synchrotron radiation. By applying the recently developed method of serial femtosecond crystallography at an X-ray free-electron laser, we successfully determined the room-temperature crystal structure of the human AT(1)R in complex with its selective antagonist ZD7155 at 2.9-Å resolution. The AT(1)R-ZD7155 complex structure revealed key structural features of AT(1)R and critical interactions for ZD7155 binding. Docking simulations of the clinically used ARBs into the AT(1)R structure further elucidated both the common and distinct binding modes for these anti-hypertensive drugs. Our results thereby provide fundamental insights into AT(1)R structure-function relationship and structure-based drug design.


Figures

Figure 1
Figure 1. AT1R construct design and functional characterization
(A) Snake plot of the BRIL-AT1R construct used for crystallization. Residues that occupy the most conserved positions on each helix in class A GPCRs (X.50; B&W scheme) are colored in green. The four cysteine residues that form two disulfide bonds in the extracellular region are colored in orange. Three critical residues for ZD7155 binding are colored in red. All other residues that interact with ZD7155 are colored in blue. Critical residues/motifs for AT1R activation are colored in purple. Truncated residues are shown as light gray, and residues that do not have sufficient density in the structure and therefore were not modelled are shown in dark gray circles. (B) Saturation binding of the non-peptide antagonist 3H-candesartan to the wild type HA-AT1R, ΔBRIL-AT1R, and BRIL-AT1R. (C) Competition binding of ZD7155 to the wild-type HA-AT1R, ΔBRIL-AT1R, and BRIL-AT1R, performed by displacement of 3H-candesartan. (D) Intracellular calcium responses for the wild-type HA-AT1R, BRIL-AT1R, and ΔBRIL-AT1R. The agonist AngII and the antagonist ZD7155 dose-response curves for HA-AT1R (circles), BRIL-AT1R (squares), and ΔBRIL-AT1R (diamonds) are shown in closed and open symbols, respectively.
Figure 2
Figure 2. Overview of AT1R-ZD7155 architecture and structural comparison with other peptide GPCRs
(A) Overall AT1R structure is shown as blue cartoon. ZD7155 is shown as spheres with carbon atoms colored green. Membrane boundaries, as defined by the PPM web server (Lomize et al, 2012), are shown as planes made of gray spheres. (B) – (G) superposition of AT1R with chemokine and opioid receptors, chemokine CCR5 receptor – light cyan (PDB ID 4MBS), chemokine CXCR4 receptor – light pink (PDB ID 3ODU), δ-opioid receptor – gray (PDB ID 4N6H), κ-opioid receptor – light green (PDB ID 4DJH), NOP receptor – light orange (PDB ID 4EA3), comparing the whole structure (B), intracellular view (C), extracellular view (D), ECL2 (E), helix VIII (F), and the ligand binding pocket side (G) and top (H) views. See also Figures S1–S2 and Table S1.
Figure 3
Figure 3. Interactions of ZD7155 with AT1R
(A) Cross-section view of AT1R highlighting the shape of the ligand binding pocket. (B) Zoomed-in view of the ligand binding pocket showing all residues within 4 Å from the ligand ZD7155, along with the 2mFo-DFc electron density (blue mesh) contoured at 1 σ level. In (A) and (B) ZD7155 is shown as sticks with yellow carbons. (C) Schematic representation of interactions between AT1R and ZD7155. Hydrogen bonds/salt bridges are shown as red dashed lines. The residues shown by mutagenesis to be critical for ligand binding are labeled red, those that are important for either peptide or non-peptide ligands binding are labeled in yellow, and the residues that discriminate between peptide and nonpeptide ligands are labeled in purple. See also Figure S2 and Table S2.
Figure 4
Figure 4. Docking of different anti-hypertensive drugs in the AT1R crystal structure
The ARBs are shown as sticks with cyan carbons. The AT1R residues interacting with ligands are labeled and shown as yellow lines, with the key residues highlighted in red. The hydrogen bonds are shown as black dashed lines. See also Table S3.
Figure 5
Figure 5. Common and distinct binding modes of different ARBs with AT1R
The ARB chemical groups that are engaged in hydrogen bonding/salt bridging with Arg167ECL2 and Tyr351.39 are marked by red and purple dashed circles, respectively. Pale red and pale purple dotted circles are used for groups with sub-optimal contacts as suggested by docking. The heterocyclic groups forming π-π contacts with Trp842.60 are surrounded by light-blue dashed circles. The biphenyl-linker groups for hydrophobic interactions are outlined by green dashed boxes, and the two-four carbons tails, extending into the hydrophobic pocket formed by Tyr351.39, Phe772.53, Val1083.32, Ile2887.39, and Tyr2927.43, are outlined by dark-blue dashed circles. Specific interactions of candesartan and telmisartan with Lys1995.42 are shown by red arrows. Specific interactions between Tyr92ECL1 and telmisartan, and between Ile2887.39 and eprosartan are highlighted by orange dashed circles. See also Figure S3.
Figure 6
Figure 6. Critical residues for AT1R activation
(A) A cluster of aromatic residues (F772.53, W2536.48 and Y2927.43) is located just below ZD7155, bridging the ligand binding pocket with a cluster of polar residues that includes several highly conserved in class A GPCR residues (N461.50, D742.50), along with N1113.35 and N2957.46 forming hydrogen bonds that hold helices III and VII together. (B) Superposition of the AT1R structure with the high-resolution structure of δ-OR (PDB ID 4N6H) reveals a high structural conservation of the putative sodium-binding site.

Comment in

  • Serial femtosecond crystallography datasets from G protein-coupled receptors.
    White TA, Barty A, Liu W, Ishchenko A, Zhang H, Gati C, Zatsepin NA, Basu S, Oberthür D, Metz M, Beyerlein KR, Yoon CH, Yefanov OM, James D, Wang D, Messerschmidt M, Koglin JE, Boutet S, Weierstall U, Cherezov V. White TA, et al. Sci Data. 2016 Aug 1;3:160057. doi: 10.1038/sdata.2016.57. Sci Data. 2016. PMID: 27479354 Free PMC article.

References

    1. Akazawa H, Yano M, Yabumoto C, Kudo-Sakamoto Y, Komuro I. Angiotensin II type 1 and type 2 receptor-induced cell signaling. Curr Pharm Des. 2013;19:2988–2995. - PubMed
    1. Balakumar P, Bishnoi HK, Mahadevan N. Telmisartan in the management of diabetic nephropathy: a contemporary view. Curr Diabetes Rev. 2012;8:183–190. - PubMed
    1. Balakumar P, Jagadeesh G. Structural determinants for binding, activation and functional selectivity of the AT1 receptor. J Mol Endocrinol. 2014;53:R71–R92. - PubMed
    1. Ballesteros JA, Weinstein H. Integrated methods for the construction of three dimensional models and computational probing of structure–function relations in G-protein coupled receptors. Methods Neurosci. 1995;25:366–428.
    1. Barty A, Kirian RA, Maia FR, Hantke M, Yoon CH, White TA, Chapman H. Cheetah: software for high-throughput reduction and analysis of serial femtosecond X-ray diffraction data. J Appl Crystallogr. 2014;47:1118–1131. - PMC - PubMed

Publication types

MeSH terms

Associated data