. 2015 May 4;25(9):1146-56.
doi: 10.1016/j.cub.2015.03.008. Epub 2015 Apr 23.

Molecular signatures of major depression

Affiliations

Molecular signatures of major depression

Na Cai et al. Curr Biol. .

Abstract

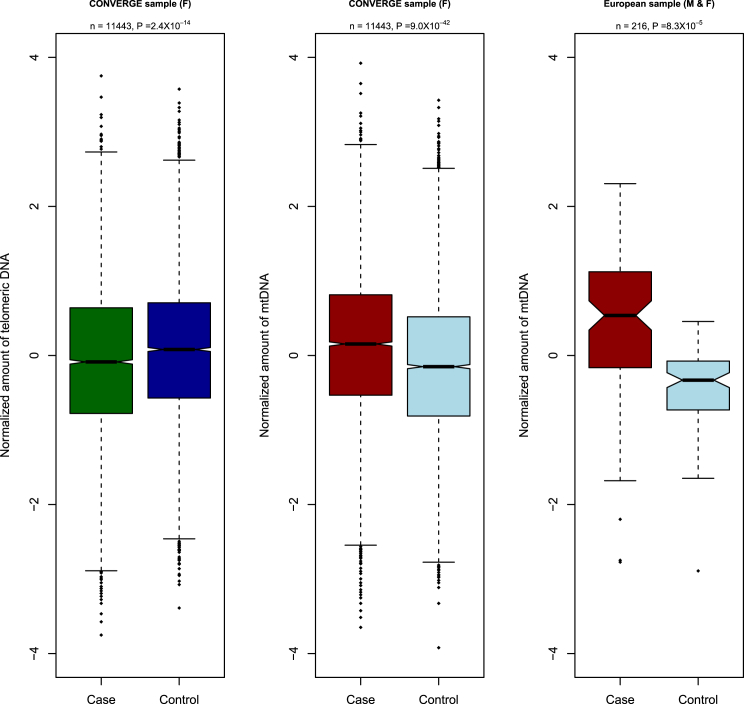
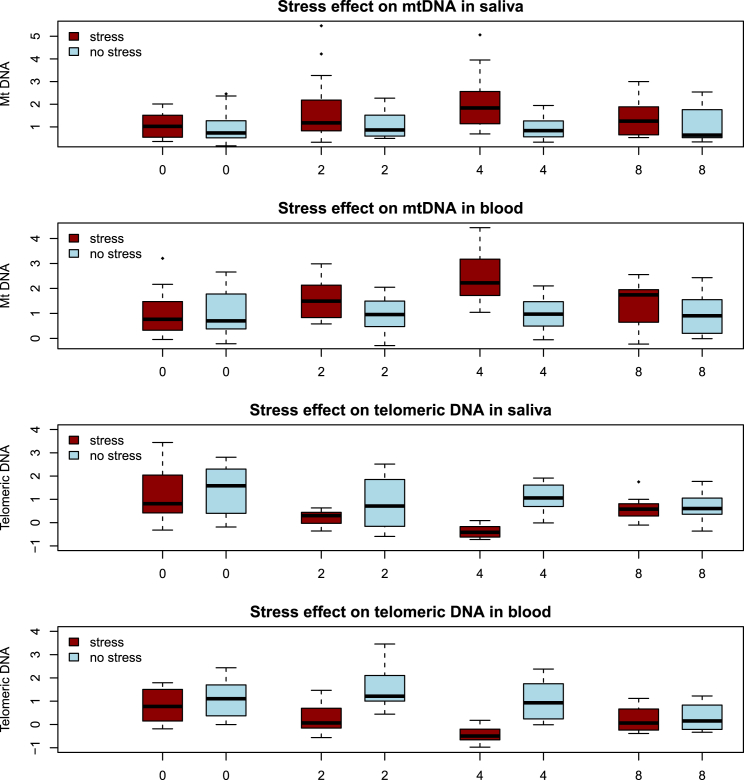
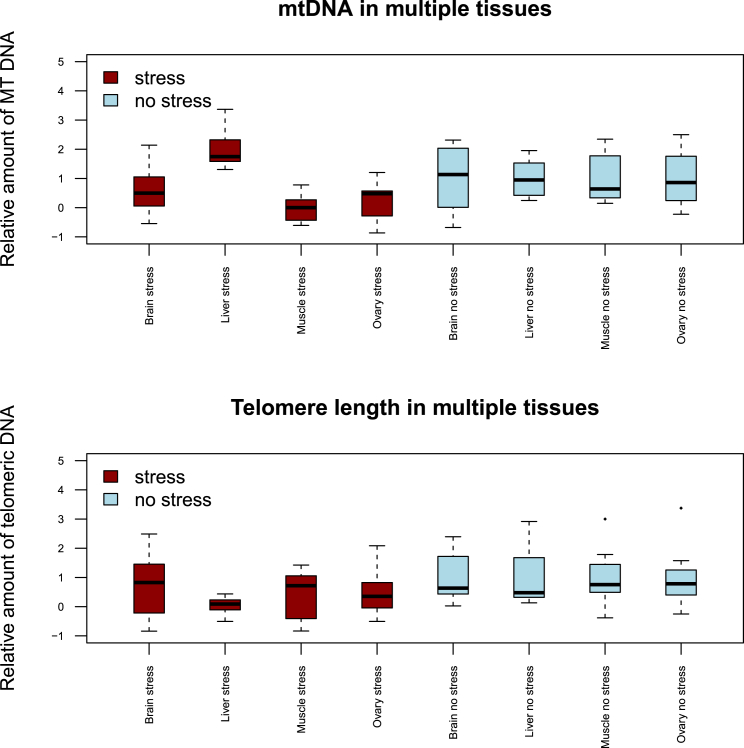
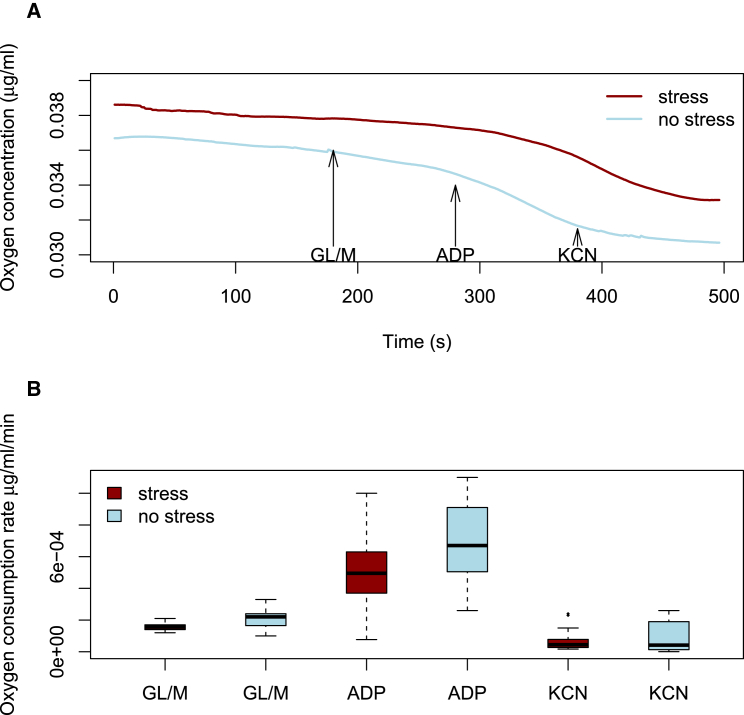
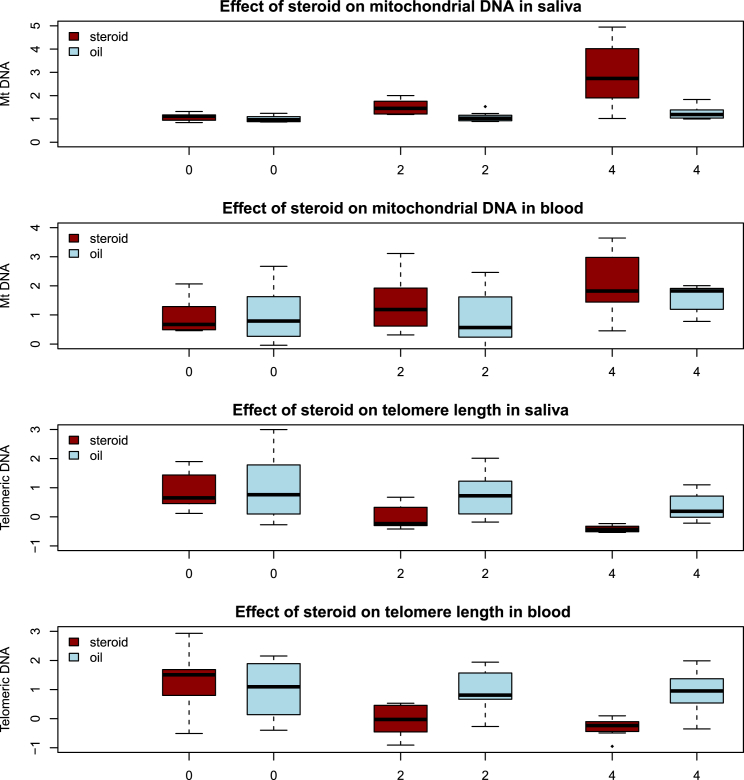
Adversity, particularly in early life, can cause illness. Clues to the responsible mechanisms may lie with the discovery of molecular signatures of stress, some of which include alterations to an individual's somatic genome. Here, using genome sequences from 11,670 women, we observed a highly significant association between a stress-related disease, major depression, and the amount of mtDNA (p = 9.00 × 10(-42), odds ratio 1.33 [95% confidence interval [CI] = 1.29-1.37]) and telomere length (p = 2.84 × 10(-14), odds ratio 0.85 [95% CI = 0.81-0.89]). While both telomere length and mtDNA amount were associated with adverse life events, conditional regression analyses showed the molecular changes were contingent on the depressed state. We tested this hypothesis with experiments in mice, demonstrating that stress causes both molecular changes, which are partly reversible and can be elicited by the administration of corticosterone. Together, these results demonstrate that changes in the amount of mtDNA and telomere length are consequences of stress and entering a depressed state. These findings identify increased amounts of mtDNA as a molecular marker of MD and have important implications for understanding how stress causes the disease.


Figures

Figure 1
Figure 1
Two Molecular Markers of Depression: Mitochondrial DNA and Telomere Length Left: Boxplot of normalized measure of mean telomere length (vertical axis) for cases and controls in the CONVERGE study. Middle: Boxplot of the normalized amount of mtDNA (vertical axis) in cases and controls in the CONVERGE study. Right: Boxplot of the normalized amount of mtDNA (vertical axis) in cases and controls in the GENDEP/DECC studies (labeled IOP).
Figure 2
Figure 2
Effect of Chronic Stress on mtDNA in Saliva and Blood of Mice Boxplot of relative mtDNA changes and relative mean telomere length over time in mice exposed to stress (red) and controls (blue). The vertical axis shows the amount of DNA, assessed by qPCR, relative to the mean of the values obtained before stress was imposed (week 0). The mean of week 0 is set to 1, so that results from subsequent weeks are fold changes relative to pre-stress levels. The horizontal axis is time in weeks from the beginning of the experiment. Stress was discontinued after week 4, so week 8 shows results for previously stressed animals after 4 weeks of living in a home cage. At the 4 week time point, the amount of mtDNA in blood and saliva was significantly greater in stressed animals (t test p = 6.1 × 10−5 and p = 0.0036, respectively). Also at the 4 week time point, relative mean telomere lengths in stressed mice were significantly lower in saliva (t test p = 0.0001) and blood (t test p = 0.0017) as compared to non-stressed mice. Differences between stressed and non-stressed mice in both measures were not significant at the start of the experiment or at the 8 week time point.
Figure 3
Figure 3
Alterations of mtDNA in Different Tissues after 4 Weeks of Stress Top: Assessment of mtDNA in four tissues. Bottom: Assessment of telomere length in four tissues. The vertical axis shows the amount of mtDNA or telomere length assessed by qPCR, relative to the mean of the values obtained for control animals (no stress). The horizontal axis gives the names of the tissues for the two conditions: stress (red) and no stress (blue).
Figure 4
Figure 4
The Oxygen Consumption of Mouse Liver after Stress Administration (A) Oxygen concentration (vertical axis) detected per second (horizontal axis) per μg of mitochondria. The slope of the curve indicates the rate of oxygen consumption. Glutamate/malate (GL/MA) is added at 3 min after addition of isolated mitochondria, and oxygen consumption was assessed after substrate addition. The addition of ADP (100 s later) initiates active respiration while potassium cyanide (KCN) (100 s later) inhibits all mitochondrial function. (B) Oxygen consumption rate per μg of mitochondria after the addition of the three compounds, comparing stressed and non-stressed animals.
Figure 5
Figure 5
Effect of Daily Subcutaneous Injection of Corticosterone on mtDNA and Telomere Length in Saliva and Blood in Mice Boxplot of relative amount of mtDNA and relative mean telomere length over time in mice injected with corticosterone (red) and controls injected with the same volumes of oil vehicle (blue). The vertical axis shows the amount of mtDNA assessed by qPCR, relative to the mean of the values obtained before corticosterone was injected (week 0). The mean of week 0 is set to 1, so that results from subsequent weeks are fold changes relative to pre-stress levels. The horizontal axis is time in weeks from the beginning of the experiment. After 4 weeks, the amount of mtDNA levels in mice injected with corticosterone was significantly higher in saliva (t test p = 0.011) and blood (t test p = 0.0013) as compared to mice injected with oil vehicle; relative mean telomere lengths were significantly reduced in both tissues (in saliva: t test p = 0.0023; in blood: t test p = 0.0016) in mice injected with corticosterone as compared to mice injected with oil vehicle.

Comment in

References

    1. Gluckman P.D., Hanson M.A., Cooper C., Thornburg K.L. Effect of in utero and early-life conditions on adult health and disease. N. Engl. J. Med. 2008;359:61–73. - PMC - PubMed
    1. Rich-Edwards J.W., Spiegelman D., Lividoti Hibert E.N., Jun H.J., Todd T.J., Kawachi I., Wright R.J. Abuse in childhood and adolescence as a predictor of type 2 diabetes in adult women. Am. J. Prev. Med. 2010;39:529–536. - PMC - PubMed
    1. Nanni V., Uher R., Danese A. Childhood maltreatment predicts unfavorable course of illness and treatment outcome in depression: a meta-analysis. Am. J. Psychiatry. 2012;169:141–151. - PubMed
    1. Dong M., Giles W.H., Felitti V.J., Dube S.R., Williams J.E., Chapman D.P., Anda R.F. Insights into causal pathways for ischemic heart disease: adverse childhood experiences study. Circulation. 2004;110:1761–1766. - PubMed
    1. Shonkoff J.P., Garner A.S., Committee on Psychosocial Aspects of Child and Family Health. Committee on Early Childhood, Adoption, and Dependent Care. Section on Developmental and Behavioral Pediatrics The lifelong effects of early childhood adversity and toxic stress. Pediatrics. 2012;129:e232–e246. - PubMed

Publication types