. 2015 Apr 22;13(4):2505-25.
doi: 10.3390/md13042505.

Xyloketal B suppresses glioblastoma cell proliferation and migration in vitro through inhibiting TRPM7-regulated PI3K/Akt and MEK/ERK signaling pathways

Affiliations

Xyloketal B suppresses glioblastoma cell proliferation and migration in vitro through inhibiting TRPM7-regulated PI3K/Akt and MEK/ERK signaling pathways

Wen-Liang Chen et al. Mar Drugs. .

Abstract

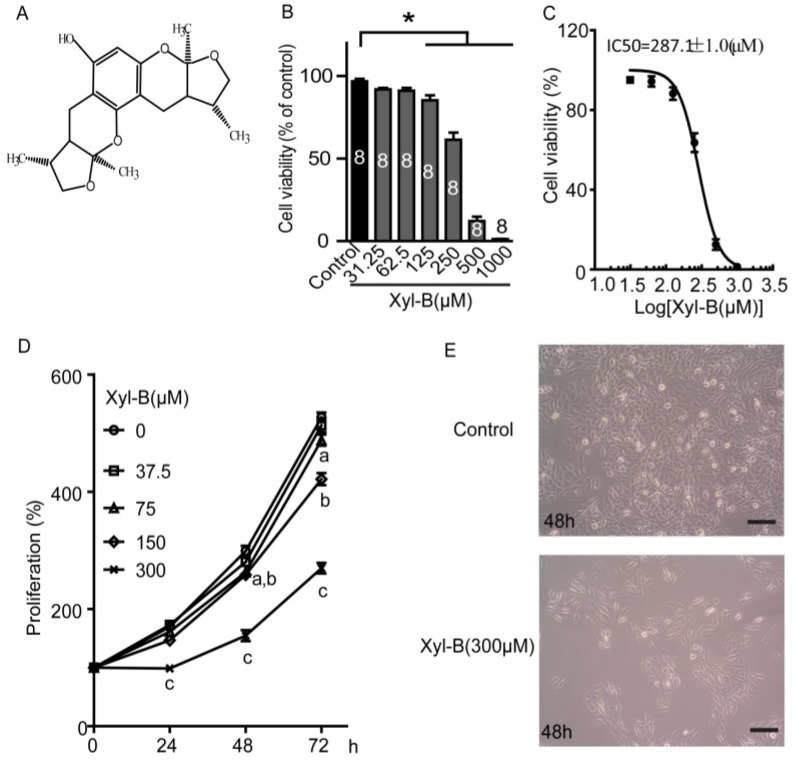
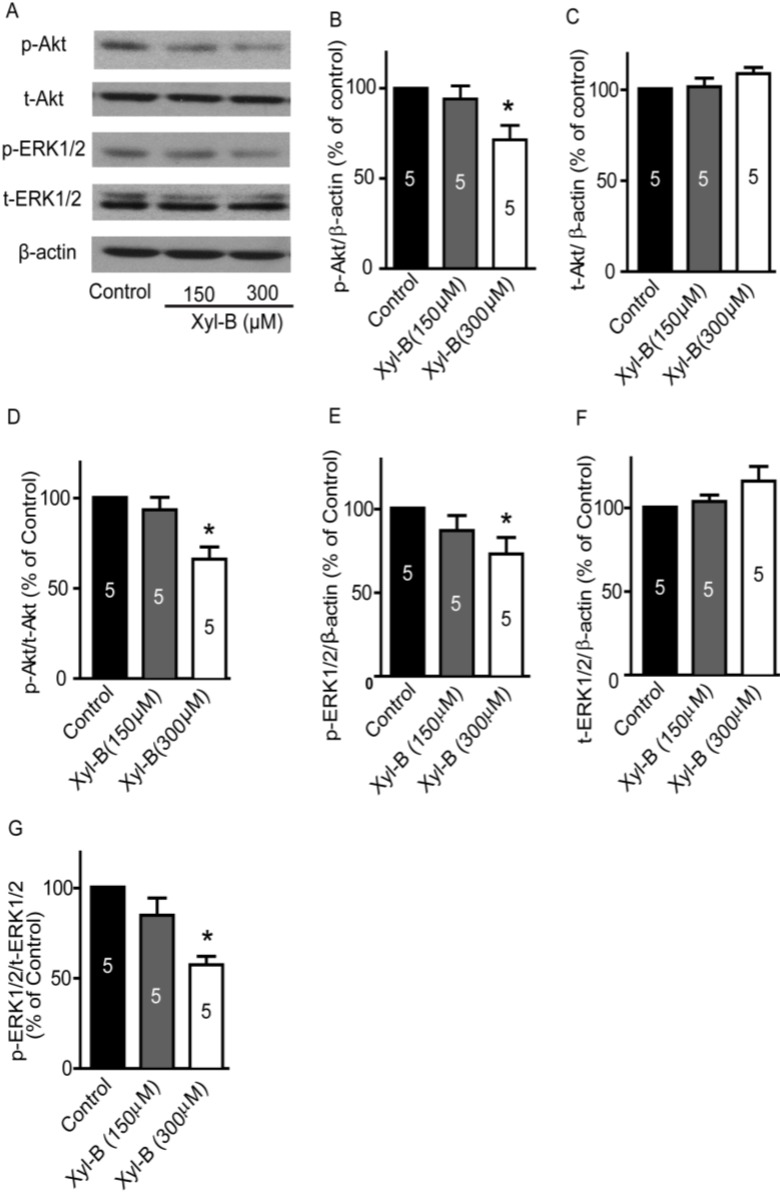
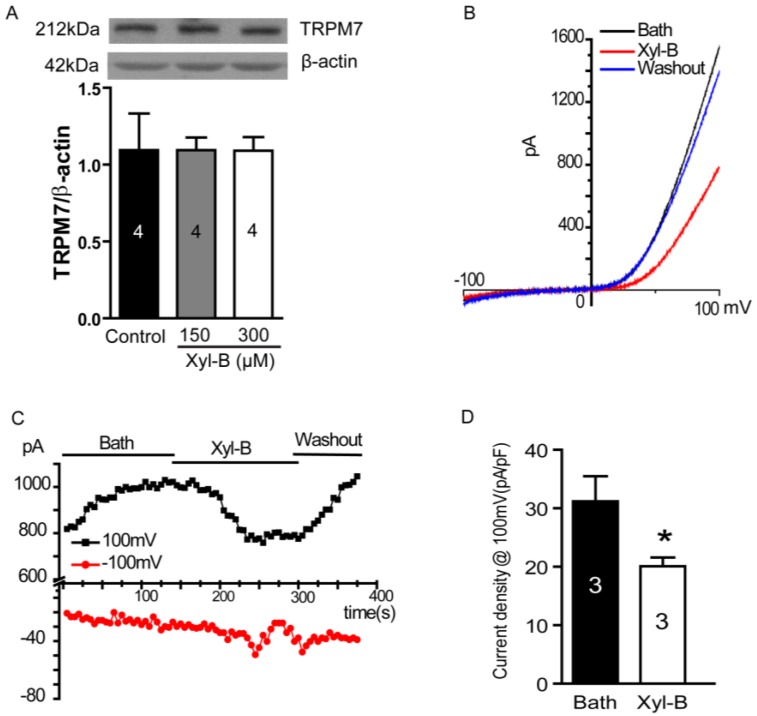
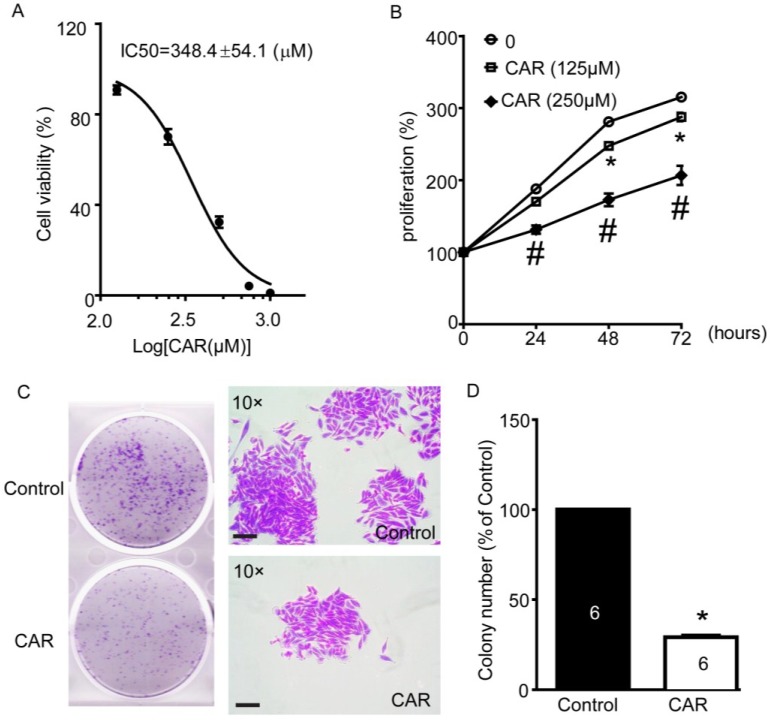
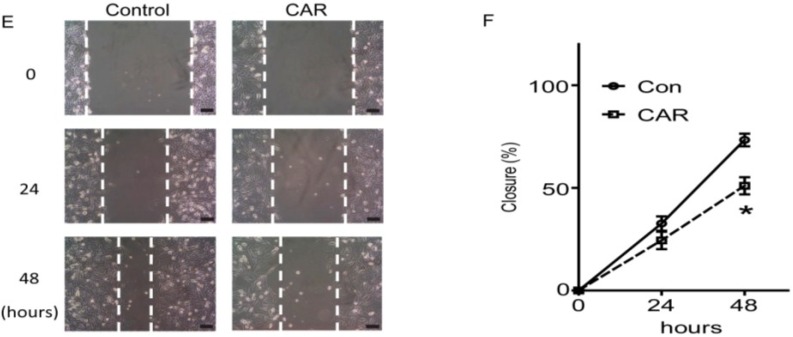
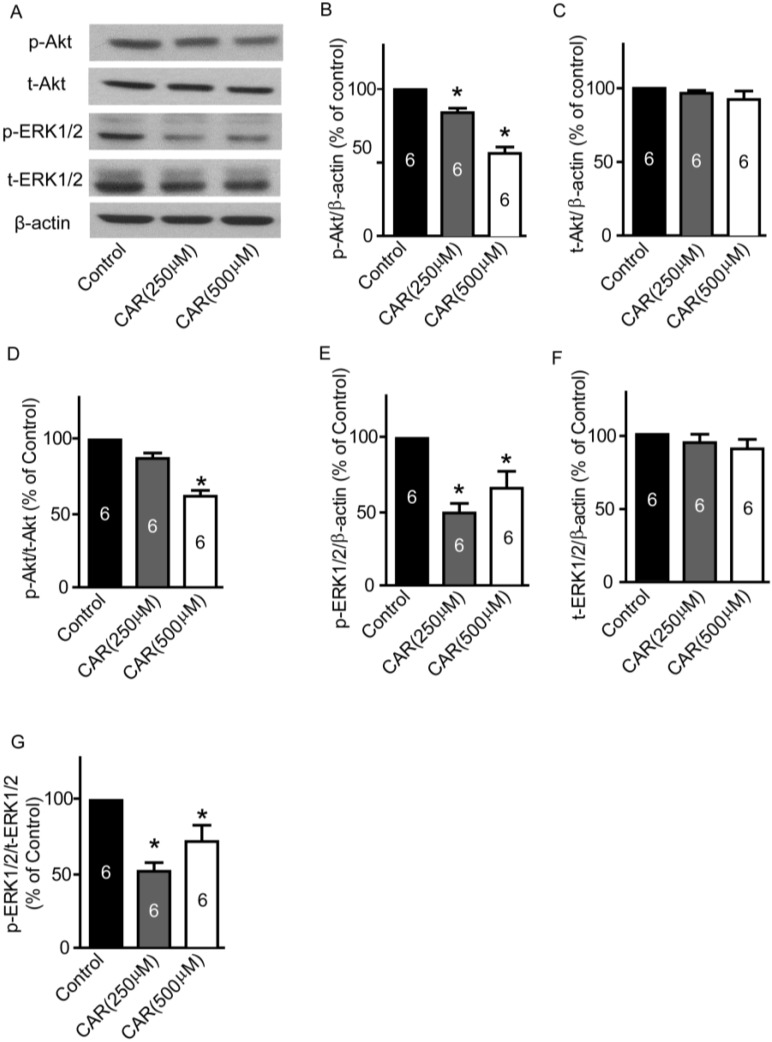
Glioblastoma, the most common and aggressive type of brain tumors, has devastatingly proliferative and invasive characteristics. The need for finding a novel and specific drug target is urgent as the current approaches have limited therapeutic effects in treating glioblastoma. Xyloketal B is a marine compound obtained from mangrove fungus Xylaria sp. (No. 2508) from the South China Sea, and has displayed antioxidant activity and protective effects on endothelial and neuronal oxidative injuries. In this study, we used a glioblastoma U251 cell line to (1) explore the effects of xyloketal B on cell viability, proliferation, and migration; and (2) investigate the underlying molecular mechanisms and signaling pathways. MTT assay, colony formation, wound healing, western blot, and patch clamp techniques were employed. We found that xyloketal B reduced cell viability, proliferation, and migration of U251 cells. In addition, xyloketal B decreased p-Akt and p-ERK1/2 protein expressions. Furthermore, xyloketal B blocked TRPM7 currents in HEK-293 cells overexpressing TRPM7. These effects were confirmed by using a TRPM7 inhibitor, carvacrol, in a parallel experiment. Our findings indicate that TRPM7-regulated PI3K/Akt and MEK/ERK signaling is involved in anti-proliferation and migration effects of xyloketal B on U251 cells, providing in vitro evidence for the marine compound xyloketal B to be a potential drug for treating glioblastoma.


Figures

Figure 1
Figure 1
Effects of xyloketal B (Xyl-B) on cell viability and proliferation of U251 cells. (A) Chemical structure of xyloketal B; (B) Xyloketal B concentration-dependently reduced the cell viability of U251 cell line. U251 cells were incubated with xyloketal B (31.25–1000 μM) for 24 h, following MTT assay. * p < 0.05, n = 8 independent experiments; (C) Nonlinear curve fit for dose-response of xyloketal B treatment in U251 cells for 24 h. IC50 = 287.1 ± 1.0 μM; (D) Xyloketal B inhibited proliferation of U251 cell line. U251 cells were treated with xyloketal B for 24, 48, and 72 h, and then cell proliferation was detected by MTT assay; a, b, and c represent 75, 150, and 300 μm xyloketal B versus the control group, respectively, p < 0.05, n = 6 independent experiments; (E) Representative images of U251 cells with or without xyloketal B treatment for 48 h showed reduction of cell numbers in xyloketal B treatment group. Cell images were obtained with a digital camera connected to a phase-contrast Olympus microscope (CKX41, ×10 objectives). n = 3; (F) Xyloketal B inhibited colony formation of U251 cells. Cells were plated in six-well culture plates and treated with xyloketal B (300 μM) for 24 h. The culture medium was changed at regular time intervals. Colony formation of U251 cells was detected by crystal violet staining at seven days after xyloketal B treatment. Images were taken using a scanner (CanoScan LiDE 700F, left panel) and a digital camera connected to a phase-contrast Olympus microscope (CKX41, ×10 objectives, right panel). Colony numbers were calculated using Image-Pro Plus software. Representative images were shown. n = 3; (G) Statistic analysis of colony formation results. Xyloketal B significantly reduced the colony formation of the U251 cells. * p < 0.05, n = 3. All scale bars = 150 μm.
Figure 1
Figure 1
Effects of xyloketal B (Xyl-B) on cell viability and proliferation of U251 cells. (A) Chemical structure of xyloketal B; (B) Xyloketal B concentration-dependently reduced the cell viability of U251 cell line. U251 cells were incubated with xyloketal B (31.25–1000 μM) for 24 h, following MTT assay. * p < 0.05, n = 8 independent experiments; (C) Nonlinear curve fit for dose-response of xyloketal B treatment in U251 cells for 24 h. IC50 = 287.1 ± 1.0 μM; (D) Xyloketal B inhibited proliferation of U251 cell line. U251 cells were treated with xyloketal B for 24, 48, and 72 h, and then cell proliferation was detected by MTT assay; a, b, and c represent 75, 150, and 300 μm xyloketal B versus the control group, respectively, p < 0.05, n = 6 independent experiments; (E) Representative images of U251 cells with or without xyloketal B treatment for 48 h showed reduction of cell numbers in xyloketal B treatment group. Cell images were obtained with a digital camera connected to a phase-contrast Olympus microscope (CKX41, ×10 objectives). n = 3; (F) Xyloketal B inhibited colony formation of U251 cells. Cells were plated in six-well culture plates and treated with xyloketal B (300 μM) for 24 h. The culture medium was changed at regular time intervals. Colony formation of U251 cells was detected by crystal violet staining at seven days after xyloketal B treatment. Images were taken using a scanner (CanoScan LiDE 700F, left panel) and a digital camera connected to a phase-contrast Olympus microscope (CKX41, ×10 objectives, right panel). Colony numbers were calculated using Image-Pro Plus software. Representative images were shown. n = 3; (G) Statistic analysis of colony formation results. Xyloketal B significantly reduced the colony formation of the U251 cells. * p < 0.05, n = 3. All scale bars = 150 μm.
Figure 2
Figure 2
Effects of xyloketal B on the migration of U251 cells. (A) Xyloketal B inhibited U251 cell migration. The representative images of wound healing assay were displayed. After being scratched with a 200-μL pipette tip, U251 cells were treated with xyloketal B (300 μM) or vehicle (0.1% DMSO), then images were taken at 0, 24, and 48 h, and gap closure was analyzed; (B) Statistical analysis of migration results. Xyloketal B significantly inhibited the cell migration of the U251 cells in both timelines tested. * p < 0.05, n = 3. Scale bars = 150 μM.
Figure 3
Figure 3
Effects of xyloketal B on p-ERK, t-ERK, p-Akt, and t-Akt protein expressions. U251 cells were treated with xyloketal B (150 and 300 μM) for 24 h, and then the protein expression profile was detected by western blots. (A) Representative images of western blotting results; (B) Xyloketal B (300 μM) treatment significantly reduced p-Akt protein expression. * p < 0.05, n = 5; (C) Xyloketal B did not significantly alter the t-Akt protein expression; (D) Ratio of p-Akt/t-Akt decreased in the xyloketal B (300 μM) treatment group. * p < 0.05, n = 5; (E) Xyloketal B (300 μM) treatment significantly reduced p-ERK1/2 protein expression. * p < 0.05, n = 5; (F) Xyloketal B did not significantly alter t-ERK1/2 protein expression; (G) Ratio of p-ERK1/2/t-ERK1/2 decreased in xyloketal B (300 μM) treatment group. * p < 0.05, n = 5.
Figure 4
Figure 4
Effects of xyloketal B on TRPM7 currents in HEK-293 cell over-expressing TRPM7. (A) Xyloketal B did not significantly regulate TRPM7 protein expressions in U251 cells. U251 cells were treated with xyloketal B (150 and 300 μM) for 24 h followed by detection with western blotting. n = 4; (B) Xyloketal B (300 μM) blocked TRPM7 currents. TRPM7 protein overexpression in HEK-293 cells was induced by treatment with tetracycline (Tet, 1 μg/mL) for 24 h. Then, TRPM7 currents were recorded using the whole-cell patch-clamp technology with ramp from −100 mV to 100 mV. Representative I–V traces were shown. n = 3; (C) Representative time course of the inward and outward current of TRPM7 at −100 and 100 mV. n = 3; (D) Statistical analysis of patch-clamp experiments. Xyloketal B (300 μM) perfusion significantly reduced the outward current of TRPM7. * p < 0.05, n = 3.
Figure 5
Figure 5
Effects of TRPM7 inhibitor carvacrol (CAR) on viability, proliferation, and migration of U251 cells. (A) Carvacrol reduced the viability of U251 cells. U251 cells were treated with various concentrations of carvacrol for 24 h following detection with MTT assay. Nonlinear curve fitting for dose-response of carvacrol treatment was displayed and IC50 was calculated as 348.4 ± 54.1 μM. n = 8 independent experiments; (B) Carvacrol inhibited the proliferation of U251 cells. U251 cells were treated with carvacrol (125 and 250 μM) or vehicle control (0.1% DMSO) for 24, 48, or 72 h. Cell proliferation was measured using MTT assay. * p < 0.05, carvacrol (125 μM) group versus control group; # p < 0.05, cavarcrol (250 μM) group versus control group, n = 8 independent experiments; (C) Carvacrol inhibited colony formation of U251 cells. Cells were plated in six-well culture plates and treated with carvacrol (500 μM) for 24 h. Colony formation of U251 cells was detected by crystal violet staining at seven days after carvacrol treatment. Images were taken using a scanner (CanoScan LiDE 700F, left panel) and a digital camera connected to a phase-contrast Olympus microscope (CKX41, ×10 objectives, right panel). Colony numbers were calculated using Image-Pro Plus software. Representative images were shown. n = 6; (D) Statistic analysis of colony formation results. Carvacrol B significantly reduced the colony formation of the U251 cells. * p < 0.05, n = 6; (E) Carvacrol inhibited U251 cell migration. The representative images of wound healing were displayed. After being scratched with 200-μL pipette tip, U251 cells were treated with carvacrol (500 μM) or vehicle (0.1% DMSO), then images were taken at 0, 24, and 48 h and gap closure was analyzed; (F) Statistical analysis of migration results. Carvacrol significantly inhibited the cell migration of the U251 cells at 48 h timeline. * p < 0.05, n = 4. All scale bars = 150 μM.
Figure 5
Figure 5
Effects of TRPM7 inhibitor carvacrol (CAR) on viability, proliferation, and migration of U251 cells. (A) Carvacrol reduced the viability of U251 cells. U251 cells were treated with various concentrations of carvacrol for 24 h following detection with MTT assay. Nonlinear curve fitting for dose-response of carvacrol treatment was displayed and IC50 was calculated as 348.4 ± 54.1 μM. n = 8 independent experiments; (B) Carvacrol inhibited the proliferation of U251 cells. U251 cells were treated with carvacrol (125 and 250 μM) or vehicle control (0.1% DMSO) for 24, 48, or 72 h. Cell proliferation was measured using MTT assay. * p < 0.05, carvacrol (125 μM) group versus control group; # p < 0.05, cavarcrol (250 μM) group versus control group, n = 8 independent experiments; (C) Carvacrol inhibited colony formation of U251 cells. Cells were plated in six-well culture plates and treated with carvacrol (500 μM) for 24 h. Colony formation of U251 cells was detected by crystal violet staining at seven days after carvacrol treatment. Images were taken using a scanner (CanoScan LiDE 700F, left panel) and a digital camera connected to a phase-contrast Olympus microscope (CKX41, ×10 objectives, right panel). Colony numbers were calculated using Image-Pro Plus software. Representative images were shown. n = 6; (D) Statistic analysis of colony formation results. Carvacrol B significantly reduced the colony formation of the U251 cells. * p < 0.05, n = 6; (E) Carvacrol inhibited U251 cell migration. The representative images of wound healing were displayed. After being scratched with 200-μL pipette tip, U251 cells were treated with carvacrol (500 μM) or vehicle (0.1% DMSO), then images were taken at 0, 24, and 48 h and gap closure was analyzed; (F) Statistical analysis of migration results. Carvacrol significantly inhibited the cell migration of the U251 cells at 48 h timeline. * p < 0.05, n = 4. All scale bars = 150 μM.
Figure 6
Figure 6
Effects of carvacrol (CAR) on p-ERK, t-ERK, p-Akt, and t-Akt protein expressions. U251 cells were treated with carvacrol (250 and 500 μM) for 24 h, and then protein expressions were detected by western blotting. (A) Representative images of western blotting results; (B) Carvacrol (500 μM) treatment significantly reduced p-Akt protein expression. * p < 0.05, n = 6; (C) Carvacrol did not significantly alter t-Akt protein expression; (D) Ratio of p-Akt/t-Akt decreased in carvacrol (500 μM) treatment group. * p < 0.05, n = 6; (E) Carvacrol (250 and 500 μM) treatment significantly reduced p-ERK1/2 protein expression. * p < 0.05, n = 6; (F) Carvacrol did not significantly alter t-ERK1/2 protein expression; (G) Ratio of p-ERK1/2/t-ERK1/2 decreased in carvacrol (250 and 500 μM) treatment group. * p < 0.05, n = 6.

References

    1. Stupp R., Hegi M.E., Mason W.P., van den Bent M.J., Taphoorn M.J., Janzer R.C., Ludwin S.K., Allgeier A., Fisher B., Belanger K., et al. Effects of radiotherapy with concomitant and adjuvant temozolomide versus radiotherapy alone on survival in glioblastoma in a randomised phase iii study: 5-Year analysis of the eortc-ncic trial. Lancet Oncol. 2009;10:459–466. doi: 10.1016/S1470-2045(09)70025-7. - DOI - PubMed
    1. Soni D., King J.A., Kaye A.H., Hovens C.M. Genetics of glioblastoma multiforme: Mitogenic signaling and cell cycle pathways converge. J. Clin. Neurosci. 2005;12:1–5. doi: 10.1016/j.jocn.2004.04.001. - DOI - PubMed
    1. Leon S.P., Zhu J., Black P.M. Genetic aberrations in human brain tumors. Neurosurgery. 1994;34:708–722. doi: 10.1227/00006123-199404000-00021. - DOI - PubMed
    1. Fleming T.P., Saxena A., Clark W.C., Robertson J.T., Oldfield E.H., Aaronson S.A., Ali I.U. Amplification and/or overexpression of platelet-derived growth factor receptors and epidermal growth factor receptor in human glial tumors. Cancer Res. 1992;52:4550–4553. - PubMed
    1. Pelloski C.E., Lin E., Zhang L., Yung W.K., Colman H., Liu J.L., Woo S.Y., Heimberger A.B., Suki D., Prados M., et al. Prognostic associations of activated mitogen-activated protein kinase and akt pathways in glioblastoma. Clin. Cancer Res. 2006;12:3935–3941. doi: 10.1158/1078-0432.CCR-05-2202. - DOI - PubMed

Publication types

MeSH terms

LinkOut - more resources