. 2015 May 6;86(3):755-67.
doi: 10.1016/j.neuron.2015.03.048. Epub 2015 Apr 23.

Sensory Cortical Control of a Visually Induced Arrest Behavior via Corticotectal Projections

Affiliations

Sensory Cortical Control of a Visually Induced Arrest Behavior via Corticotectal Projections

Feixue Liang et al. Neuron. .

Abstract

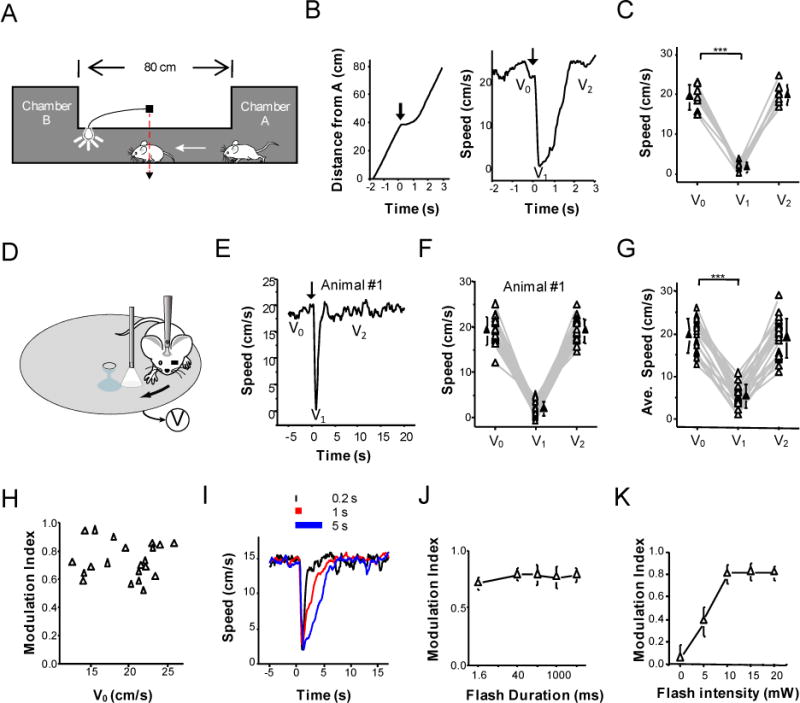
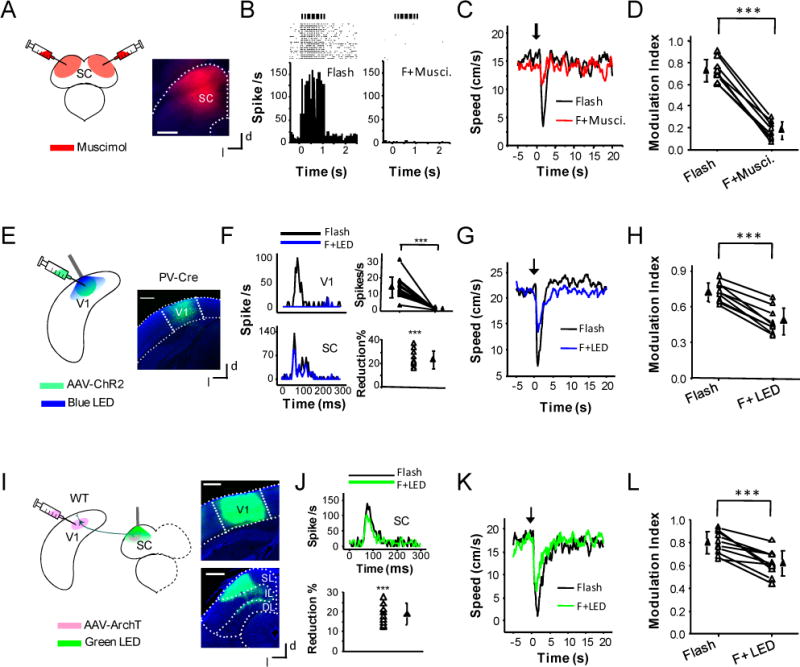
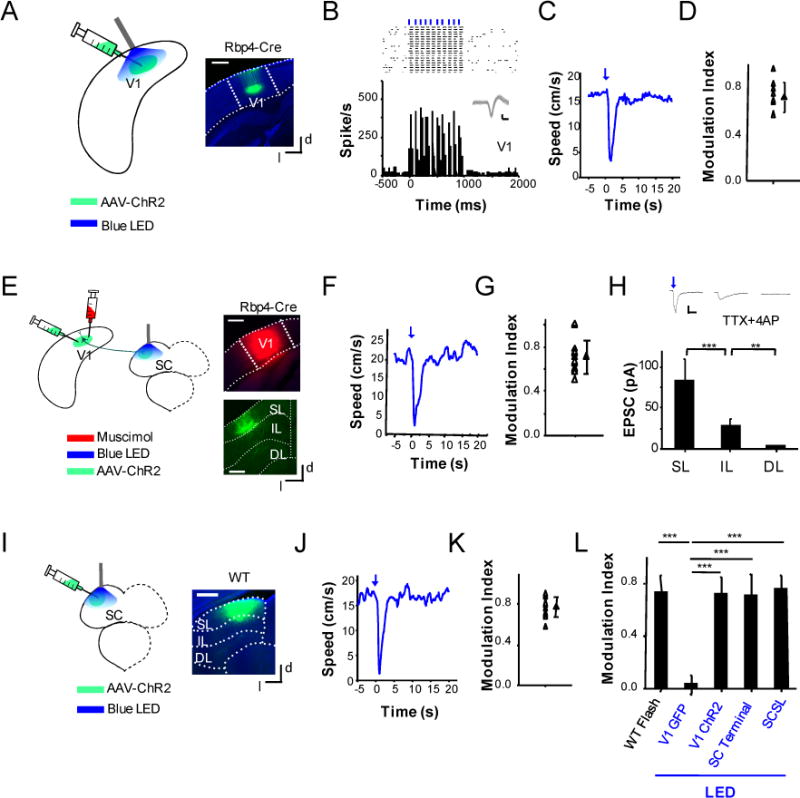
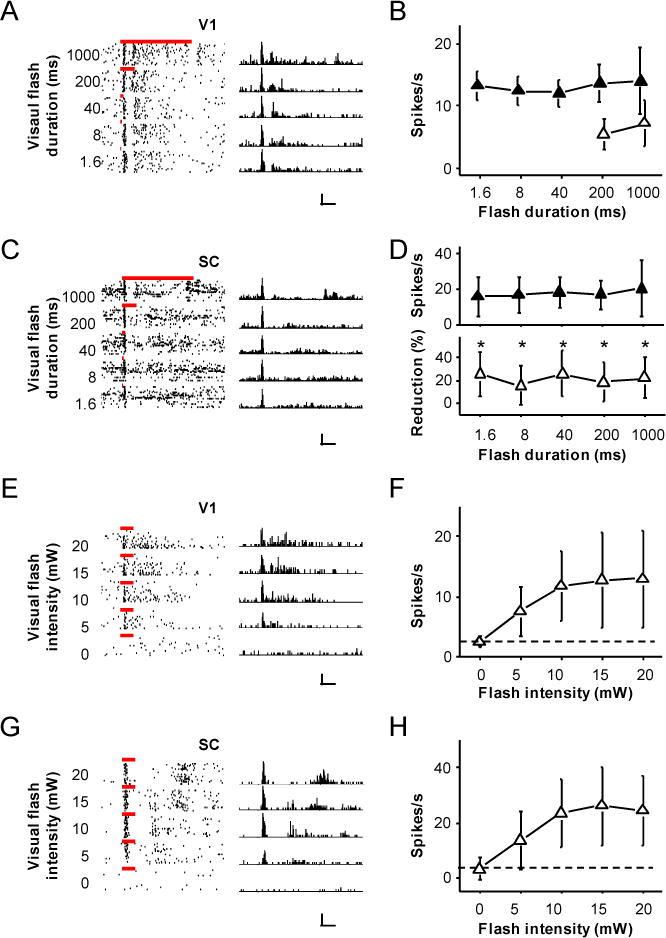
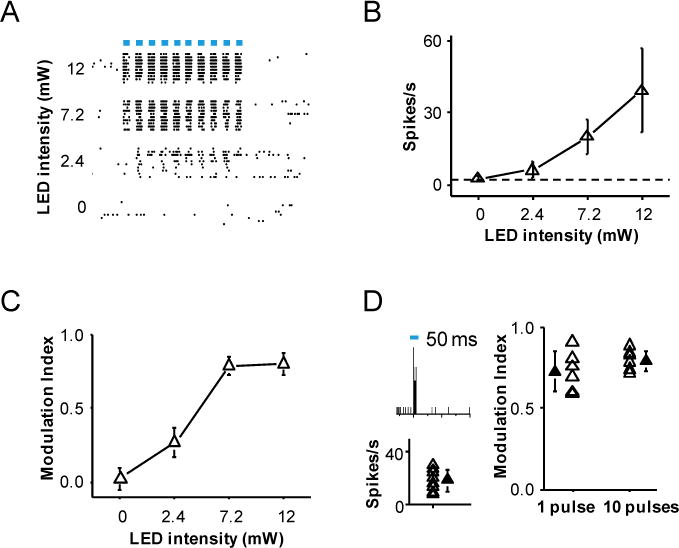
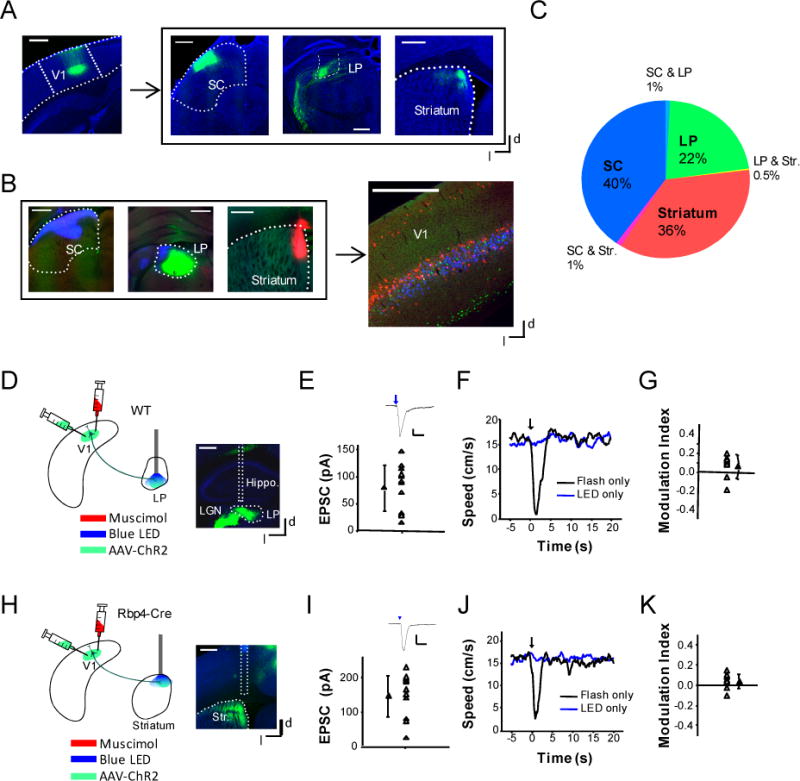
Innate defense behaviors (IDBs) evoked by threatening sensory stimuli are essential for animal survival. Although subcortical circuits are implicated in IDBs, it remains largely unclear whether sensory cortex modulates IDBs and what the underlying neural pathways are. Here, we show that optogenetic silencing of corticotectal projections from layer 5 (L5) of the mouse primary visual cortex (V1) to the superior colliculus (SC) significantly reduces an SC-dependent innate behavior (i.e., temporary suspension of locomotion upon a sudden flash of light as short as milliseconds). Surprisingly, optogenetic activation of SC-projecting neurons in V1 or their axon terminals in SC sufficiently elicits the behavior, in contrast to other major L5 corticofugal projections. Thus, via the same corticofugal projection, visual cortex not only modulates the light-induced arrest behavior, but also can directly drive the behavior. Our results suggest that sensory cortex may play a previously unrecognized role in the top-down initiation of sensory-motor behaviors.


Figures

Figure 1
Figure 1. A light-induced temporary arrest behavior
(A) Schematic drawing of a running test. Two housing chambers were connected with a tunnel. While the mouse was running in the tunnel, its passing an infrared sensor (red dash line) triggered a flash of white light (1-s duration) at the end of the tunnel in front of it. The mouse stopped transiently and then resumed running through the tunnel. (B) Left, time course of the distance of the animal from chamber A for a representative mouse. Arrow marks the onset of flash (time zero). Right, running speed of the same animal. V0, V1 and V2 represent the baseline speed, minimum speed due to the suspension of motion and recovered speed respectively. (C) Plot of V0, V1 and V2 for 8 animals. Data points for the same animal are connected with lines. ***, p < 0.001, paired t-test. (D) Head-fixed preparation. The mouse was restrained via a head post and was allowed to run freely on a rotatable plate. While the animal was running, a flash of light was applied via an optic fiber in front of the right eye with the left eye blocked. The running speed (V) was monitored in real time. (E) Record of speed for a representative mouse (averaged over 20 trials). Time zero is the onset of flash. (F) Plot of V0, V1 and V2 over 20 trials for the same animal. Data points for the same trial are connected with lines. (G) Plot of average V0, V1 and V2 for 21 animals. Solid symbol represents mean. Bar = SD. ***, p < 0.001, paired t-test. (H) Plot of modulation index (MI) versus V0. Correlation coefficient = −0.025. (I) Example speed records of a mouse in response to 0.2 s, 1 s and 5 s flash respectively. (J) Comparison of modulation indices under 1.6 ms, 0.04 s, 0.2 s, 1 s, and 5 s flash. There is no significant difference (p > 0.05, one-way ANOVA test, n = 6 animals in each group). Bar = SD. (K) MI versus intensity of flash. Bar = SD. N = 5 animals.
Figure 2
Figure 2. Dependence on SC and modulation by the corticotectal projection to SC
(A) Experimental condition: fluorescent muscimol was injected into the SC bilaterally. Right, image showing the spread of muscimol. Scale bar: 500 μm. d, dorsal; l, lateral. (B) Raster plot (upper) and peri-stimulus spike time histogram (PSTH) for multi-unit spike responses (20 trials, bin size = 5ms) to a train of flashes (50 ms duration, 10 Hz, each pulse marked by a vertical bar) before (left) and after (right) the bilateral injections of muscimol into the SC, recorded in the superficial layer of SC. (C) Average speed profile of a mouse before (black) and after (red) the muscimol injection. (D) Comparison of modulation indices before and after silencing the SC. ***, p < 0.001, paired t-test. N = 8 animals. Data points for the same animal are connected with a line. (E) Experimental condition: AAV-DIO-ChR2 was injected into the V1 region of PV-Cre mice. Weeks later, blue LED light was applied onto the surface of the visual cortex. Right, confocal image of a brain slice showing the expression of ChR2-EYFP in the V1 region (outlined by two dotted lines). Scale bar: 500 μm. (F) Upper left, PSTHs for spike responses (bin size = 2 ms) of a V1 L5 neuron to flash stimulation (0.2 s) without (black) and with (blue) co-applying LED illumination (20 ms pulse duration, 25 Hz, 0.2 s long). Upper right, summary of average spike rates evoked by flash stimulation without (Flash) and with (F+LED) co-applying LED illumination for 13 cells in 5 animals. Lower panel, PSTHs for spike responses of a neuron in the superficial layer of SC to flash stimulation without (black) and with (blue) co-applying LED illumination on the visual cortex (left), and summary of percentage reduction of flash evoked spike rate under co-application of LED illumination for 11 cells in 5 animals (right). ***, p < 0.001, paired t-test. (G) Average speed profile of a mouse without (black) and with (blue) LED illumination on the visual cortex. (H) Summary of modulation indices without and with LED illumination for 9 animals. ***, p < 0.001, paired t-test. (I) Experimental condition: AAV-ArchT was injected into the V1 of wild-type mice. Weeks later, green LED light was applied onto the SC surface. Right, images showing ArchT expression in the V1 region (top) and corticofugal axon terminations in the SC (bottom). Scale: 500 μm. SL: superficial layer; IL, intermediate layer; DL, deep layer. (J) Top, PSTHs for spike responses of a neuron in the superficial layer of SC to flash stimulation (0.2 s) without (black) and with (green) co-applying LED illumination (0.2 s). Bottom, percentage reduction of evoked spike rate under co-application of LED illumination, recorded from 11 cells in 10 animals. ***, p < 0.001, paired t-test. (K) Average speed profile of an example animal without (black) and with (green) LED illumination. (L) Comparison of modulation indices without and with LED illumination for 10 animals. ***, p < 0.001, paired t-test.
Figure 3
Figure 3. V1 can directly drive an arrest behavior via the corticotectal projection to SC
(A) Experimental condition: AAV-DIO-ChR2 was injected into the V1 of Rbp4-Cre mice. Weeks later, blue LED light was applied to the cortical surface. Right, image showing the expression of ChR2 in the V1 region. Scale bar: 500 μm. (B) Top, raster plot of spikes of a V1 L5 neuron in response to 10 pulses of LED light (50 ms pulse duration, 10 Hz). Each blue vertical bar indicates one LED pulse. Bottom, corresponding PSTH. Inset, 50 superimposed individual spike waveforms. Scale: 50 pA, 1 ms. (C) Average speed profile of an example animal in response to LED stimulation alone without flash. (D) Summary of modulation indices resulting from LED stimulation only for 8 animals. (E) Experimental condition: AAV-DIO-ChR2 was injected into the V1 of Rbp4-Cre mice. Weeks later, blue LED light was applied onto the SC while V1 was silenced with muscimol. Right, images showing the spread of muscimol in the cortex (top) and EYFP-labeled corticotectal axons in the SC (bottom). Scale: 500 μm. (F) Average speed profile of an example animal in response to LED illumination (50 ms pulse duration, 10 Hz, 1 s long) on the SC without flash. (G) Summary of modulation indices under LED illumination alone for 12 animals. (H) Average monosynaptic excitatory postsynaptic currents (EPSCs) recorded from SL (n = 14), IL (n = 14) and DL (n = 11) SC neurons in the same slices evoked by optical activation of corticotectal projections. ***, p < 0.001; **, p < 0.01, t-test. Top inset, average EPSCs of example neurons in each corresponding layer of SC. Scale: 25 pA, 30 ms. (I) Experimental condition: AAV-CamKIIa-ChR2 was injected into the superficial layer of SC. Weeks later, blue LED illumination was applied to the SC surface. Right, image showing the expression of ChR2-EYFP in SC. Scale: 500 μm. (J) Average speed profile of an example animal in response to LED illumination on the SC without flash. (K) Summary of modulation indices under LED stimulation alone for 12 animals. (L) Comparison of modulation indices under different conditions. V1 GFP: AAV-GFP was injected into V1, which serves as a control (n = 5 animals). ***, p < 0.001, one-way ANOVA post hoc test.
Figure 4
Figure 4. Characterization of neuronal responses in L5 and SC
(A) Spike responses of a V1 L5 neuron to flash stimulation of different durations. Left, raster plots. Bars mark the duration of flash. Right, corresponding PSTHs (bin size = 10 ms). Scale: 70 Hz, 250 ms. (B) Summary of firing rates at different durations (n = 11 V1 L5 neurons). Solid symbol, firing rate was measured within a 100 ms window after the onset of response. Open symbol, firing rate was measured within a time window equivalent to the length of stimulus duration after the onset of response. Bar = SD. (C) Responses of a SC neuron to flash stimulation of different durations. Scale: 150 Hz, 250 ms. (D) Upper panel, summary of firing rates at different durations (n = 11 SC neurons). Firing rate was measured within a 100 ms window after the onset of response. Lower panel, average percentage reduction of firing rates of SC neurons after silencing the V1 (n = 11). Bar = SD. *, p < 0.05, paired t-test. (E) Responses of a V1 L5 neuron to flash stimulation of different intensities (duration = 200 ms). Scale: 50 Hz, 250 ms. (F) Summary of firing rates at different intensities (n = 10 V1 cells). Dash line indicates spontaneous spike rate. (G) Responses of a SC neuron to flash stimulation of different intensities. Scale: 60 Hz, 250 ms. (F) Summary of firing rates at different intensities (n = 14 SC cells).
Figure 5
Figure 5. Characterization of V1 responses to LED stimulation
(A) Raster plots of spike responses of a ChR2-expressing L5 neuron (Rpb4-Cre) to a train of LED pulses (10 pulses at 10 Hz) at different intensity levels. Bar labels the duration of each LED pulse (50 ms). (B) Summary of firing rates at different intensity levels of LED stimulation (n = 17 V1 L5 neurons). Firing rate was measured within the entire time window for the LED train. (C) MIs measured at different LED intensity levels. Data points for the same animal are connected by lines. N = 7 animals. (D) Left panel, PSTH for spikes of a L5 neuron to one pulse (50 ms) of LED stimulation (top, intensity = 7.2 mW), and summary spike rates of 9 L5 neurons (bottom). Right panel, comparison of MIs measured at one pulse (n = 6) vs. 10 pulses (n = 7) of LED stimulation. Each open symbol represents one animal. Solid symbol represents mean ± SD.
Figure 6
Figure 6. Corticofugal projections to other targets are unlikely account for the arrest behavior
(A) Left, image of ChR2-EYFP expressing neurons in the V1 of a Rbp4-Cre mouse. Right, fluorescence labeled corticofugal axons in the SC, LP, and striatum (outlined) respectively. Scale: 500 μm. (B) Retrograde tracing of corticofugal neurons. Left, retrograde tracers of blue, green and red colors were injected into the superficial SC, LP and dorsomedial striatum respectively. Right, distribution of labeled neurons in the V1. Scale: 500 μm. (C) Quantification of overlap between corticofugal neurons projecting to different targets. Neuron numbers were normalized to the total number of labeled corticofugal neurons. (D) Experimental condition for head-fixed animals: AAV-ChR2 was injected into the V1 of wildtype mice. Weeks later, blue LED light was applied to the LP via an implanted optic fiber and the V1 was silenced by muscimol. Right, image showing the track of the implanted optic fiber. Scale: 500 μm. Hippo., hippocampus. (E) Average monosynaptic EPSC amplitudes recorded from 12 LP neurons (in 5 slices) in response to a blue LED pulse (20 ms duration). Bar = s.d. Top inset, average EPSC trace of an example neurons. Arrow marks the onset of LED pulse. Scale: 20 pA, 50 ms. (F) Average speed trace of an example animal under flash only (black) or LED illumination of the LP only (blue). (G) Summary of modulation indices under LED illumination of the LP. There is no significant difference from zero (p > 0.05, one-sample t-test, n = 8 sessions from 4 animals). (H) LED illumination was applied to the dorsomedial striatum (str.). Right, image showing the track of the implanted optic fiber. Scale: 500 μm. (I) Average monosynaptic EPSC amplitudes recorded from 15 dorsomedial striatal neurons (in 5 slices) in response to optical stimulation of corticofugal axons in the striatum. Scale for top inset: 50 pA, 50 ms. (J) Average speed trace of an example animal in response to flash only (black) and to LED illumination of the striatum only (blue). (K) Summary of modulation indices under LED illumination. There is no significant difference from zero (p > 0.05, one-sample t-test, n = 9 sessions from 4 animals).

References

    1. Allen TA, Narayanan NS, Kholodar-Smith DB, Zhao Y, Laubach M, Brown TH. Imaging the spread of reversible brain inactivations using fluorescent muscimol. Journal of neuroscience methods. 2008;171:30–38. - PMC - PubMed
    1. Andermann ML, Kerlin AM, Roumis DK, Glickfeld LL, Reid RC. Functional specialization of mouse higher visual cortical areas. Neuron. 2011;72:1025–1039. - PMC - PubMed
    1. Bordi F, LeDoux J. Sensory tuning beyond the sensory system: an initial analysis of auditory response properties of neurons in the lateral amygdaloid nucleus and overlying areas of the striatum. The Journal of neuroscience: the official journal of the Society for Neuroscience. 1992;12:2493–2503. - PMC - PubMed
    1. Brandao ML, Borelli KG, Nobre MJ, Santos JM, Albrechet-Souza L, Oliveira AR, Martinez RC. Gabaergic regulation of the neural organization of fear in the midbrain tectum. Neuroscience and biobehavioral reviews. 2005;29:1299–1311. - PubMed
    1. Ciaramitaro VM, Todd WE, Rosenquist AC. Disinhibition of the superior colliculus restores orienting to visual stimuli in the hemianopic field of the cat. The Journal of comparative neurology. 1997;387:568–587. - PubMed

Publication types

MeSH terms

LinkOut - more resources