. 2015 Jun 5;36(15):1132-56.
doi: 10.1002/jcc.23905.

DOCK 6: Impact of new features and current docking performance

Affiliations

DOCK 6: Impact of new features and current docking performance

William J Allen et al. J Comput Chem. .

Abstract

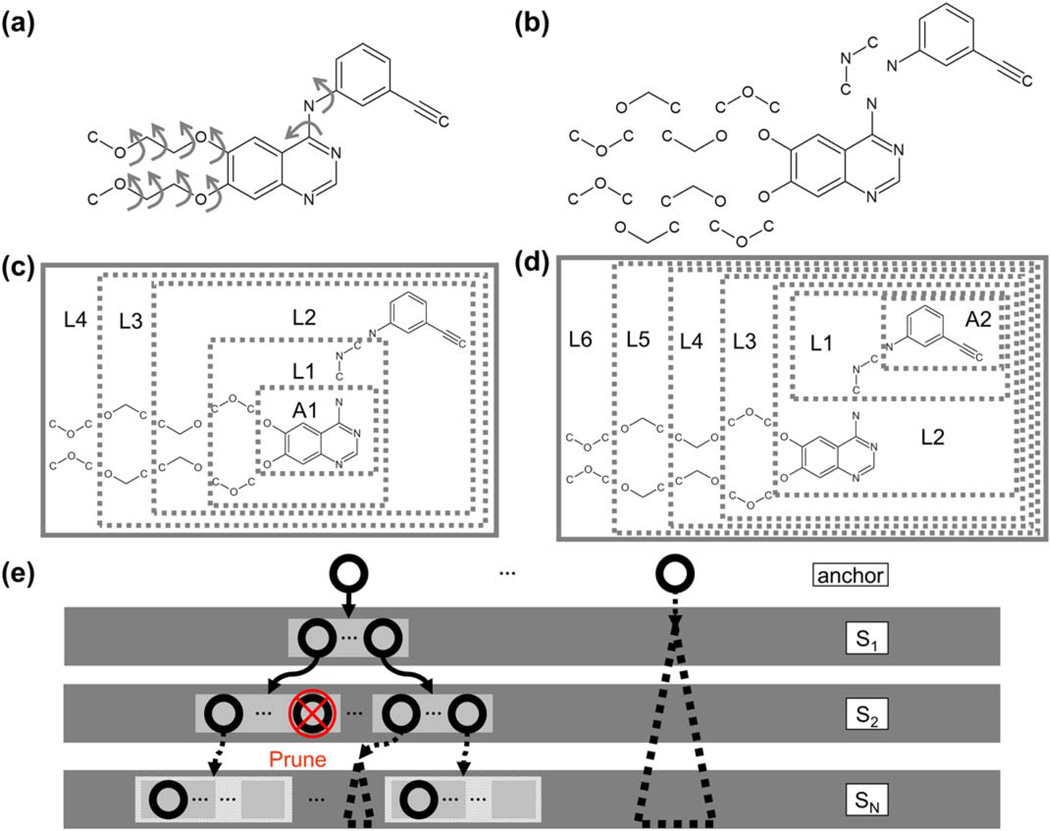
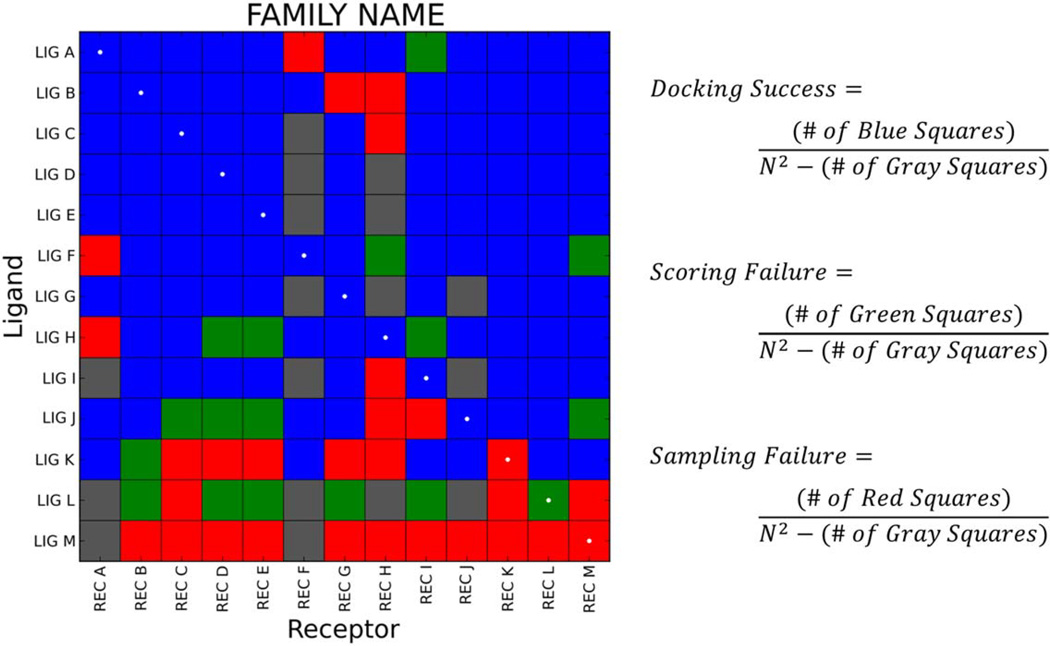
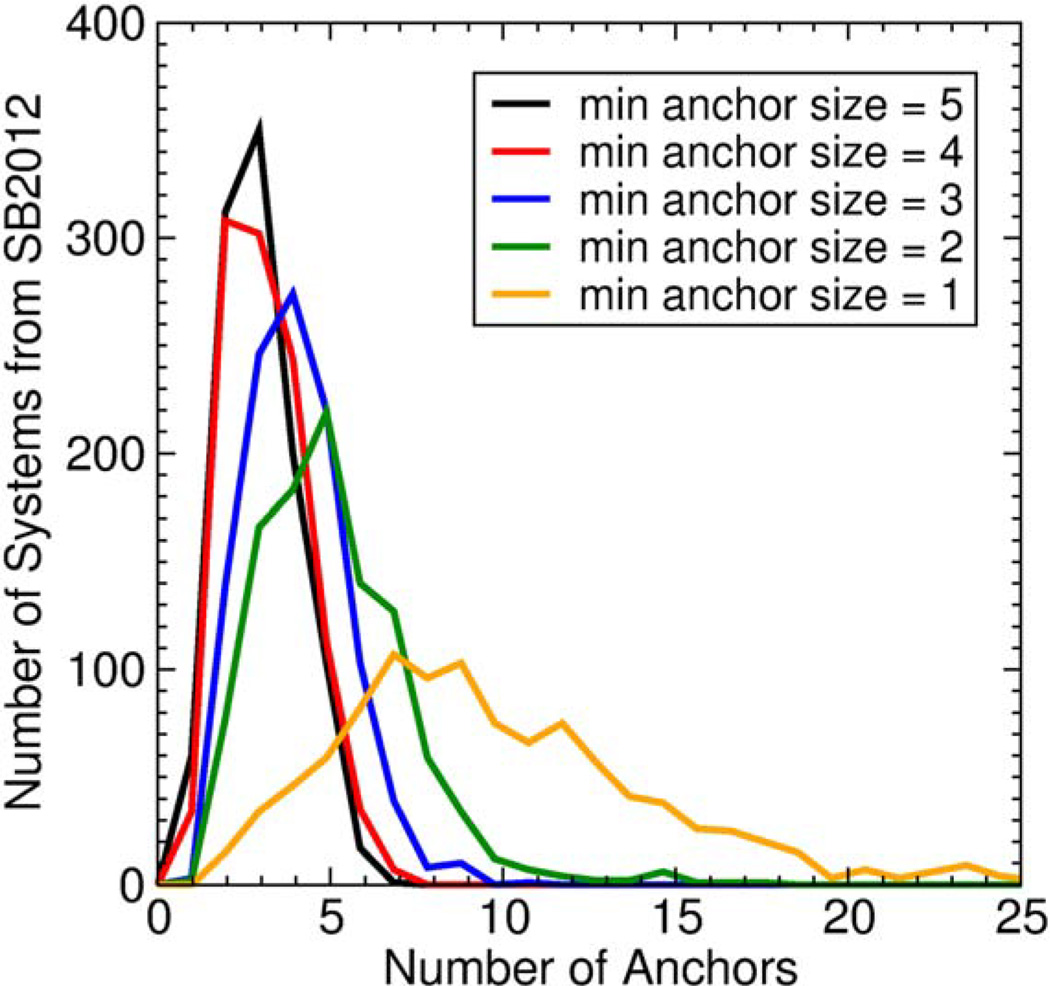
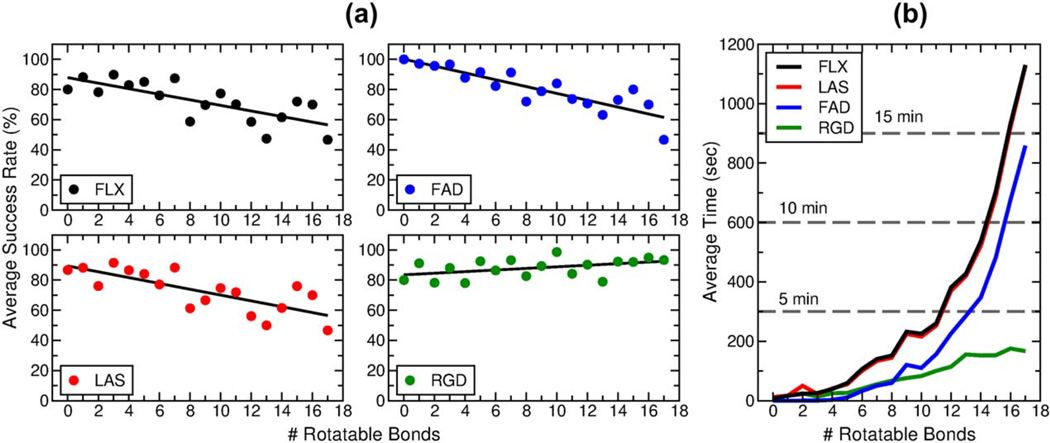
This manuscript presents the latest algorithmic and methodological developments to the structure-based design program DOCK 6.7 focused on an updated internal energy function, new anchor selection control, enhanced minimization options, a footprint similarity scoring function, a symmetry-corrected root-mean-square deviation algorithm, a database filter, and docking forensic tools. An important strategy during development involved use of three orthogonal metrics for assessment and validation: pose reproduction over a large database of 1043 protein-ligand complexes (SB2012 test set), cross-docking to 24 drug-target protein families, and database enrichment using large active and decoy datasets (Directory of Useful Decoys [DUD]-E test set) for five important proteins including HIV protease and IGF-1R. Relative to earlier versions, a key outcome of the work is a significant increase in pose reproduction success in going from DOCK 4.0.2 (51.4%) → 5.4 (65.2%) → 6.7 (73.3%) as a result of significant decreases in failure arising from both sampling 24.1% → 13.6% → 9.1% and scoring 24.4% → 21.1% → 17.5%. Companion cross-docking and enrichment studies with the new version highlight other strengths and remaining areas for improvement, especially for systems containing metal ions. The source code for DOCK 6.7 is available for download and free for academic users at http://dock.compbio.ucsf.edu/.

Keywords: DOCK; cross-docking; docking; enrichment; ligand flexibility; pose reproduction; virtual screening.


Figures

Figure 1
Figure 1
(a) Structure of prescription drug erlotinib is shown with arrows indicating rotatable bonds. (b) The molecule is broken into rigid segments at rotatable bonds. (c–d) Layers for the specific molecule (L1, L2, … LN) are defined for two different anchors: A1 and A2. (e) Cartoon representation of the growth tree is shown. Circles represent partially or fully grown ligand conformers, which are energy minimized and pruned following each addition of a segment (S1, S2, … SN).
Figure 2
Figure 2
Standard pose reproduction experiment following a flexible docking protocol. (a) Crystal ligand conformation shown in blue. (b) DOCK sampling space shown as overlay of magenta molecules. (c) Top-ranked pose (magenta) relative to crystal pose (blue), 1.35 Å RMSD.
Figure 3
Figure 3
Sample cross-docking heatmap (N=13) color-coded as: blue=docking success, green=scoring failure, red=sampling failure, or gray=non-viable pairing. The diagonal is marked with white dots. In this matrix, there are 169 total squares: 106 blue, 17 green, 29 red, and 17 gray. Thus, the matrix docking success is 106/152=69.7%, the matrix scoring failure is 17/152=11.2%, and the matrix sampling failure is 29/152=19.1%.
Figure 4
Figure 4
Schematic protocol for enrichment experiment. (a) Lists of known active compounds and decoy compounds are prepared for a given receptor. In this specific example, five actives (represented by black circles) and ten decoys (represented by open circles) are shown. (b) Following docking of all actives and decoys to a receptor, outcomes are ranked based on score. Here, two different outcomes are described: good enrichment (blue box) and poor enrichment (red box). (c) Data are plotted as receiver operating characteristic (ROC) curves: true positive rate on the y-axis, false positive rate on the x-axis. The blue line represents a good enrichment outcome with an area-under-the-curve (AUC) of >0.5; the red line represents a poor enrichment outcome with an AUC of <0.5; the dashed line represents random enrichment with an AUC equal to 0.5.
Figure 5
Figure 5
(a) Top-scoring ligand pose with internal energy and clash overlap functions turned off (top) vs. only the internal energy function turned on (the standard FLX protocol, bottom) using DOCK 6.7 (PDB code 1M17).[73] Internal clashes in top molecule indicated by red arrows. (b) Histograms of ligand internal energy (repulsive van der Waals term only) for native crystallographic ligands from the SB2012 test set following no minimization (black line) or 100 (red), 1000 (blue), and 5000 (green) iterations of flexible minimization.
Figure 6
Figure 6
Histograms of the number of anchors for five different thresholds for minimum anchor size. These data are from the SB2012 test set, N=1043.
Figure 7
Figure 7
Stages of growth for flexible docking (FLX) of 2-deoxy-2,3-dehydro-N-acetyl-neuraminic acid ligand to neuraminidase receptor (PDB code 1F8B)[75] using the RMSD restraint minimizer with spring constant 10.0 kcal mol−1 Å−2. Crystal structure pose shown as gray sticks, and partially grown conformers shown as orange sticks. (a) Initial minimized ligand anchor position (beginning 2.6 Å RMSD from crystal). (b→k) Incremental growth stages for all rigid segments (ultimately 0.4 Å RMSD from crystal). (l) Overlay of all stages of growth colored sequentially in white to black gradient.
Figure 8
Figure 8
Stages of growth for flexible docking (FLX) of 2-deoxy-2,3-dehydro-N-acetyl-neuraminic acid ligand to neuraminidase receptor (PDB code 1F8B)[75] absent the RMSD restraint minimizer. Crystal structure pose shown as light gray sticks, and partially grown conformers shown as magenta sticks. (a) Initial minimized ligand anchor position (beginning 3.2 Å RMSD from crystal). (b→k) Incremental growth stages for all rigid segments (ultimately 0.4 Å RMSD from crystal). (l) Overlay of all stages of growth colored sequentially in white to black gradient.
Figure 9
Figure 9
(a) Success rate as a function of the number of ligand rotatable bonds for the FLX (black), LAS (red), FAD (blue), and RGD (green) protocols over the SB2012 test set with DOCK 6.7. Colored circles represent the success rate for a particular bin, and black lines are the best-linear fit. (b) Average docking run time as a function of the number of ligand rotatable bonds for the FLX (black), LAS (red), FAD (blue), and RGD (green) protocols over the SB2012 test set. Subsets greater than 17 rotatable bonds were excluded from this analysis due to a small bin size of less than ten systems.
Figure 10
Figure 10
Representative alignment of a cross-docking family. Fifteen systems from the EGFR protein family were aligned on the backbone of PDB code 1M17.[73] Protein backbones are shown as gray ribbon, and bound ligands are shown as red (erlotinib-like), blue (lapatinib-like), green (ATP-like), or yellow (staurosporine-like) sticks. The conformational search and scoring space is shown as a magenta box.
Figure 11
Figure 11
Cross-docking outcomes for 24 families. Blue squares indicate docking success, green squares indicate scoring failure, red squares indicate sampling failure, and gray squares indicate a non-viable pairing. Panels are sorted left-to-right, top-to-bottom by overall docking success rate.
Figure 12
Figure 12
Overlay of ligands from (a) neuraminidase (N=43), (b) streptavidin (N=8), and (c) T4 lysozyme (N=13) cross-docking families. Hydrogens and protein atoms hidden for clarity. For complete PDB code lists, see Supporting Information Figures S19, S22, and S23.
Figure 13
Figure 13
Overlay of ligands from the cyclooxygenase family. Five ibuprofen or ibuprofen-analog ligands, specific to COX-1, shown in orange; one indomethacin ligand, specific to COX-2, shown in blue. Hydrogen atoms hidden for clarity. For complete PDB code lists, see Supporting Information Figure S9.
Figure 14
Figure 14
Heatmap of EGFR cross-docking outcomes. Ligand PDB codes and number of rotatable bonds listed on y-axis, receptor PDB codes listed on x-axis. Structures are grouped by the identity of the bound ligand: (a) staurosporine-like (N=3), (b) erlotinib-like (N=6), (c) ATP-like (N=3), and (d) lapatinib like (N=3). The first 12 columns are all active forms, the last three columns are inactive forms.
Figure 15
Figure 15
Enrichment curves using standard all anchor (red), max 3 anchors (blue), or max 1 anchor (green) protocols with the DUD-E database for five different receptors. For comparison, random results are shown (black) against the diagonal (dashed line). Note that the standard all anchors (red) and max 3 anchors (blue) curves are essentially indistinguishable due to high overlap.
Figure 16
Figure 16
Ligand pose comparisons using standard (red), max 3 anchors (blue), or max 1 anchor (green) protocols. Molecules shown were selected based on the top 5 scored results obtained with the standard protocol. Results for which the max 1 anchor protocol yields substantially different poses from the other two protocols are highlighted with a gray box. Results for which all protocols yield discernibly different poses are highlighted with a dashed gray box. To facilitate colored visualization for identical poses, molecules were offset 0.2 Å in the x- or y-direction.
Figure 17
Figure 17
Differences in geometry for the sets of all (a) active (N=3408 ligands) and (b) decoy (N=102,708 ligands) poses sampled using different DOCK protocols across the five enrichment systems evaluated by symmetry-corrected RMSD. Standard vs. max 3 anchors (black), standard vs. max 1 anchor (red), and max 3 anchors vs. max 1 anchor (blue) are shown. Bin size is 0.5 Å RMSD.

Similar articles

Cited by

References

    1. Kuntz ID. Science. 1992;257:1078–1082. - PubMed
    1. Shoichet BK. Nature. 2004;432:862–865. - PMC - PubMed
    1. Jorgensen WL. Science. 2004;303:1813–1818. - PubMed
    1. DesJarlais RL, Sheridan RP, Seibel GL, Dixon JS, Kuntz ID, Venkataraghavan R. J. Med. Chem. 1988;31:722–729. - PubMed
    1. Kuntz ID, Blaney JM, Oatley SJ, Langridge R, Ferrin TE. J. Mol. Biol. 1982;161:269–288. - PubMed

Publication types