. 2015 Apr 9:9:118.
doi: 10.3389/fncel.2015.00118. eCollection 2015.

Characterization of optic nerve regeneration using transgenic zebrafish

Affiliations

Characterization of optic nerve regeneration using transgenic zebrafish

Heike Diekmann et al. Front Cell Neurosci. .

Abstract

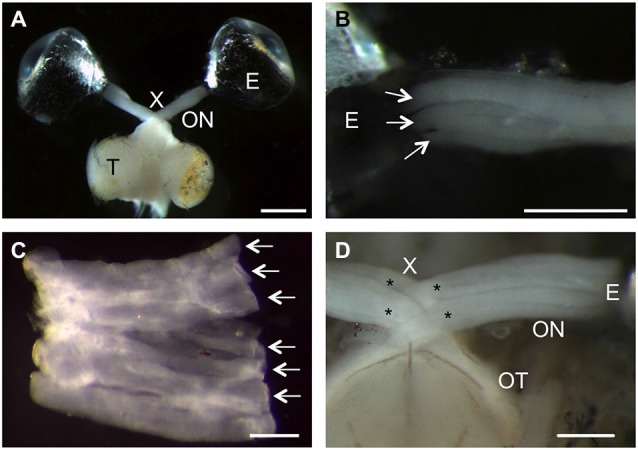
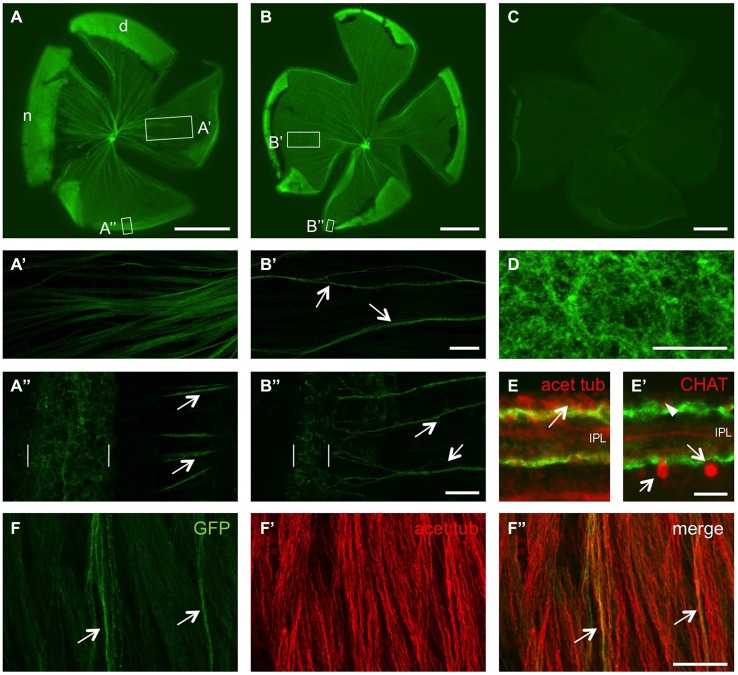
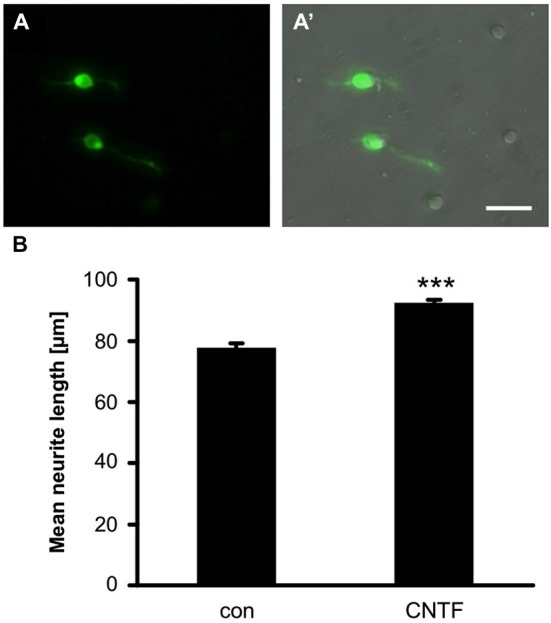
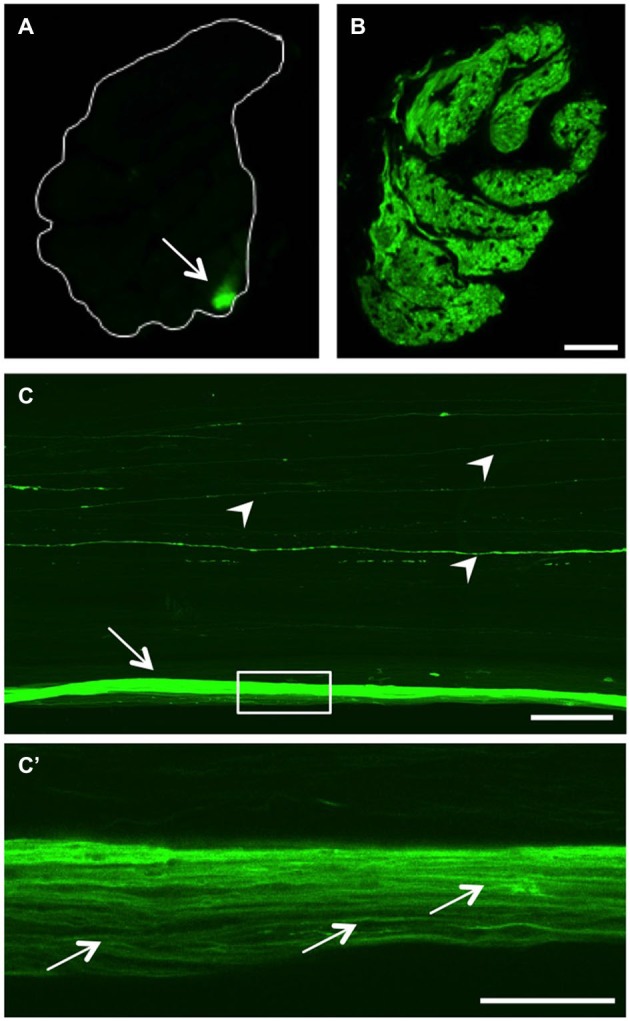
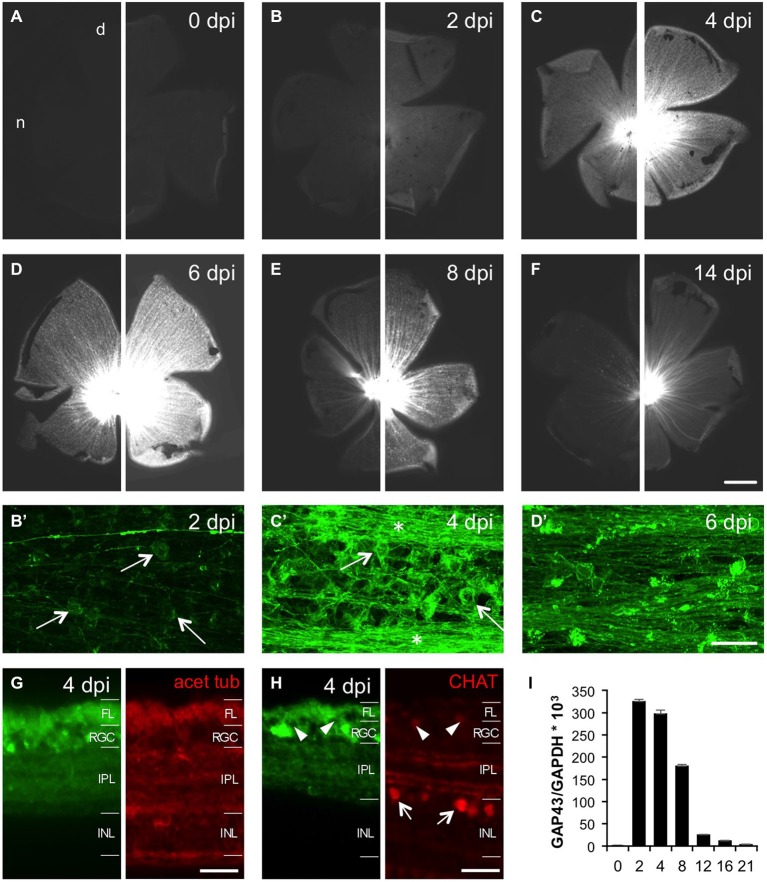
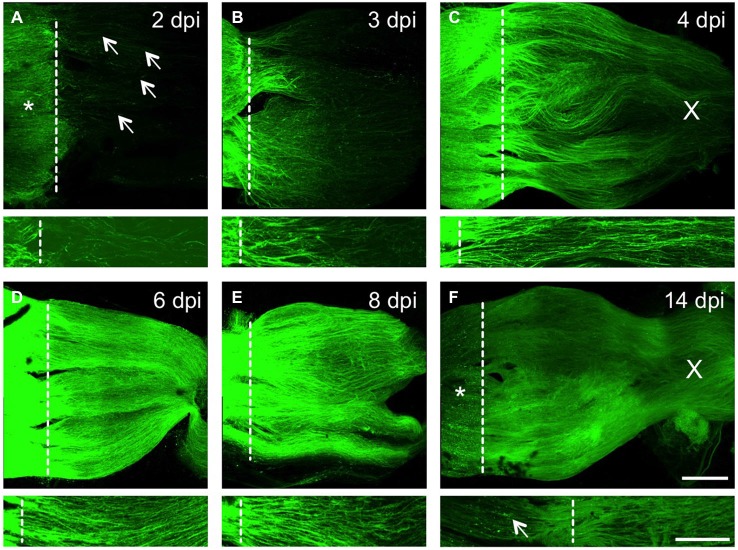
In contrast to the adult mammalian central nervous system (CNS), fish are able to functionally regenerate severed axons upon injury. Although the zebrafish is a well-established model vertebrate for genetic and developmental studies, its use for anatomical studies of axon regeneration has been hampered by the paucity of appropriate tools to visualize re-growing axons in the adult CNS. On this account, we used transgenic zebrafish that express enhanced green fluorescent protein (GFP) under the control of a GAP-43 promoter. In adult, naïve retinae, GFP was restricted to young retinal ganglion cells (RGCs) and their axons. Within the optic nerve, these fluorescent axons congregated in a distinct strand at the nerve periphery, indicating age-related order. Upon optic nerve crush, GFP expression was markedly induced in RGC somata and intra-retinal axons at 4 to at least 14 days post injury. Moreover, individual axons were visualized in their natural environment of the optic nerve using wholemount tissue clearing and confocal microscopy. With this novel approach, regenerating axons were clearly detectable beyond the injury site as early as 2 days after injury and grew past the optic chiasm by 4 days. Regenerating axons in the entire optic nerve were labeled from 6 to at least 14 days after injury, thereby allowing detailed visualization of the complete regeneration process. Therefore, this new approach could now be used in combination with expression knockdown or pharmacological manipulations to analyze the relevance of specific proteins and signaling cascades for axonal regeneration in vivo. In addition, the RGC-specific GFP expression facilitated accurate evaluation of neurite growth in dissociated retinal cultures. This fast in vitro assay now enables the screening of compound and expression libraries. Overall, the presented methodologies provide exciting possibilities to investigate the molecular mechanisms underlying successful CNS regeneration in zebrafish.

Keywords: GFP; axon regeneration; optic nerve regeneration; tissue clearing; transgenic zebrafish.


Figures

Figure 1
Figure 1
Anatomical peculiarities of the zebrafish visual system. (A) Dorsal view of an isolated zebrafish visual system. Retinal ganglion cell (RGC) axons project from the right eye (E) into the optic nerve (ON, fixed in a stretched position), through the optic chiasm (X) and the optic tract into the contralateral optic tectum (T). Scale bar = 1 mm. (B) The ribbon-like structure of the zebrafish optic nerve is apparent as RGC axons exit the eye (E) within discrete strands (arrows). Scale bar = 500 µm. (C) Upon dissection, the zebrafish optic nerve can be flattened into a sheet of adjacent axon strands (arrows). Scale bar = 200 µm. (D) Ventral view of the optic chiasm. The optic nerves (ON) each split into two larger bundles (stars) that intercalate at the chiasm (X). Scale bar = 250 µm.
Figure 2
Figure 2
Size- and age-dependent retinal GFP expression in naïve GAP43:GFP zebrafish. (A) GFP expression is detected in quite a few RGC axons of a retinal flatmount from a 1.6 cm long, 4 month old zebrafish. (B) Only a subset of retinal axons showed GFP expression in a retinal flatmount of a 3 cm long, 4 month old zebrafish. (C) Hardly any GFP expression is detected in a retinal flatmount of a 4 cm long, 8 month old zebrafish. Retinae are orientated with dorsal (d) up and nasal (n) to the left. Exposure time = 150 ms. Scale bar = 500 µm. (A’,A”,B’,B”) Higher magnifications of the boxed areas in (A,B), respectively, using maximum intensity projections of confocal stacks. GFP is expressed in more RGC axons in smaller/younger retinae (compare A’ to the few axon fascicles (arrows) in B’), originating from a broader proliferative marginal zone (brackets) in the retinal periphery (compare A” with B”). Retinal periphery is to the left. Scale bar = 50 µm (A’,B’) and 20 µM (A”,B”), respectively. (D) Dendritic arbors of RGCs are GFP-positive throughout the retina in a flatmount of a naïve GAP43:GFP zebrafish. Maximum intensity projection of 4 Z-sections from underneath the RGC layer. Scale bar = 20 µm. (E) Retinal cross sections of naïve GAP43:GFP zebrafish reveal dendritic GFP expression (green) in two separate bands within the inner plexiform layer (IPL). Immunohistochemical co-staining with acetylated tubulin (acet tub, red) identifies RGC somata (arrow) adjacent to the upper band (see also Figure 5G). (E’) GFP expression is neither detected in cholinergic amacrine cells located in the inner plexiform layer (arrows) or displaced in the ganglion cell layer (arrowhead) nor in their dendritic arbors as identified by choline acetyltransferase (CHAT) staining (red; see also Figure 5H). (F) Co-immunostaining of a retinal flatmount from naïve GAP43:GFP zebrafish with acetylated tubulin antibody (F’) reveals all RGC axons while GFP (green) is only expressed in a small subset of retinal axons (arrows). (F”) shows the merged picture. Scale bar = 25 µm.
Figure 3
Figure 3
GFP expression in cultered RGCs. (A) GFP is expressed in somata and axons of dissociated RGCs at 4 days in culture. (A’) Merged view of bright-field and fluorescent image. Scale bar = 100 µm. (B) Quantification of neurite length per RGC in retinal cultures of GAP43:GFP zebrafish. Addition of 2 ng/ml CNTF significantly induced neurite growth. Data represent means ± SEM of 6 wells from two independent experiments. Treatment effects (asterisks): p < 0.001.
Figure 4
Figure 4
GFP expression in the optic nerve. (A) Transverse section of the optic nerve reveals GFP expression in a discrete bundle in the periphery (arrow). The white line indicates the outline of the nerve. (B) At 7 days after injury, regenerating RGC axons across the whole optic nerve transverse section are GFP-positive. Scale bar = 25 µm. (C) Longitudinal view of a cleared, naïve wholemount optic nerve (maximum intensity projection of a confocal stack). In addition to the labeled peripheral axon bundle (arrow), single GFP-positive axons are visible throughout the optic nerve (arrowheads). Scale bar = 200 µm. (C’) Higher magnification of the boxed area in (C) using one Z-section of a cleared, naïve wholemount optic nerve reveals single axons within the peripheral bundle (arrows). Scale bar = 50 µm.
Figure 5
Figure 5
Time course of optic nerve crush-induced retinal GFP expression. (A–F) Retinal flatmounts of 8 months old GAP43:GFP zebrafish at 0, 2, 4, 6, 8 and 14 days post injury (dpi), respectively. A retina from an uninjured zebrafish was included to enable direct comparison with experimental retinae. To facilitate the visualization of different GFP expression levels, pictures of the same retina are presented at two different exposure times (30 ms on the left, 100 ms on the right). GFP expression is strongest at 6 dpi. Retinae are orientated with dorsal (d) up and nasal (n) to the left. Scale bar = 500 µm. (B’–D’) Higher magnifications of the respective retinal wholemounts using maximum intensity projections of confocal stacks reveal GFP expression in RGCs (arrows), but not yet intraretinal axons (except for the young growing axons) at 2 dpi (B’). At 4 dpi, GFP is strongly expressed in RGCs (arrows) and their axons (stars) throughout the retina (C’). GFP expression in RGCs is already decreasing at 6 dpi (D’). Retinal periphery is to the left. Brightness and contrast were adjusted independently to visualize single axons. Scale bar = 25 µm. (G) Cross section of a 4 dpi retina from GAP43:GFP zebrafish co-stained with acetylated tubulin (red) reveals GFP induction (green) in RGCs and their axons in the fiber layer (FL) after optic nerve injury. The dendritic GFP label is dispersed throughout the entire inner plexiform layer (IPL) (compare to Figure 2E). INL = inner nuclear layer. Scale bar = 20 µm. (H) Retinal cross section co-stained with choline acetyltransferase (CHAT, red). Retinal GFP induction (green) is restricted to RGCs as cholinergic amacrines in the inner nuclear layer (INL) or displaced in the RGC layer (arrowheads) are not labeled (compare to Figure 2E’). (I) Quantitative real time PCR of retinal Gap43 expression relative to GAPDH at various times after optic nerve crush as indicated. Overall, GFP expression closely mirrors GAP-43 induction after optic nerve injury. Values represent the mean of four retinae per group from two independent experiments.
Figure 6
Figure 6
Time course of axonal regeneration in the injured optic nerve. (A–F) Maximum intensity projections of confocal scans of cleared, naive wholemount optic nerves of GAP-43:GFP zebrafish at 2, 3, 4, 6, 8 and 14 days post injury (dpi), respectively. The lesion site is indicated with a dashed line, proximal is to the left. Scale bar = 200 µm. Lower pictures depict higher magnifications from one Z-section of the respective optic nerves. In (A–C), these close ups were increased in brightness and contrast to visualize single axons. Scale bar = 100 µm. (A) Injured RGC axons strongly express GFP proximal to the lesion site (asterisk) already at 2 dpi. Some axons have started to regrow into the optic nerve (arrows). (B) Significantly more axons are regenerating at 3 dpi, with the majority reaching half-distance towards the optic chiasm. (C) Even more RGC axons are regenerating in the optic nerve at 4 dpi, with axons already passing through the optic chiasm (X). (D) The optic nerve is filled with regenerating RGC axons at 6 dpi, leading to further increased GFP expression. (E) Strong axonal GFP expression is still detected at 8 dpi. (F) GFP expression is reduced proximal of the lesion site (star) and appears punctuated (arrow) at 14 dpi. The distal part of the regenerating axons, however, is still strongly labeled and individual axons can be identified.

References

    1. Anders J. J., Hibbard E. (1974). The optic system of the teleost Cichlasoma biocellatum. J. Comp. Neurol. 158, 145–154. 10.1002/cne.901580203 - DOI - PubMed
    1. Attardi D. G., Sperry R. W. (1963). Preferential selection of central pathways by regenerating optic fibers. Exp. Neurol. 7, 46–64. 10.1016/0014-4886(63)90093-1 - DOI - PubMed
    1. Becker C. G., Becker T. (2007). Growth and pathfinding of regenerating axons in the optic projection of adult fish. J. Neurosci. Res. 85, 2793–2799. 10.1002/jnr.21121 - DOI - PubMed
    1. Benowitz L. I., Routtenberg A. (1997). GAP-43: an intrinsic determinant of neuronal development and plasticity. Trends Neurosci. 20, 84–91. 10.1016/s0166-2236(96)10072-2 - DOI - PubMed
    1. Bernhardt R. R. (1999). Cellular and molecular bases of axonal regeneration in the fish central nervous system. Exp. Neurol. 157, 223–240. 10.1006/exnr.1999.7059 - DOI - PubMed

LinkOut - more resources