Phylodynamic analysis of ebola virus in the 2014 sierra leone epidemic
- PMID: 25914858
- PMCID: PMC4399230
- DOI: 10.1371/currents.outbreaks.6f7025f1271821d4c815385b08f5f80e
Phylodynamic analysis of ebola virus in the 2014 sierra leone epidemic
Abstract
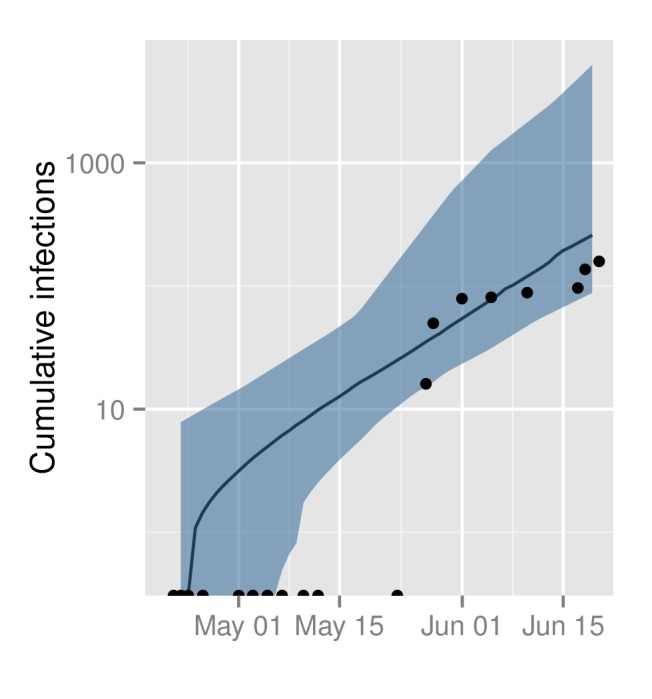
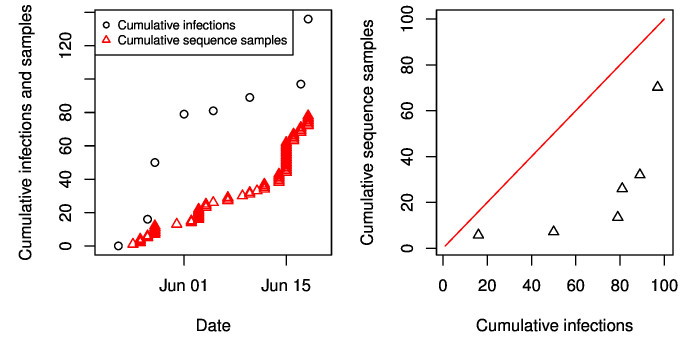
Background: The Ebola virus (EBOV) epidemic in Western Africa is the largest in recorded history and control efforts have so far failed to stem the rapid growth in the number of infections. Mathematical models serve a key role in estimating epidemic growth rates and the reproduction number (R0) from surveillance data and, recently, molecular sequence data. Phylodynamic analysis of existing EBOV time-stamped sequence data may provide independent estimates of the unobserved number of infections, reveal recent epidemiological history, and provide insight into selective pressures acting upon viral genes.
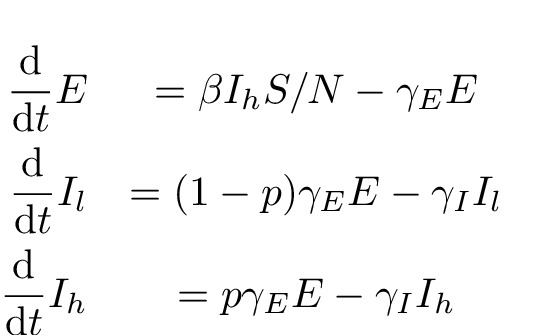
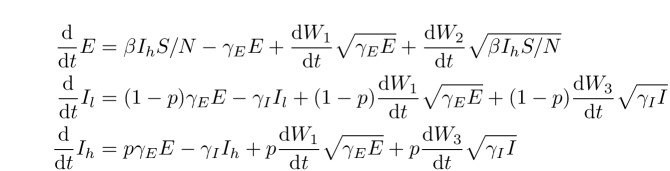
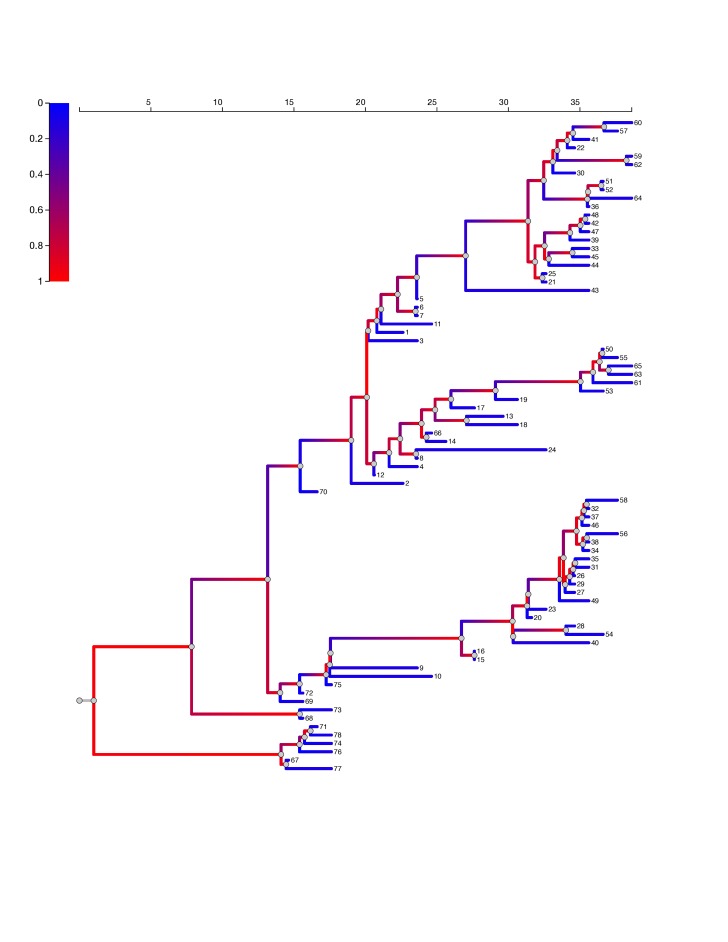
Methods: We fit a series mathematical models of infectious disease dynamics to phylogenies estimated from 78 whole EBOV genomes collected from distinct patients in May and June of 2014 in Sierra Leone, and perform evolutionary analysis on these genomes combined with closely related EBOV genomes from previous outbreaks. Two analyses are conducted with values of the latent period that have been used in recent modelling efforts. We also examined the EBOV sequences for evidence of possible episodic adaptive molecular evolution during the 2014 outbreak.
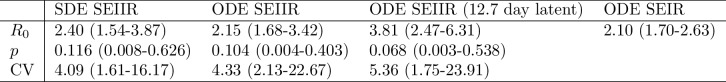
Results: We find evidence for adaptive evolution affecting L and GP protein coding regions of the EBOV genome, which is unlikely to bias molecular clock and phylodynamic analyses. We estimate R0=2.40 (95% HPD:1.54-3.87 ) if the mean latent period is 5.3 days, and R0=3.81, (95% HPD:2.47-6.3) if the mean latent period is 12.7 days. The estimated coefficient of variation (CV) of the number of transmissions per infected host is very high, and a large proportion of infections yield no transmissions.
Conclusions: Estimates of R0 are sensitive to the unknown latent infectious period which can not be reliably estimated from genetic data alone. EBOV phylogenies show significant evidence for superspreading and extreme variance in the number of transmissions per infected individual during the early epidemic in Sierra Leone.
Keywords: ebola; ebolavirus; infectious disease; phylodynamics; superspreading.
Figures
References
Grants and funding
LinkOut - more resources
Full Text Sources
Other Literature Sources