. 2015 May 14;521(7551):180-185.
doi: 10.1038/nature14416. Epub 2015 Apr 27.

Neurons for hunger and thirst transmit a negative-valence teaching signal

Affiliations

Neurons for hunger and thirst transmit a negative-valence teaching signal

J Nicholas Betley et al. Nature. .

Abstract

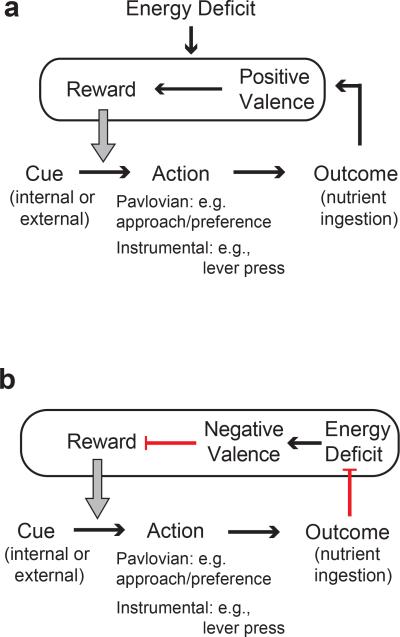
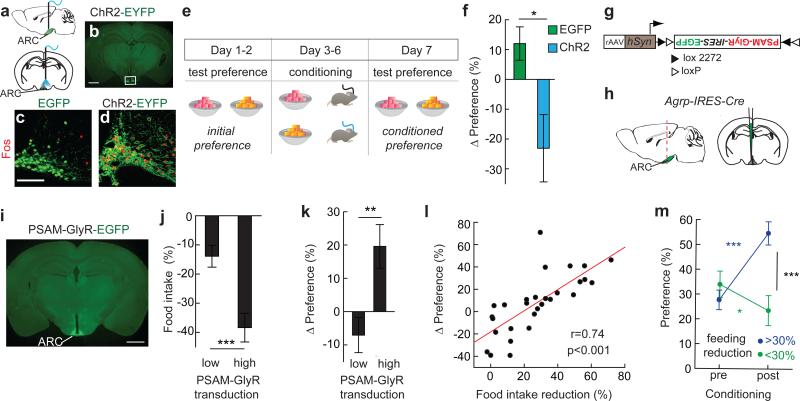
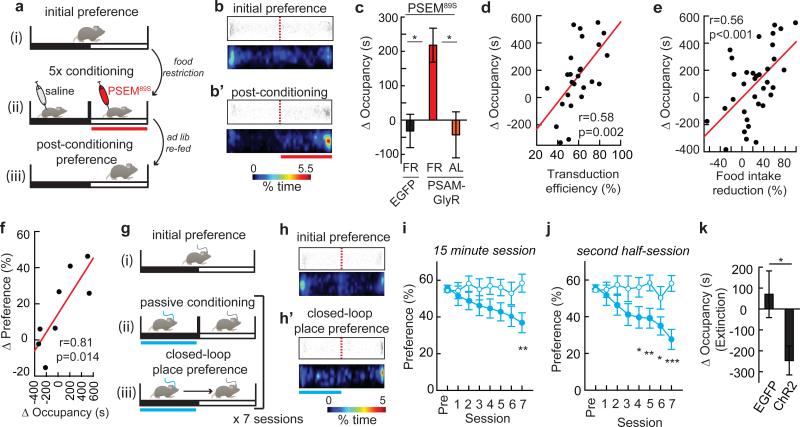
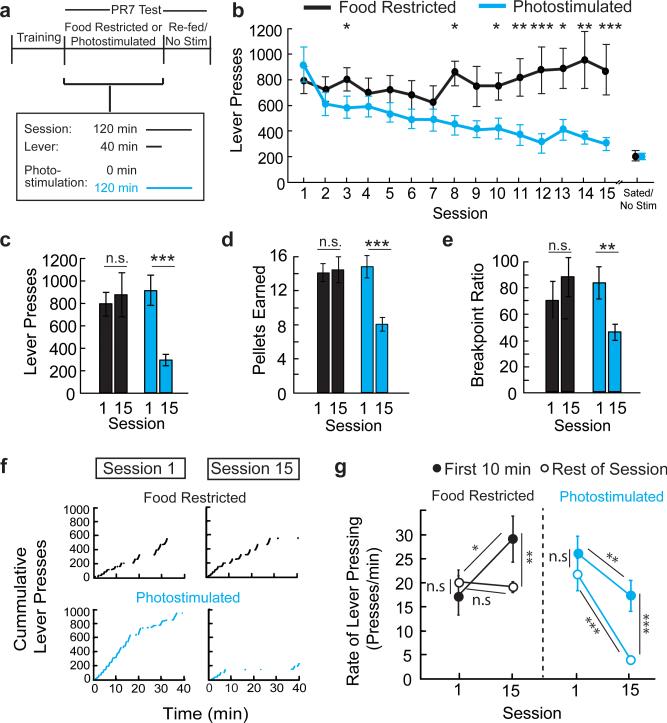
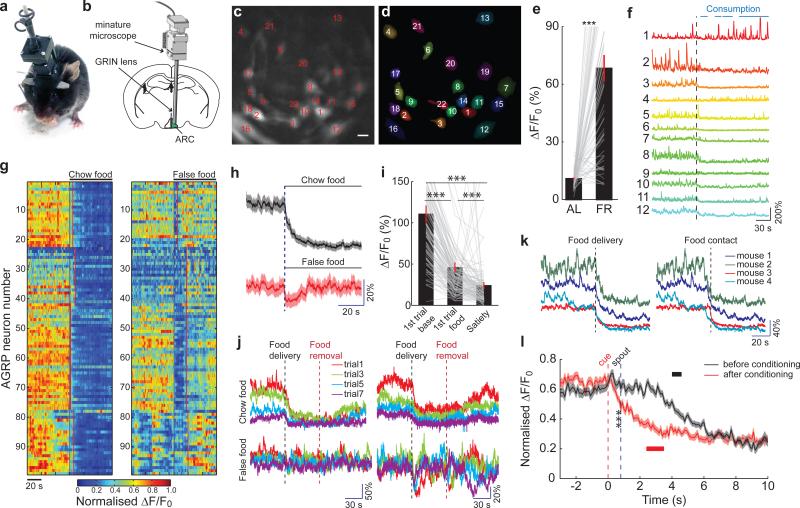
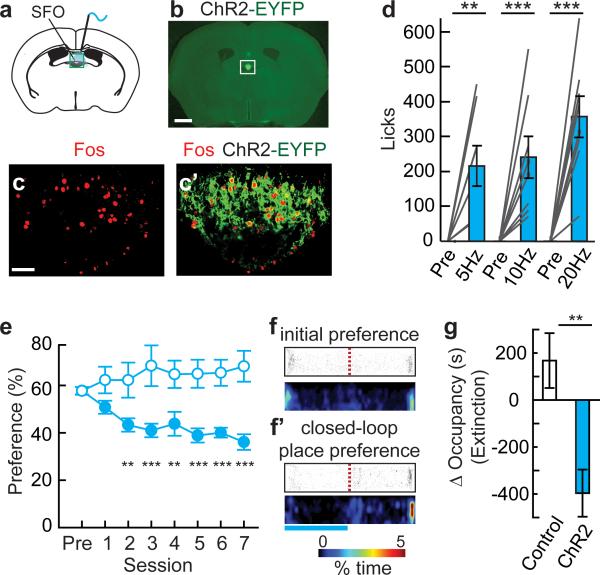
Homeostasis is a biological principle for regulation of essential physiological parameters within a set range. Behavioural responses due to deviation from homeostasis are critical for survival, but motivational processes engaged by physiological need states are incompletely understood. We examined motivational characteristics of two separate neuron populations that regulate energy and fluid homeostasis by using cell-type-specific activity manipulations in mice. We found that starvation-sensitive AGRP neurons exhibit properties consistent with a negative-valence teaching signal. Mice avoided activation of AGRP neurons, indicating that AGRP neuron activity has negative valence. AGRP neuron inhibition conditioned preference for flavours and places. Correspondingly, deep-brain calcium imaging revealed that AGRP neuron activity rapidly reduced in response to food-related cues. Complementary experiments activating thirst-promoting neurons also conditioned avoidance. Therefore, these need-sensing neurons condition preference for environmental cues associated with nutrient or water ingestion, which is learned through reduction of negative-valence signals during restoration of homeostasis.


Figures

Extended Data Figure 1
Extended Data Figure 1. Models for homeostatic regulation of learning food preferences and food-seeking behaviors
a, The relationship between internal or external cues and Pavlovian approach or instrumental food-seeking actions is strengthened by nutrient ingestion. Nutrients have intrinsically positive valence (rewarding), and energy deficit enhances the reward value of outcomes associated with food intake. b, Model of food preference and food-seeking in which learning involves reducing an energy deficit internal state that has negative valence. The relationship between internal or external cues and food preferences or food-seeking actions is strengthened by nutrient ingestion outcomes that reduce energy deficit and associated negative valence (red bar arrows are inhibitory). Conversely, the relationship between internal or external cues and food preference or food-seeking actions is weakened if outcomes do not reduce energy deficit.
Extended Data Figure 2
Extended Data Figure 2. AGRP neuron activation does not condition taste aversion, and feeding reduction correlates with proportion of AGRP neurons inhibited
a, Experimental design for conditioned taste aversion experiments. Mice were water restricted and habituated to drink water from a spout during 20 min sessions. Four groups of mice were then allowed to consume a tastant (0.15% saccharine solution) for 20 min (Pre-Test) and immediately following this session, they were exposed to a conditioning agent (LiCl, saline, 120-min AGRP neuron photostimulation, or AGRPChR2 mice attached to an optical fibre but not phostostimulated; all n=6 mice). The next day, mice were tested for consumption of the saccharine solution (Test 1). For AGRP neuron photostimulated and non-photostimulated groups, conditioning and testing was extended with an additional three conditioning and test sessions. The day following the last testing session for each group, water consumption was also measured (Water-Test). b,c, Consumption of tastant solution for all sessions (b) and comparison for Pre-Test and Test 1 session (c). d,d’, Confocal micrographs of Cre recombinase-expressing AGRP neurons transduced with rAAV-Syn-FLEX-PSAML141F-GlyR-IRES-EGFP. Alexa555-conjugated-Bungarotoxin (Bgt-555) labels PSAML141F-GlyR (d), which co-localizes with EGFP (d’). Scale, 100 μm. e,f, Fos immunofluorescence in the ARC of mice treated with PSEM89S during the first 4 hours of the dark period without access to food. AGRPEGFP mice (e) show high levels of Fos in AGRP neurons and AGRPPSAM-GlyR mice (f) express low levels of Fos in neurons that express PSAM-GlyR (right side); non-transduced neurons (contralateral side) express high levels of Fos. Scale, 100 μm. g, Fos immunofluorescence intensity in AGRP neurons from AGRPPSAM-GlyR or AGRPEGFP mice after PSEM89S treatment during the first 4 hours of the dark period without access to food (n=3 mice/condition, n>50 nuclei/condition). h, Change in food intake for AGRPEGFP mice (n = 12) or AGRPPSAM-GlyR mice (n = 23) treated with PSEM89S during the first 4 hours of the dark period relative to saline injected on successive days. i, Diagram of AGRP neuron axon projection fields showing from from where transduction efficiency was calculated. i-m, After rAAV-hSyn-FLEX-rev-PSAML141F-GlyR-IRES-EGFP transduction of Agrp-IRES-Cre mice, measurement of EGFP transduction efficiency in AGRP boutons in the PVH (i,k) and PAG (l,m). High transduction efficiency (>50% in AGRP boutons) is shown (i,l) in comparison to low transduction efficiency (<50% in AGRP boutons) (k,m). Scale, 20 μm. n, Food intake reduction for mice treated with PSEM89S is correlated with the transduction efficiency of rAAV-hSyn-FLEX-rev-PSAML141F-GlyR-IRES-EGFP in AGRP neurons (EGFP transduced boutons/total AGRP boutons) (n=35 mice). n.s. p>0.05, ***p<0.001. Values are means ± s.e.m.
Extended Data Figure 3
Extended Data Figure 3. AGRP neuron activation does not condition appetite or reinforce instrumental responding
a, Experimental design to test conditioned appetite. After closed-loop place preference and extinction testing (Fig. 2), AGRPChR2 mice showed reduced occupancy in the photostimulation-paired side of the chamber. Avoidance in extinction indicated conditioning to offset of a negative-valence signal from AGRP neurons. An alternative hypothesis is that induction of food-seeking on the photostimulation side in the absence of food led the mouse to seek food. Because photostimulation was stopped when the mouse passed to the other side of the chamber, this might increase occupancy on the non-photostimulated side. However, this is not consistent with the increased avoidance of the previously photostimulated side in extinction (Fig. 2k) unless the contextual cues previously associated with photostimulation conditioned increased appetite. To test whether conditioned avoidance might be associated with conditioned hunger, we measured food intake in AL-fed mice after closed-loop place preference, and extinction tests in Fig. 2g-k on each side of the apparatus in the absence of photostimulation. b, Mice did not show conditioned food consumption on the previously photostimulated side (paired t-test, n=8 mice). This indicates that avoidance observed in extinction was not a consequence of food-seeking behaviors being differentially engaged on one side of the apparatus. c,d Cessation of AGRP neuron photostimulation did not condition instrumental responding. (c) Nose pokes by AL-fed AGRPChR2 mice (n=9) during photostimulation, where a nose poke gives a 20 s pause in light pulses for each behavioral session. Nose pokes reduced across sessions indicating the absence of instrumental conditioning. Filled circles: active port, empty circles: inactive port. (d) For AL-fed AGRPChR2 mice previously trained to hit a lever for food, lever presses during photostimulation, where a lever press gives a 20 s pause in light pulses for each behavioral session (repeated measures ANOVA F(7,40)=1.19, p=0.330; n=8 mice). e-h, For optogenetic silencing with Arch (550-600 nm, 8-11 mW/mm2), (e) cell-attached recording of AGRP neuron firing rate in brain slices from Agrp-IRES-Cre;Ai35d (AGRPArch) mice during light illumination. (f) Whole cell recording of AGRPArch during optogenetic inhibition. (g) Membrane potential change in AGRP neurons expressing Arch during light illumination (n = 6). (h) AGRP neuron firing rate during optogenetic inhibition of Arch-expressing AGRP neurons (n = 4). i, Optogenetic silencing of AGRP neurons in food-restricted mice did not condition free operant instrumental responding. Nose pokes by AGRPArch mice resulted in 60-s of 561 nm light delivered to an optical fibre over the ARC. Nose poking reduced over multiple sessions (ANOVA F(3,24)=7.835, p<0.001; n=7 mice), indicating that silencing AGRP neurons did not directly reinforce instrumental responding. n.s. p>0.05 Values are means ± s.e.m.
Extended Data Figure 4
Extended Data Figure 4. Lever pressing for food is sensitive to AGRP neuron photostimulation duration
a, Experimental design of progressive ratio 7 lever-press experiment from Fig. 3 for a FR AGRP neuron photostimulated group and an AL-fed non-photostimulated group. The two additional groups of mice were trained to lever press in food-restriction on a PR7 reinforcement schedule. For the food-restricted with photostimulation group, mice were maintained on food-restricted and tested with PR7 reinforcement tests over 15 sessions with photostimulation. Each session was 2-h, where levers were available for the first 40 minutes of the session, and photostimulation was delivered for the length of the session (120 min, grey). Mice were then ad libitum re-fed and tested on a non-photostimulated PR7 session. For the AL-fed non-photostimulated group, mice were ad libitum re-fed following lever-press training and tested with PR7 reinforcement tests over 16 sessions, with no photostimulation delivered (beige). b, Lever presses for each PR7 session for FR AGRP neuron photostimulated mice (grey, n=11) mice and AL-fed non-photostimulated mice (beige, n=8). For comparison, data are shown for food-restricted and 120-min-photostimulated groups that are reproduced from Fig. 3b. c, Lever presses on first (1) and last (15) sessions in PR7 test for food-restricted with photostimulation mice (grey) mice and sated no photostimulation mice (beige). Also shown are data for food-restricted and 120-min-photostimulated groups that are reproduced from Fig. 3c. e, Experimental design of progressive ratio 7 lever-press experiment from Fig. 3 for a 40-min photostimulation group. One additional group of mice was trained to lever press in food-restriction on a PR7 reinforcement schedule. Mice were then ad libitum re-fed and tested with PR7 reinforcement tests over 15 sessions. Each session was 2-h, where levers were available for the first 40 minutes of the session, and photostimulation was delivered only while levers were available (grey). A non-photostimulated PR7 session was also performed after the 15th test session. f, Lever presses for each PR7 session for 40-min-photostimulated (grey, n=12) mice. Also shown are data for food-restricted and 120-min-photostimulated groups that are reproduced from Fig. 3b. g, Lever presses on first (1) and last (15) sessions in PR7 test for 40-min-photostimulated mice (grey). Also shown are data for food-restricted and 120-min-photostimulated groups that are reproduced from Fig. 3c. n.s. p>0.05, **p<0.01, ***p<0.001. Values are means ± s.e.m.
Extended Data Figure 5
Extended Data Figure 5. AGRP neuron-associated body weight increase does not suppress AGRP neuron-evoked food-seeking
a, Weight gain for the 120-min AGRP neuron photostimulated (n=11) group in the PR7 experiment (from Fig. 3) after 15 sessions. Weight gain is due to eating after the test session when the mouse is returned to the homecage and is associated with long-lasting effects from release of AGRP. Previous experiments have shown that AGRP is not responsible for the acute feeding behavior investigated in this study,,. However, metabolic changes associated with weight gain could be an alternative cause of reduced instrumental food-seeking shown in Fig. 3. To test the effect of weight gain in mice trained to lever press for food on a PR7 reinforcement schedule, we induced weight gain without the negative reinforcement extinction protocol from Fig. 3. b, Experimental design of progressive ratio-7 lever-press experiment with AGRP neuron photostimulation-induced weight gain but lacking disruption of negative reinforcement during food-seeking. AGRPChR2 mice were trained under food deprivation to lever press under a PR7 schedule for food pellets. After training, both groups were ad libitum re-fed, and the mice were divided into two groups: 1) control mice with no induction of weight gain (blue) and 2) the induced weight gain group (red). Both groups were then tested on a PR7 reinforcement schedule under AGRP neuron photostimulation conditions (PR7 Test 1). Following this session, a photostimulation-induced weight gain protocol was initiated for the second group. Mice received one 2-h experimental session per day, where they were photostimulated for the whole experimental session and body weight was monitored daily. During these sessions, levers were not available, but free food was provided during these sessions (the amount of food was matched in quantity to the average amount of food acquired by the 120 min photostimulation group under the PR7 experiment from Fig. 3 for the corresponding session). The photostimulation-induced weight grain protocol was conducted for 22 consecutive days, which was required for percent body weight gain to be comparable to levels acquired by the 120-min AGRP neuron photostimulation group in the PR7 experiment (~28%) from Fig 3. Control mice were tethered to a fibre but did not receive photostimulation, otherwise they received the same experimental manipulation as induced weight gain mice (access to the same amount of food), and their body weight was also monitored. After the induced weight gain group achieved a 28% weight gain, a second PR7 test was conducted for both groups in the same manner as the first one. c, Percent body weight change for control (blue, n=6) and induced weight gain (red, n=6) mice. Grey dotted line: percent body weight change for photostimulated mice in PR7 experiment from Fig. 3. d, Lever presses for control (blue) and AGRP neuron photostimulation-induced weight gain (red) mice on first (1) and second (2) PR7 test, prior and after weight gain induction protocol, respectively. There is no significant reduction in lever pressing between PR7 sessions within either group. n.s. p>0.05, ***p<0.001. Values are means ± s.e.m.
Extended Data Figure 6
Extended Data Figure 6. Free food consumption is not reduced with repeated daily AGRP neuron photostimulation sessions
a, Experimental design of free feeding experiment over repeated sessions. Three groups of AGRPChR2 mice were tested on a 15 session free feeding protocol (no lever pressing required) either under food restriction (black), ad libitum fed AGRP neuron photostimulated (cyan), or ad libitum fed without AGRP neuron photostimulation (grey) conditions. On each day, mice received one 2-hour session, where food was freely available for the first 40 minutes of the session. AGRP neuron photostimulated group received photostimulation for the entire 2 hour session (cyan). b, Food intake for each session of the free feeding experiment for food restricted (black, n=6), AGRP neuron 120-min-photostimulated (cyan, n=6), and no photostimulation (grey, n=6) groups. n.s. p>0.05. Values are means ± s.e.m.
Extended Data Figure 7
Extended Data Figure 7. Calcium imaging of AGRP neurons in freely moving mice
a, Projection of confocal images of AGRP neurons from brain slices after mice expressed GCaMP6s for 10 months after viral injection. >99.5% neurons show nuclear exclusion of GCaMP6s, indicating good cell health. Red arrow, rare example of filled nucleus. Scale bar, 15 μm. b, In AGRP neurons, characterization of the relationship between action potential firing rate (cell attached recordings) and change of GCaMP6f fluorescence activity in brain slices by puffing AMPA for activation (top, middle) or muscimol for inhibition (bottom). c, Epifluorescence images of AGRPGCaMP6f neurons (left) from AL-mice after ghrelin injection by deep-brain calcium imaging and their ROI spatial filters (right) for image analysis. Scale bar, 15 μm. d, For freely moving AL-fed mice during in vivo imaging, fluorescence traces of individual AGRPGCaMP6f neurons in (c) before and after ghrelin injection (fluorescence responses separated in time by 4 min, during which time ghrelin was injected). e, Changes in mean Ca2+ activity before and 4 min after ghrelin/saline injections (90 neurons, 4 AL-fed mice). f, Time course of changes in mean Ca2+ activity after ghrelin (blue) or saline (red) injection (90 neurons, 4 mice). Green dashed line: exponential fit. g, Distribution of individual time constants for decline of ghrelin-mediated fluorescence increase for individual neurons showing goodness of fit >0.85 (67/90 neurons, 4 mice). h, Baseline GCaMP6f fluorescence at the start of each trial before 1 min exposure to food/wood in each trial. i, GCaMP6f fluorescence comparing initial baseline activity, exposure to an inaccessible but visible food outside the cage, and subsequent consumption of food (60 neurons, 2 mice). n.s. p>0.05, ***p<0.001. Multiple comparisons with Holm's correction. Values are means ± s.e.m.
Extended Data Figure 8
Extended Data Figure 8. SFO neuron-evoked water seeking and consumption
a, Schematic of injection targeting of hM3Dq-mCherry to SFO neurons. b, Epifluorescence image of mCherry fluorescence in a coronal section containing the SFO (box) targeted stereotaxically by co-injection of rAAV-hSyn-Cre and rAAV-Ef1a-DIO-hM3Dq-mCherry. Scale bar, 1 mm. c, Confocal micrograph of SFO neurons co-transduced with rAAV-hSyn-Cre and rAAV-Ef1a-DIO-hM3Dq-mCherry. Scale, 100 μm. d, Number of licks for a representative SFOhM3Dq mouse during evoked water consumption following activation of SFO neurons by CNO injection. e, Number of licks for SFOhM3Dq mice following saline or CNO injection (n=5 mice). f, Cumulative lever pressing for a SFOhM3Dq mouse following injection of CNO (red) or saline (black). g,h, For SFOhM3Dq mice, lever presses (red/black: active lever, grey: inactive lever) (g) and breakpoint reinforcement ratio (h) on a PR-3 water reinforcement schedule following either saline or CNO injection (n = 5 mice). i, (top) Experimental design to test if activation of SFO neurons can elicit food consumption in the absence of water. SFOhM3D mice were presented with access to food but not water for one hour (pre), which was followed by CNO injection, and food intake was measured for an additional hour. (bottom) Food intake by SFOhM3D mice that lack access to water before (pre) and after the application of CNO (paired t-test, n=3). k, (top) Experimental design to test if activation or offset of SFO neurons elevate food consumption behavior. SFONOS1-ChR2 mice had access to food and water, and both were measured before (1-h, pre), during (20 Hz, 1-h), and after photostimulation (1-h, post). (bottom) Food consumed by SFONOS1-ChR2 mice before (pre), during (20 Hz), or after (post) photostimulation (paired t-test, n=5). n.s. p>0.05. Values are means ± s.e.m.
Figure 1
Figure 1. AGRP neurons condition flavour preference
a, Optical fibre position over the arcuate nucleus (ARC). b, ChR2-EYFP in AGRP neurons (box). Scale, 1 mm. c,d, Fos immunofluorescence following photostimulation in AGRPEGFP (c) or AGRPChR2 (d) mice. Scale, 100 μm. e, Experimental design of conditioned flavour preference assay in AL-fed AGRPChR2 or AGRPEGFP mice. f, Change in preference for flavour paired with light in AGRPEGFP and AGRPChR2 mice (EGFP, n=6; ChR2, n=8). g,h Injection of rAAV (g) for Cre-dependent expression of PSAML141F-GlyR-IRES-EGFP in (h) AGRP neurons. i, Image of virally transduced AGRP neurons showing PSAML141F-GlyR-IRES-EGFP expression. Scale, 1 mm. j, Chow food intake reduction for food-restricted (FR) mice treated with PSEM89S grouped by transgene transduction efficiency (low:<50%, n=13; high:>50%, n=16) k, Change in preference for flavour paired with PSEM89S injection in FR AGRPPSAM-GlyR mice. l, Change in preference correlates with reduction of chow food intake (n=29 mice). m, Flavour preference pre- and post-conditioning for mice grouped by post hoc food intake reduction test. *p<0.05, **p<0.01, ***p<0.001. Values are means ± s.e.m. Statistical analysis in Extended Data Table 1.
Figure 2
Figure 2. AGRP neurons condition place preference
a, Experimental design of place preference conditioning with chemogenetic silencing. Red bar: chemogenetic silencing side. b,b’, For a FR AGRPPSAM-GlyR mouse, scatter plot of position and a heat map showing percent occupancy time. c, Change in occupancy time for AGRPEGFP mice (n=13), FR AGRPPSAM-GlyR mice (n=20) or AL AGRPPSAM-GlyR mice (n=9) with >50% PSAML141F-GlyR transduction efficiency after conditioning with PSEM89S injections. d,e, Change in occupancy time for side paired with PSEM89S is correlated with (d) PSAML141F-GlyR transduction efficiency (n=26 mice) and (e) chow food intake reduction for mice treated with PSEM89S (n=35 mice). f, Preference shift is correlated for place and flavour conditioning. g, Experimental design for place conditioning during optogenetic activation. Blue bar: photostimulated side. h,h’, For an AGRPChR2 mouse, scatter plots of position and heat maps showing percent occupancy time. i,j, Percent occupancy time on photostimulated side for AGRPEGFP (open circles, n =12) or AGRPChR2 (filled circles, n =12) mice during (i) 15-min conditioning sessions (2-way repeated measures ANOVA, group: F(1,154)=3.0, p=0.097; session: F(7,154)=2.3, p=0.029; interaction: F(7,154)=3.3, p=0.003) and (j) second half of each 15-min session (group: F(1,154)=6.4, p=0.019; session: F(7,154)=3.2, p=0.004; interaction: F(7,154)=3.8, p<0.001). k, Change in occupancy time on the previously photostimulated side for AGRPEGFP (open circles, n=12) or AGRPChR2 (filled circles, n=12) mice during 1800-s extinction session. *p<0.05, **p<0.01, ***p<0.001. Values are means ± s.e.m. Statistical analysis in Extended Data Table 1.
Figure 3
Figure 3. Modulation of instrumental responding for food
a, Experimental design. AGRPChR2 mice were trained to lever press for food pellets. PR7 reinforcement testing was performed over 15 sessions on two groups: food-restricted (black, n=11) or ad libitum fed AGRP neuron photostimulated (cyan, n=11). During test sessions (120 min), levers were available for the first 40 minutes. The AGRP neuron photostimulated group received intracranial light pulses for the entire 120-min session. b, Lever presses in each session during PR7 reinforcement. c-e, Lever presses (c), pellets earned (d), and breakpoint ratio (e) from first (1) and last (15) PR7 reinforcement test sessions. f, Representative traces of cumulative lever pressing during first (1) and last (15) sessions. g, Rate of lever pressing during first 10 minutes of session (low effort reinforcement, filled circles) and rest of session (high-effort reinforcement, open circles) on first (1) and last (15) PR7 session. n.s. p>0.05, *p<0.05, **p<0.01, ***p<0.001. Values are means ± s.e.m. Statistical analysis in Extended Data Table 1.
Figure 4
Figure 4. Food rapidly reduces AGRP neuron activity
a,b Configuration for deep-brain calcium imaging from AGRP neurons in freely-moving mice. c,d, Image of AGRPGCaMP6f neurons (c) by deep-brain calcium imaging and their ROI spatial filters (d) for image analysis. Scale bar, 15 μm. e, Change in baseline GCaMP6 fluorescence for neurons in mice under AL-fed and FR conditions (61 neurons, 4 mice). f, From FR mice, GCaMP6f fluorescence traces from subset of individual neurons in (c,d) during chow pellet food consumption. Black line, food delivery. Blue bars, food consumption. g, Normalised Ca2+ responses of AGRP neurons (99 neurons, 4 FR mice) during exposure to a chow food pellet (left) and a false food pellet (right). Black lines, chow/false food delivery. Red lines, first contact with chow/false food. h, Mean calcium responses to chow food and false food aligned to delivery time (99 neurons, 4 FR mice). Shading: s.e.m. i, Change in normalised GCaMP6 fluorescence comparing initial baseline activity, first food exposure, and after consuming to satiety (110 neurons, 4 FR mice). j, GCaMP6f fluorescence traces from 2 example neurons (2 mice) during short trials of food (top) and false food (bottom) delivery. k, Mean GCaMP6 fluorescence responses from individual mice to chow food exposure aligned with food delivery (left) and food contact (right). l, Mean GCaMP6 fluorescence responses before (black) and after (red) cued Pavlovian trace conditioning (before: 60 neurons, after: 65 neurons, 3 mice). Black and red bars, range for first lick of liquid food. Shading: s.e.m. ***p<0.001. Values are means ± s.e.m.
Figure 5
Figure 5. Virtual dehydration state is avoided
a, Optical fibre position over SFO (box). b, Expression of ChR2-EYFP in SFONOS1 neurons. Scale, 1 mm. c,c’, Fos immunofluorescence following photostimulation in SFONOS1-ChR2 mice. Scale, 100 μm. d, Water consumption by SFONOS1-ChR2 mice either before or during photostimulation (1 h) at different frequencies (n=8). ef’, Closed-loop place preference for SFONOS1-ChR2 mice (filled circles, n=12) and untransfected controls (open circles, n=6) as in Fig. 3e. Blue bar: photostimulated side. (group: F(1,112)=26.2, p<0.001; session: F(7,112)=0.74, p=0.64; interaction: F(7,112)=4.25, p<0.001). g, Change in occupancy time during an extinction session for the photostimulated side for SFONOS1-ChR2 mice (n=12) and untransfected controls (n=6).*p<0.05, **p<0.01, ***p<0.001. Values are means ± s.e.m.

Comment in

References

    1. van den Top M, Lee K, Whyment AD, Blanks AM, Spanswick D. Orexigen-sensitive NPY/AgRP pacemaker neurons in the hypothalamic arcuate nucleus. Nat. Neurosci. 2004;7:493–494. - PubMed
    1. Krashes MJ, et al. Rapid, reversible activation of AgRP neurons drives feeding behavior in mice. J Clin Invest. 2011;121:1424–1428. - PMC - PubMed
    1. Luquet S, Perez FA, Hnasko TS, Palmiter RD. NPY/AgRP neurons are essential for feeding in adult mice but can be ablated in neonates. Science. 2005;310:683–685. - PubMed
    1. Aponte Y, Atasoy D, Sternson SM. AGRP neurons are sufficient to orchestrate feeding behavior rapidly and without training. Nat. Neurosci. 2011;14:351–355. - PMC - PubMed
    1. Atasoy D, Betley JN, Su HH, Sternson SM. Deconstruction of a neural circuit for hunger. Nature. 2012;488:172–177. - PMC - PubMed

Publication types

Substances