. 2015 Apr 23;16(5):9037-63.
doi: 10.3390/ijms16059037.

Overexpressing of OsAMT1-3, a High Affinity Ammonium Transporter Gene, Modifies Rice Growth and Carbon-Nitrogen Metabolic Status

Affiliations

Overexpressing of OsAMT1-3, a High Affinity Ammonium Transporter Gene, Modifies Rice Growth and Carbon-Nitrogen Metabolic Status

Aili Bao et al. Int J Mol Sci. .

Abstract

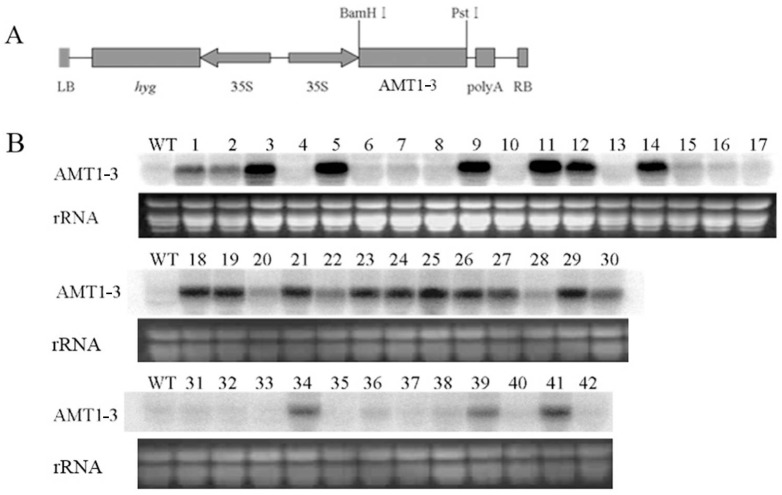
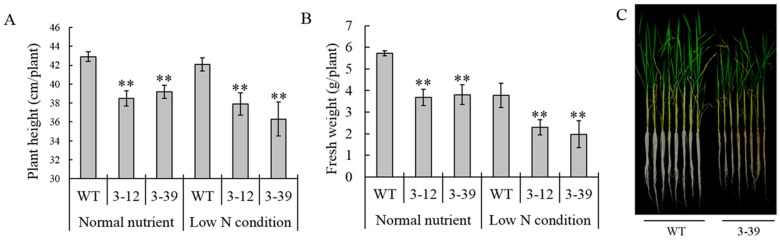
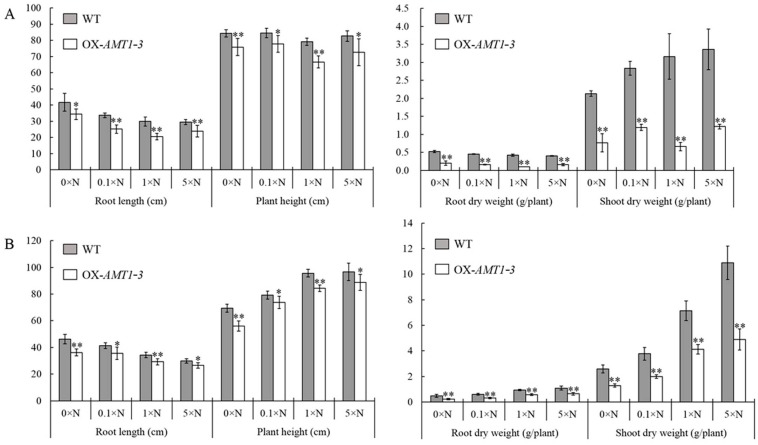
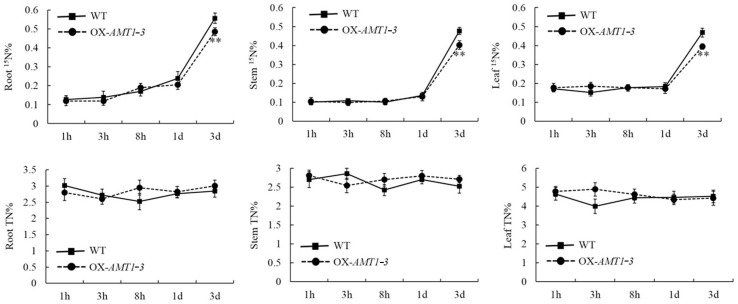
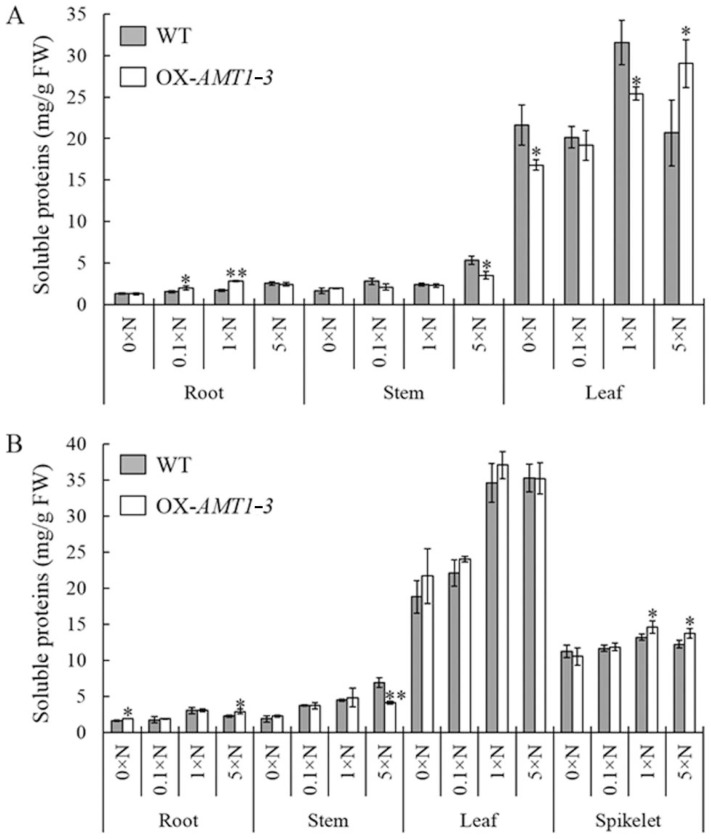
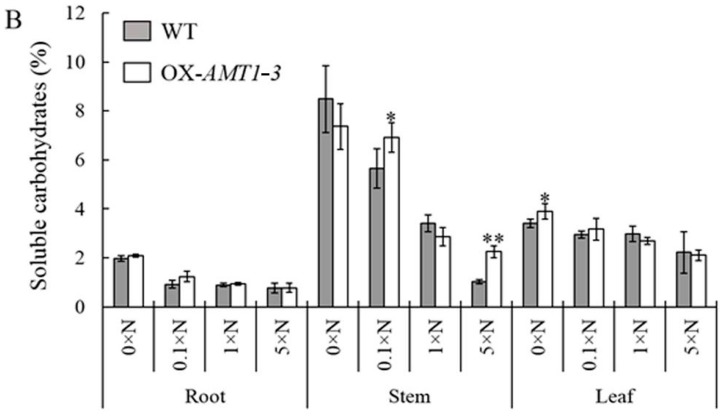
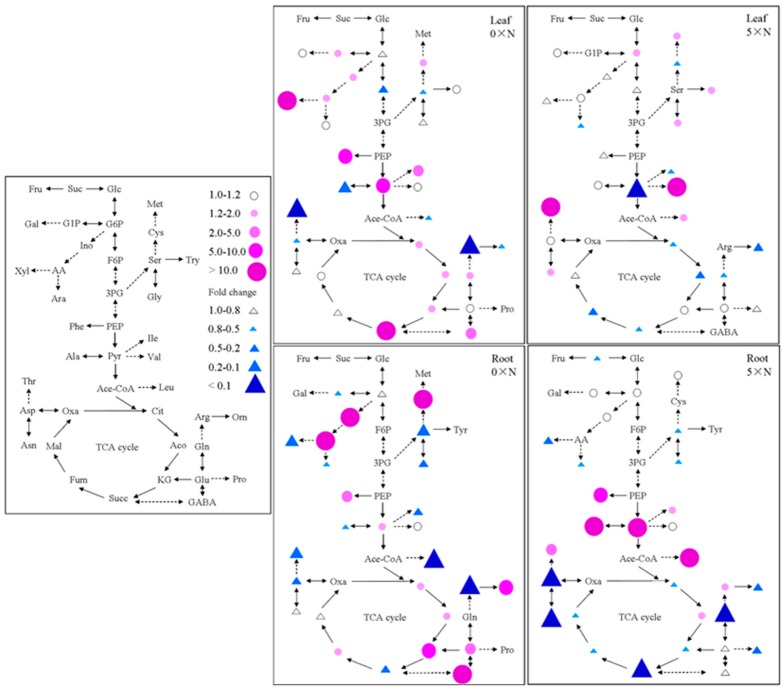
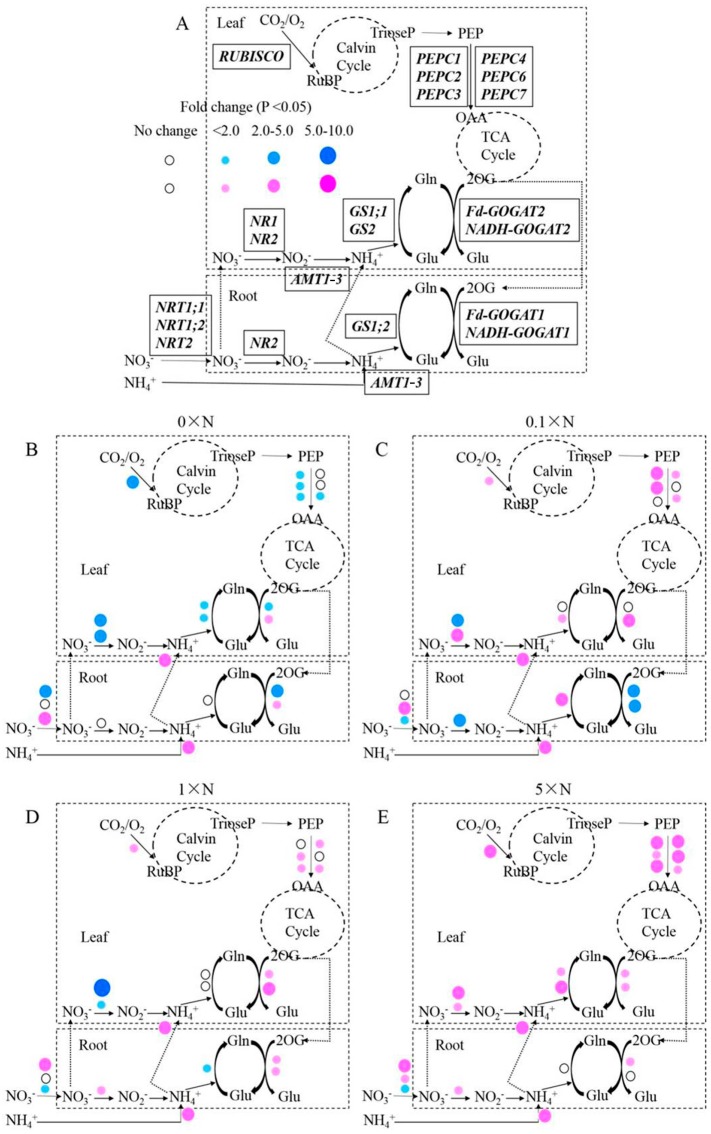
AMT1-3 encodes the high affinity NH₄⁺ transporter in rice roots and is predominantly expressed under nitrogen starvation. In order to evaluate the effect of AMT1-3 gene on rice growth, nitrogen absorption and metabolism, we generated AMT1-3-overexpressing plants and analyzed the growth phenotype, yield, carbon and nitrogen metabolic status, and gene expression profiles. Although AMT1-3 mRNA accumulated in transgenic plants, these plants displayed significant decreases in growth when compared to the wild-type plants. The nitrogen uptake assay using a 15N tracer revealed poor nitrogen uptake ability in AMT1-3-overexpressing plants. We found significant decreases in AMT1-3-overexpressing plant leaf carbon and nitrogen content accompanied with a higher leaf C/N ratio. Significant changes in soluble proteins and carbohydrates were also observed in AMT1-3-overexpressing plants. In addition, metabolite profile analysis demonstrated significant changes in individual sugars, organic acids and free amino acids. Gene expression analysis revealed distinct expression patterns of genes that participate in carbon and nitrogen metabolism. Additionally, the correlation between the metabolites and gene expression patterns was consistent in AMT1-3-overexpressing plants under both low and high nitrogen growth conditions. Therefore, we hypothesized that the carbon and nitrogen metabolic imbalance caused by AMT1-3 overexpressing attributed to the poor growth and yield of transgenic plants.


Figures

Figure 1
Figure 1
Generation of transgenic plants that overexpressing the AMT1-3 gene. (A) The construct of the plasmid containing a derivative of the CaMV 35S promoter (35S), AMT1-3 and the poly A terminator between the right (RB) and the left (LB) borders of the T-DNA. The hygromycin resistance gene (hyg) was located between the LB and the 35S promoter; (B) Northern blot analysis of the AMT1-3 mRNA transcriptional levels in 42 positive transgenic plants of the T0 generation and the wild-type plants (WT).
Figure 2
Figure 2
Phenotype analysis at the seedling stage. The growth phenotype (A), plant height (B) and plant fresh weight (C) of the AMT1-3-overexpressing plants (3–12, 3–39) and wild type plants (WT) at the seedling stage. Values are the mean ± s.d. of eight randomly selected plants. ** indicates the significant difference at the level of p = 0.01.
Figure 3
Figure 3
Phenotype analysis at the tillering and heading stages. The root length, plant height, root and shoot dry weight in the AMT1-3-overexpressing plants (we renamed 3–39 as OX-AMT1-3) and wild type plants (WT) at the tillering stage (A) and the heading stage (B) under 0× N, 0.1× N, 1× N and 5× N conditions. Values are the mean ± s.d. of ten randomly selected plants. *, ** indicate the significant differences at the level of p = 0.05 and p = 0.01, respectively.
Figure 4
Figure 4
Nitrogen uptake analysis. The 15N (15N%) and total nitrogen content (TN%) in the roots, stems and leaves of the AMT1-3-overexpressing plants (we renamed 3–39 as OX-AMT1-3) and wild type plants (WT) at 1, 3, 8 h, 1 and 3 day after NH4Cl in the nutrient solution was replaced with 15NH4Cl during the tillering stage. Values are the mean ± s.d. of six randomly selected plants. ** indicates the significant difference at the level of p = 0.01.
Figure 5
Figure 5
Soluble proteins analysis. The concentration of soluble proteins in the roots, stems and leaves of the AMT1-3-overexpressing plants (we renamed 3-39 as OX-AMT1-3) and wild type plants (WT) at the tillering stage (A) and the heading stage (B) under 0× N, 0.1× N, 1× N and 5× N conditions. Values are the mean ± s.d. from three biological replications. *, ** indicate the significant differences at the level of p = 0.05 and p = 0.01, respectively.
Figure 6
Figure 6
Soluble carbohydrates analysis. The concentration of soluble carbohydrates in the roots, stems and leaves of the AMT1-3-overexpressing plants (we renamed 3–39 as OX-AMT1-3) and wild type plants (WT) at the tillering stage (A) and the heading stage (B) under 0× N, 0.1× N, 1× N and 5× N conditions. Values are the mean ± s.d. from three biological replications. *, ** indicate the significant differences at the level of p = 0.05 and p = 0.01, respectively.
Figure 6
Figure 6
Soluble carbohydrates analysis. The concentration of soluble carbohydrates in the roots, stems and leaves of the AMT1-3-overexpressing plants (we renamed 3–39 as OX-AMT1-3) and wild type plants (WT) at the tillering stage (A) and the heading stage (B) under 0× N, 0.1× N, 1× N and 5× N conditions. Values are the mean ± s.d. from three biological replications. *, ** indicate the significant differences at the level of p = 0.05 and p = 0.01, respectively.
Figure 7
Figure 7
Metabolites analysis. Fold change corresponds to the ratio of the concentration of individual metabolites involved in carbon and nitrogen metabolism in the AMT1-3-overexpressing plants relative to the wild type plants for the leaves and roots at the tillering stage under 0× N and 5× N conditions. Glc, glucose; Suc, sucrose; Fru, Fructose; F6P, Frutose-6-P; G6P, Glucose-6-P; G1P, Glucose-1-P; Gal, galactose; Ino, Inositol; AA, Ascorbic acid; Ara, Arabinose; Xyl, Xylitol; 3PG, 3-P-glycerate; PEP, P-enolpyruvate; Pyr, Pyruvate; Ace-CoA, acetyl-CoA; Cit, Citrate; Aco, Aconitase; KG, Ketoglutarate; Succ, Succinate; Fum, Fumarate; Mal, Malate; Oxa, oxaloacetate; Glu, Glutamate; Gln, Glutamine; Arg, Arginine; Pro, Proline; Orn, Ornithine; GABA, Aminobutyric; Asp, Aspartate; Asn, Asparagine; Ile, Isoleucine; Met, Methionine; Thr, Threonine; Ala, Alanine; Val, Valine; Leu, Leucine; Phe, Phenylalanine; Try, Tryptophan; Ser, Serine; Gly, Glycine; Cys, Cysteine. Red dots indicate increased metabolites and blue triangles indicate decreased metabolites.
Figure 8
Figure 8
Gene expression analysis. Fold change corresponds to the ratio of the gene expression level in the AMT1-3-overexpressing plants relative to the wild type plants. (A) Diagrammatic representation of the key genes involved in the carbon and nitrogen metabolic pathway in rice plants. NRT, nitrate transporter; NR, nitrate reductase; GS, glutamine synthetase; GOGAT, glutamate synthase; RUBISCO, ribulose-1,5-bisphosphate carboxylase/oxygenase; PEPC, phosphoenolpyruvate carboxylase. Prominent changes in the gene expression level in the AMT1-3-overexpressing plants compared to wild type plants at the tillering stage under 0× N (B); 0.1× N (C); 1× N (D) and 5× N (E) conditions. Red and blue dots indicate up- and down-regulated genes, respectively.

References

    1. Lam H.M., Coschigano K.T., Oliveira I.C., Melo-Oliveira R., Coruzzi G.M. The molecular-genetics of nitrogen assimilation into amino acids in higher plants. Ann. Rev. Plant Physiol. Mol. Biol. 1996;47:569–593. doi: 10.1146/annurev.arplant.47.1.569. - DOI - PubMed
    1. Tabuchi M., Abiko T., Yamaya T. Assimilation of ammonium ions and reutilization of nitrogen in rice (Oryza sativa L.) J. Exp. Bot. 2007;58:2319–2327. doi: 10.1093/jxb/erm016. - DOI - PubMed
    1. Frink C.R., Waggoner P.E., Ausubel J.H. Nitrogen fertilizer: Retrospect and prospect. Proc. Natl. Acad. Sci. USA. 1999;96:1175–1180. doi: 10.1073/pnas.96.4.1175. - DOI - PMC - PubMed
    1. Crawford N.M., Forde B.G. Molecular and developmental biology of inorganic nitrogen nutrition. In: Meyerowitz E., Somerville C., editors. The Arabidopsis Book. American Society of Plant Biologists; Rockville, MD, USA: 2002. - PMC - PubMed
    1. Howitt S.M., Udvardi M.K. Structure, function and regulation of ammonium transporters in plants. Biochim. Biophys. Acta. 2000;1465:152–170. doi: 10.1016/S0005-2736(00)00136-X. - DOI - PubMed

Publication types

LinkOut - more resources