. 2015 Apr 27;13(4):e1002135.
doi: 10.1371/journal.pbio.1002135. eCollection 2015 Apr.

Extracellular adenosine mediates a systemic metabolic switch during immune response

Affiliations

Extracellular adenosine mediates a systemic metabolic switch during immune response

Adam Bajgar et al. PLoS Biol. .

Abstract

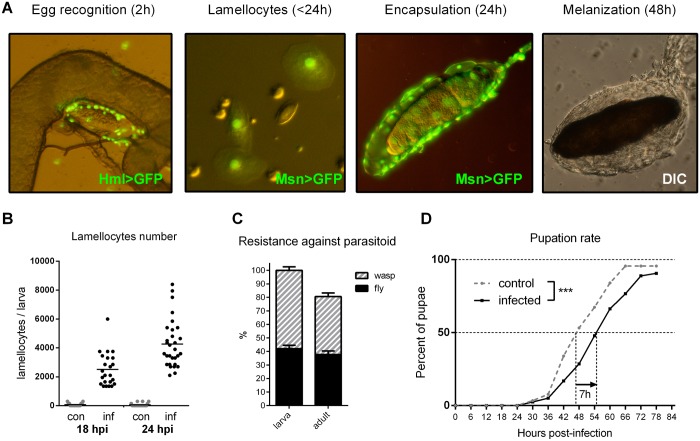
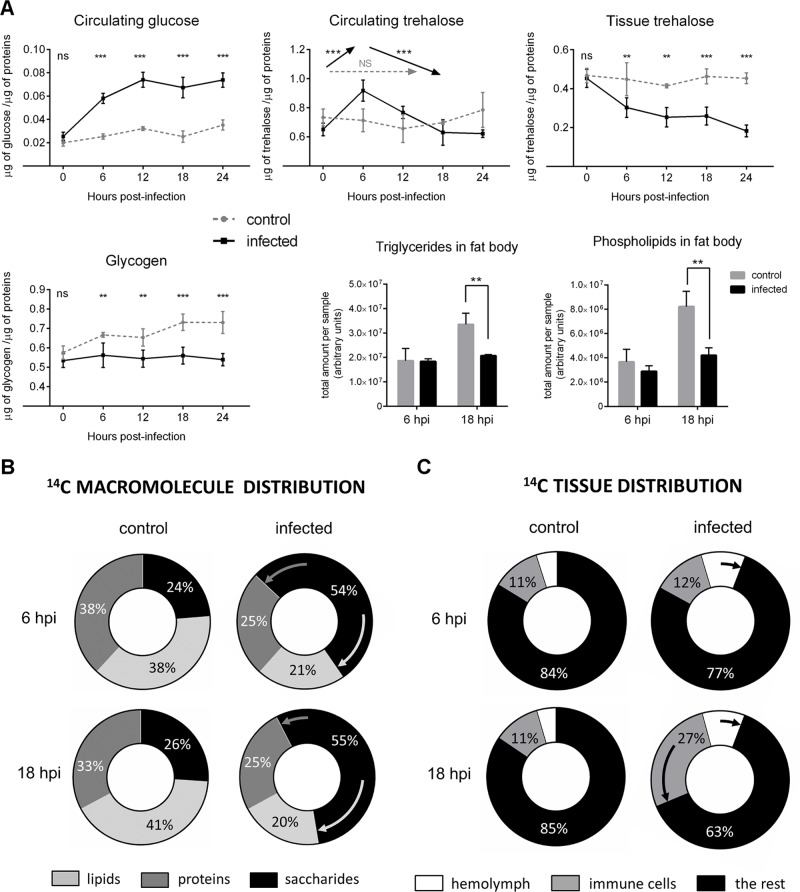
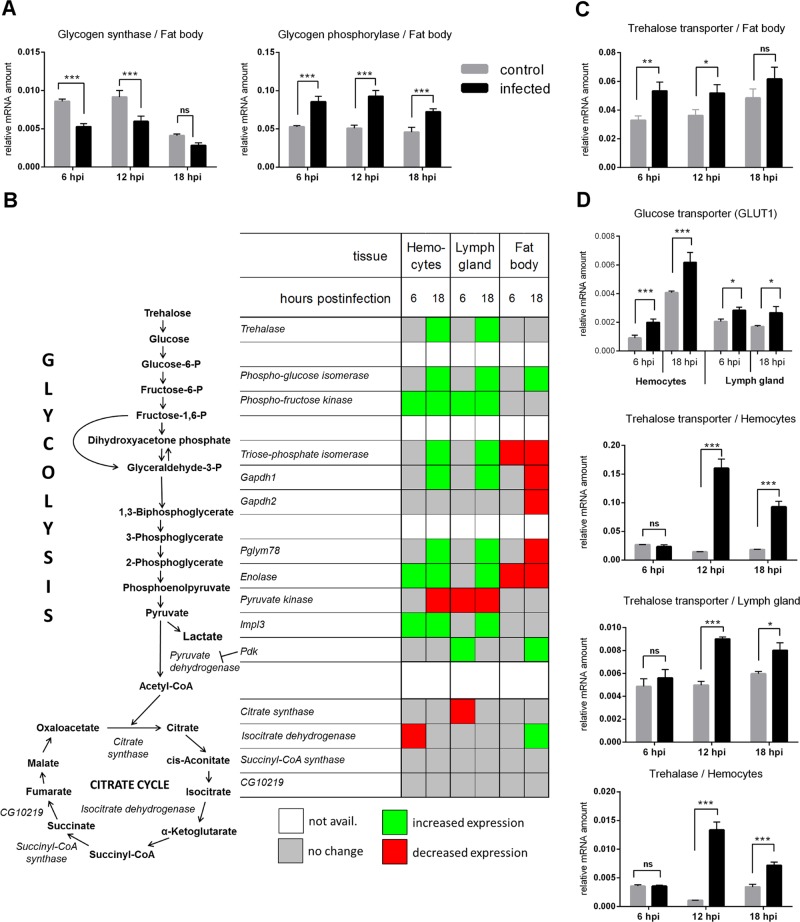
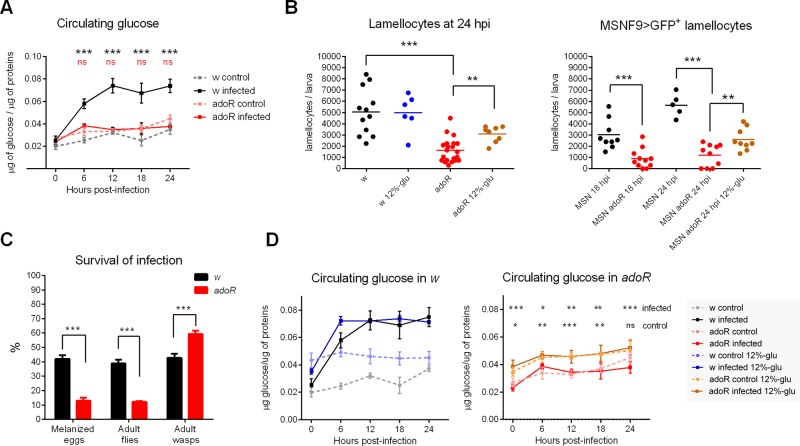
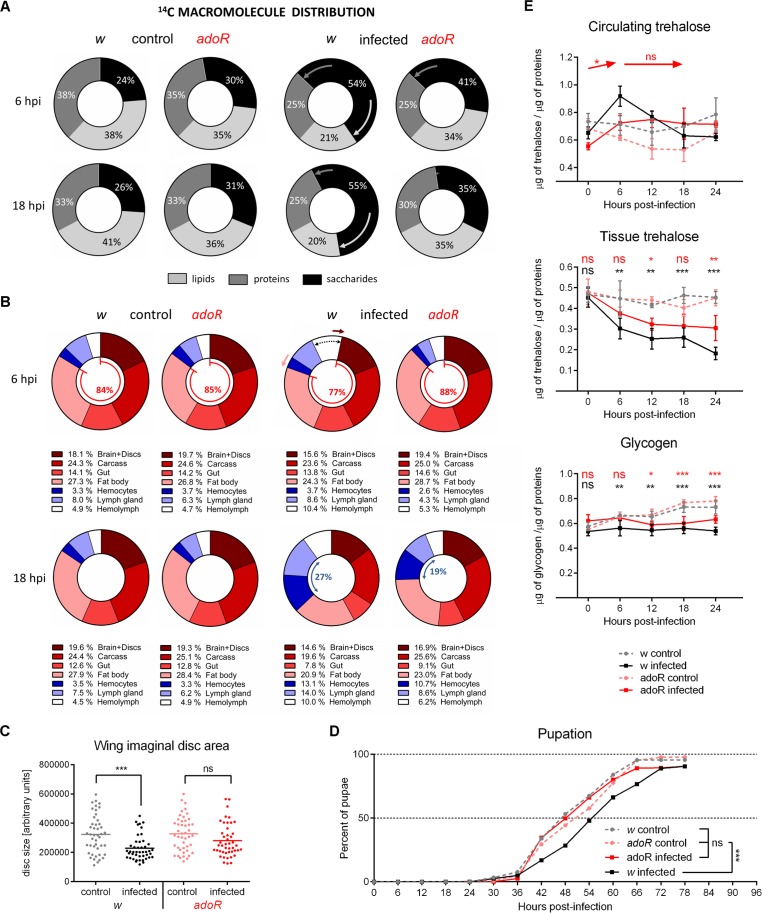
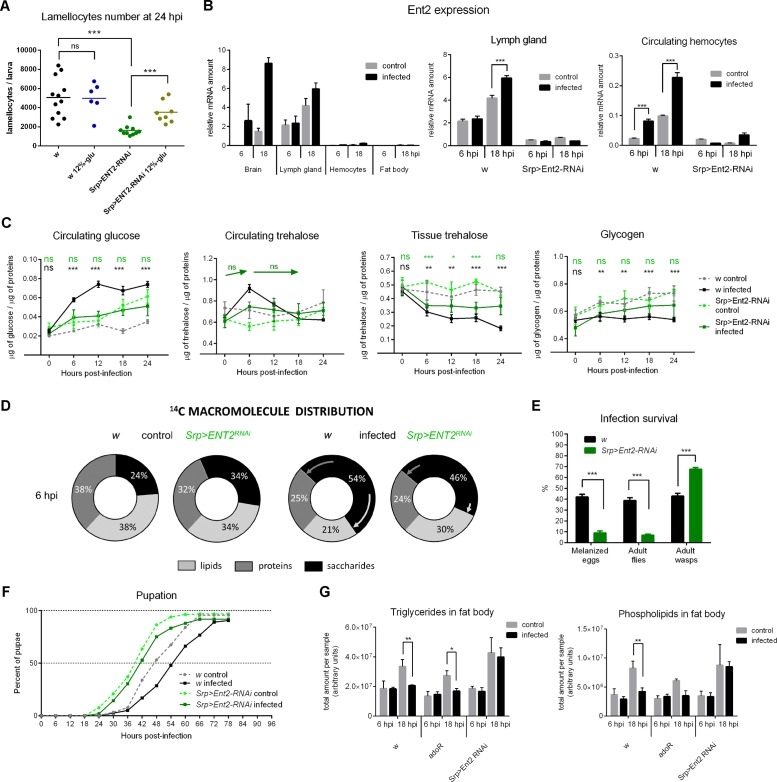
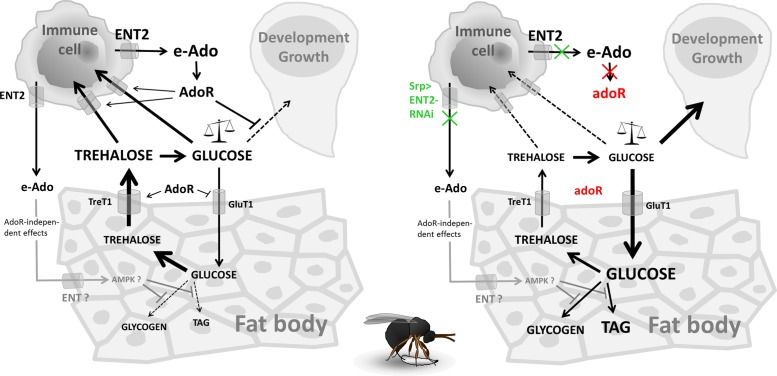
Immune defense is energetically costly, and thus an effective response requires metabolic adaptation of the organism to reallocate energy from storage, growth, and development towards the immune system. We employ the natural infection of Drosophila with a parasitoid wasp to study energy regulation during immune response. To combat the invasion, the host must produce specialized immune cells (lamellocytes) that destroy the parasitoid egg. We show that a significant portion of nutrients are allocated to differentiating lamellocytes when they would otherwise be used for development. This systemic metabolic switch is mediated by extracellular adenosine released from immune cells. The switch is crucial for an effective immune response. Preventing adenosine transport from immune cells or blocking adenosine receptor precludes the metabolic switch and the deceleration of development, dramatically reducing host resistance. Adenosine thus serves as a signal that the "selfish" immune cells send during infection to secure more energy at the expense of other tissues.


Conflict of interest statement

The authors have declared that no competing interests exist.

Figures

Fig 1
Fig 1. Immune response to parasitoid wasp intrusion.
(A) Progressive stages of the response. The wasp egg is recognized by plasmatocytes (green, Hml>GFP) within 2 hpi. Lamellocytes, labeled by the Msn>GFP marker appear in circulation (<24 hpi) and start to encapsulate the egg. At 48 hpi, the egg is fully encapsulated by a multilayer of immune cells and melanized (original image of encapsulation published in [39]). (B) Number of lamellocytes per larva in control (con, grey) and infected (inf, black) larvae at 18 and 24 hpi. Each dot represents an individual larva; the horizontal lines indicate mean. (C) Percentage of host larvae with melanized wasp eggs (black, left column, mean 42%) and surviving host adults (black, right column, mean 38%) against winning wasp larvae and adults (hatched columns). Values are mean ± standard error of measurement (SEM). (D) Pupation of infected larvae (n = 316) was significantly delayed compared to control larvae (n = 344). Log-rank survival analysis (p < 0.0001).
Fig 2
Fig 2. Metabolic changes during immune response in w flies.
(A) Nutrient contents in the hemolymph, whole larval lysates, and fat body at different time points after infection (uninfected control: grey dashed line and grey column; infected: solid black line and column). Circulating glucose increases, tissue trehalose decreases, glycogen and lipids accumulation ceases upon infection; circulating trehalose first increases and then decreases making a 6 hpi peak. Values are mean ± SEM of four experiments (three for lipids). Asterisks show statistical significance (*p < 0.05; ** p < 0.005; *** p < 0.0005; ns, not significant) when compared between infected and control samples at indicated time points; arrows (Circulating trehalose, middle) indicate increase, decrease, and no change (NS), respectively, between time points. Significance of differences was tested by two-way ANOVA. (B) Percent incorporation of 14C-labeled dietary glucose into lipids, proteins, and saccharides in whole larvae. Incorporation into lipids and proteins decreases upon infection, enlarging saccharide fraction as indicated by arrows. (C) Percent distribution of 14C into the hemolymph, immune cells (circulating hemocytes, and lymph gland) and the rest of the larvae (brain, imaginal discs, gut, fat body, and carcass). 14C first increases in hemolymph at 6 hpi (from 5% to 10%) and then also in immune cells (from 11% to 27%) at the expense of the rest of the organism upon infection; arrows indicate infection-induced changes. This figure shows data for the w genotype; the same values are shown in subsequent figures when compared with other genotypes. See S2 Fig for statistical analysis.
Fig 3
Fig 3. Gene expression during immune response of w larvae measured by q-PCR.
(A) Reciprocal changes in mRNA expression of glycogen synthase and glycogen phosphorylase enzymes in the fat body. (B) Summary of significant changes in expression of glycolytic and citrate cycle enzymes in the hemocytes, lymph gland, and fat body (see S3–S5 Figs for corresponding graphs). Heat map indicates a tendency of glycolytic genes to increase in immune cells and to decrease in fat body. (C) Expression of trehalose transporter Tret1-1 in the fat body. (D) Expression of GLUT1, TreT1-1, and trehalase in the circulating hemocytes and lymph gland. All graphs except (B) show mean values of expression relative to Rp49 ± SEM from three independent experiments; grey columns: control larvae, black columns: infected larvae; asterisks indicate significant changes (tested by two-way ANOVA).
Fig 4
Fig 4. Effects of blocking signaling through adoR on immune response.
(A) Increase in circulating glucose level during infection is suppressed in the adoR mutant. Values are mean ± SEM of four experiments; black asterisks—comparison of w; red “ns” (not significant)—comparison of adoR; tested by two-way ANOVA. (B) Number of lamellocytes based on cell morphology and a lamellocyte-specific MSNF9>GFP marker. adoR larvae contain fewer lamellocytes than w or MSN controls. High-glucose diet (12%-glu) increases lamellocyte number in adoR larvae. Each dot represents lamellocyte count per larva, the lines are mean values; tested by unpaired t test. (C) adoR mutation significantly reduces the host resistance to parasitoid wasp as assessed from frequency of melanized eggs (adoR—13% versus w—42%; n = 100 Drosophila larvae per genotype in five experiments), emerged adult flies (adoR—12% versus w—38%; n = 310 for adoR, 316 for w, in three experiments). Values are mean ± SEM; tested by unpaired t test. (D) High-glucose diet (12%-glu) significantly increases circulating glucose both in uninfected w and adoR larvae and in infected adoR larvae (graph with w does not show statistical significance). Values are mean ± SEM of three experiments; tested by two-way ANOVA. In all panels, statistical significance of differences is indicated as *p < 0.05; ** p < 0.005; *** p < 0.0005; and ns, not significant.
Fig 5
Fig 5. Metabolic changes and developmental effects of AdoR deficiency.
(A) Incorporation of 14C-glucose into lipids and proteins is reduced upon infection in w but not in adoR larvae. Arrows indicate infection-induced changes. For statistical analysis, see S2 Fig. (B) Relative distribution of 14C in the hemolymph (white), immune cells (circulating hemocytes, dark blue; lymph gland, light blue), and the remaining body parts (brain with imaginal discs—brown; carcass, i.e., all the remnants after dissecting all other presented tissues—red; gut—light red; fat body—pink). Arrows indicate increasing 14C in hemolymph (black dashed arrow) of w at 6 hpi at the expense of brain+discs (brown arrow) and fat body (pink arrow); these changes are missing in adoR. Increase in hemolymph and in immune cells (blue arrow) of w at 18 hpi at the expense of all other tissues is smaller in adoR (less in immune cells and more in the rest). Legends below graphs show percentages in body parts. For detailed analysis, see S9 Fig and S10 Fig. (C) Growth of the wing imaginal discs is delayed by infection in w (unpaired t test p < 0.0001) but not in adoR larvae (p = 0.06). Each dot represents measured area of an individual disc at 18 hpi; horizontal lines indicate mean. (D) Pupation is delayed upon infection in w larvae (n = 316, control and 344, infected) but not in adoR larvae (n = 310, control and 293, infected). The rates were compared using Log-rank survival analysis; the p values are: w < 0.0001; adoR = 0.74; w control versus adoR control = 0.053; w control versus adoR infected = 0.054. (E) Nutrient contents in the hemolymph and whole larval lysates. Values are mean ± SEM of four experiments. Circulating trehalose in adoR does not form the 6 hpi peak of w; arrows show increase and no change (ns), respectively, when levels of infected adoR are compared between time points. Tissue trehalose show smaller differences for adoR and glycogen shows similar pattern to w. Asterisks show statistical significance when compared between infected and control animals at indicated time points (black for w, red for adoR). Tested by two-way ANOVA; for statistical analysis, see S2 Fig.
Fig 6
Fig 6. Effects of blocking adenosine transport in immune cells by ENT2 RNAi.
(A) Srp>ENT2-RNAi reduces lamellocyte number compared to w larvae, and high dietary glucose (12%-glu) significantly increases the lamellocyte number in Srp>ENT2-RNAi. Each dot represents lamellocyte count per larva; lines indicate mean. Differences were tested by unpaired t test. (B) ENT2 mRNA expression. Comparison of ENT2 mRNA expression in various tissues in w larvae shows a strong expression in brain and lymph gland, increasing in both upon infection. Srp>ENT2-RNAi reduces the ENT2 expression below 20% both in the lymph gland and hemocytes. Values are mean ± SEM of relative expression (normalized to Rp49 mRNA) of three experiments; tested by two-way ANOVA. (C) Nutrient contents in the hemolymph and whole larval lysates. Circulating glucose does not increase in Srp>ENT2-RNAi upon infection. Circulating trehalose in Srp>ENT2-RNAi does not form the 6 hpi peak of w; arrows indicate no change (ns) in levels of infected Srp>ENT2-RNAi when compared between time points. Tissue trehalose shows similar pattern to w. Glycogen does not differ between control and infected Srp>ENT2-RNAi indicating an accumulation of stores even upon infection. Asterisks show statistical significance when compared between infected and control animals at indicated time points (black for w, green for Srp>ENT2-RNAi). Values are mean ± SEM of four experiments; tested by two-way ANOVA. For statistical analysis, see S2 Fig. (D) Incorporation of 14C-glucose into lipids and proteins is reduced upon infection in w larvae but significantly less so in Srp>ENT2-RNAi larvae. Arrows indicate infection-induced changes. For statistical analysis, see S14 Fig. (E) Srp>ENT2-RNAi significantly reduces the host resistance to parasitoid wasp as assessed from frequency of melanized eggs (9% versus 42%; n = 100 Drosophila larvae per genotype in five experiments) and emerged adult flies (7% versus 38%; n = 316 for w, 343 for Srp>ENT2-RNAi in three experiments). Values are mean ± SEM; tested by unpaired t test. (F) Uninfected Srp>ENT2-RNAi larvae (n = 377) pupate 8 h earlier than uninfected w larvae, and infection only delays their pupation by 2 h (n = 343). Compared using Log-rank survival analysis (p < 0.0001 for all comparisons). (G) Total amount of TAG and phospholipids in the fat body of w, adoR, and Srp>ENT2-RNAi larvae. While infection suppresses TAG storage in w and adoR, TAG grows unaffected by infection in Srp>ENT2-RNAi. Data are mean values of mass spectra peak area per sample ± SEM; tested by two-way ANOVA.
Fig 7
Fig 7. Model of metabolic shifts mediated by e-Ado during immune response.
Left—wild-type situation upon infection. Right—situation without e-Ado upon infection; blocking AdoR signaling by adoR mutation is marked in red, blocking Ado transport from immune cells by Srp>ENT2-RNAi is marked in green. See text for details.

Comment in

References

    1. Fong YM, Marano M a, Moldawer LL, Wei H, Calvano SE, Kenney JS, et al. The acute splanchnic and peripheral tissue metabolic response to endotoxin in humans. J Clin Invest. 1990;85: 1896–1904. - PMC - PubMed
    1. Straub RH, Cutolo M, Buttgereit F, Pongratz G. Energy regulation and neuroendocrine-immune control in chronic inflammatory diseases. J Intern Med. 2010;267: 543–560. 10.1111/j.1365-2796.2010.02218.x - DOI - PubMed
    1. Cheng S-C, Quintin J, Cramer RA, Shepardson KM, Saeed S, Kumar V, et al. mTOR- and HIF-1α–mediated aerobic glycolysis as metabolic basis for trained immunity. Science. 2014;345: 1250684 10.1126/science.1250684 - DOI - PMC - PubMed
    1. Delmastro-Greenwood MM, Piganelli JD. Changing the energy of an immune response. Am J Clin Exp Immunol. 2013;2: 30–54. - PMC - PubMed
    1. Pfeiffer T, Schuster S, Bonhoeffer S. Cooperation and competition in the evolution of ATP-producing pathways. Science. 2001;292: 504–507. - PubMed

Publication types

LinkOut - more resources