Comparative Study
. 2015 May;17(5):580-91.
doi: 10.1038/ncb3161. Epub 2015 Apr 27.

Human definitive haemogenic endothelium and arterial vascular endothelium represent distinct lineages

Affiliations
Comparative Study

Human definitive haemogenic endothelium and arterial vascular endothelium represent distinct lineages

Andrea Ditadi et al. Nat Cell Biol. 2015 May.

Abstract

The generation of haematopoietic stem cells (HSCs) from human pluripotent stem cells (hPSCs) will depend on the accurate recapitulation of embryonic haematopoiesis. In the early embryo, HSCs develop from the haemogenic endothelium (HE) and are specified in a Notch-dependent manner through a process named endothelial-to-haematopoietic transition (EHT). As HE is associated with arteries, it is assumed that it represents a subpopulation of arterial vascular endothelium (VE). Here we demonstrate at a clonal level that hPSC-derived HE and VE represent separate lineages. HE is restricted to the CD34(+)CD73(-)CD184(-) fraction of day 8 embryoid bodies and it undergoes a NOTCH-dependent EHT to generate RUNX1C(+) cells with multilineage potential. Arterial and venous VE progenitors, in contrast, segregate to the CD34(+)CD73(med)CD184(+) and CD34(+)CD73(hi)CD184(-) fractions, respectively. Together, these findings identify HE as distinct from VE and provide a platform for defining the signalling pathways that regulate their specification to functional HSCs.


Figures
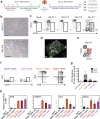
Figure 1
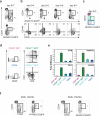
Figure 1. Characterization of hPSC-derived definitive haemogenic endothelium
a, Experimental scheme. CD34+CD43 cells were isolated from embryoid bodies at day 8 of differentiation, reaggregated overnight in serum-free media supplemented with haematopoietic cytokines and then cultured for additional 6 days onto Matrigel-coated plates in the presence of haematopoietic cytokines to promote the endothelial-tohaematopoietic transition (EHT). This stage is referred to as the EHT culture. Following the EHT culture, the cells were assayed as indicated. b, Photomicrograph of day 8 CD34+ CD43 -derived cells following 1 (upper) and 4 days (lower) of EHT culture. Non-adherent (haematopoietic) cells are visible in the day 4 cultures. Scale bars: 100 μm. c, Representative flow cytometric analysis of the frequency of CD34+ and CD45+ cells in the day 8 CD34+-derived populations at the indicated days of EHT culture. d, Visualization of emerging round haematopoietic cells in EHT cultures by confocal imaging. Cells were stained for the endothelial marker CD144 (in green), the haematopoietic marker CD45 (in gray) and the EHT marker cKIT (in red). Scale bar: 5 μm. Dashed line demarcates a cell coexpressing CD144, CD45 and cKIT (white arrow). e, Gating strategy used to define the different CD34/CD45 fractions in the CD34+-derived population following 7 days of EHT culture. f, T cell potential of the different CD34/CD45 fractions indicated in e measured by the development of CD4+CD8+ cells within a CD45+CD56 gate following culture on OP9-DLL4 stromal cells for 24 days. g, Haematopoietic colony-forming potential of the different CD34/CD45 fractions indicated in e generated following 7 days of EHT culture of day 8 CD34+CD43 cells. n = 4, independent experiments. (Mean ± SEM). ** ANOVA p = 0.002. BFU-E: progenitors that generate large segmented erythroid colonies, CFU-E: progenitors that give rise to small erythroid colonies, Myeloid: includes macrophage and mast cell progenitors. h, qRT-PCR analysis of MYB, RUNX1C, TAL1 and GATA2 expression in the different CD34/CD45 fractions isolated as in e. The day 8 CD34+CD43 population prior to culture is included as a control (ctrl). Cells were derived from H1 hESCs. n = 4, independent experiments. (Mean ± SEM). ** ANOVA p < 0.0001. Images in b and plots in c are representative of 6 independent experiments, in f of 3 independent experiments.
Figure 2
Figure 2. RUNX1C-EGFP is expressed during the EHT of the definitive haemogenic endothelium
a, Representative flow cytometric analysis of the frequency of CD45+ cells (upper panel) and CD34+ RUNX1C-EGFP+ cells (lower panel) in the day 8-derived population following 7 days of EHT culture. b, Representative flow cytometric analysis of the frequency of CD144+ and CD45+ cells (lower panels) in the CD34+RUNX1C-EGFP+ fraction (upper panels) generated at the indicated times of EHT culture of day 8 CD34+CD43 cells. c, Gating strategy used for the isolation of the CD34+ and RUNX1C-EGFP+ fractions in the CD34+ -derived population following 5 days of EHT culture. d, T cell potential of the different CD34/CD45 fractions (indicated in c) measured by the development of CD4+CD8+ cells within a CD45+CD56 gate following culture on OP9-DLL4 stromal cells for 24 days. e, qRT-PCR analysis of MYB, RUNX1C, TAL1 and GATA2 expression in the different CD34/RUNX1C-EGFP fractions. n = 3, independent experiments. (Mean ± SEM). ** ANOVA MYB, RUNX1C, GATA2 p < 0.0001, TAL1 p = 0.0003. f, Representative flow cytometric analysis of the frequency of CD34+ CD45+ and CD34+ RUNX1C-EGFP+ cells generated after 7 days in EHT culture from KDR+CD235a (left panels) and KDR+CD235a+ (right panels) -derived CD34+CD43 cells. Plots in a are representative of 5 independent experiments, in b, d and f of 3 independent experiments.
Figure 3
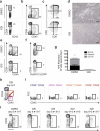
Figure 3. Haematopoietic specification of definitive haemogenic endothelium is Notch-dependent
a, Representative flow cytometric analysis of the frequency of CD34+ CD43 cells in DMSO (upper panel) or GSI (lower panel) treated day 8 EBs generated from H1 ESCs. GSI or DMSO was added to the cultures every 60 hours from day 3 to 8 of differentiation. b, Representative flow cytometric analysis of the frequency of CD34+ and CD45+ cells in populations following 7 days of EHT culture of CD34+CD43 cells isolated from DMSO (upper panel) or GSI (lower panel) treated EBs. c, T cell potential of CD34+CD43 cells isolated from DMSO (upper panel) or GSI (lower panel) treated EBs measured by the development of CD4+ CD8+ cells within a CD45+ CD56 gate following culture on OP9-DLL4 stromal cells for 24 days. d, Photomicrograph of day 8 CD34+CD43 -derived populations following addition of either DMSO or GSI to the EHT culture. Cells were analysed following 7 days of EHT culture in the presence of either DMSO or GSI. Emerging semi-adherent (haematopoietic) cells were detected in the DMSO- (upper panel) but not the GSI- (lower panel) treated population. Scale bars: 100 μm. e, f, Representative flow cytometry analysis of the frequency of CD34+ CD45+ cells (e) or CD34+RUNX1CEGFP+ cells (f) in populations following 7 days of EHT culture of H1- and R1C-GFP-derived CD34+CD43 cells respectively. DMSO or GSI was added throughout the 7-day culture period. g, Haematopoietic colony-forming potential of the H1 hESC-derived day 7 EHT population treated with either DMSO and GSI. n=3 independent experiments. (Mean ± SEM). Student's t-test, ** p < 0.0001. h, Gating strategy used for the isolation of the CD34/CD45 fractions from the population generated following 7 days of EHT culture of day 8 CD34+ CD43 cells in the presence of GSI. i, T cell potential of the different CD34/CD45 fractions following 24 days of culture on OP9-DLL4 stromal cells. The lack of any CD45+ cells indicates that GSI-treatment during the EHT culture inhibited T cell development. l, Representative flow cytometric analysis of the frequency of CD34+ and CD45+ cells in day 8 CD34+CD43 -derived EHT populations treated for the indicated times with GSI. Cells were analysed at day 7 of culture. Images in a, b, e and f are representative of 6 independent experiments, in c and i of 3 independent experiments, in l of 4 independent experiments.
Figure 4
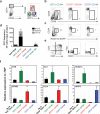
Figure 4. Expression of CD73 and CD184 distinguishes HE and VE in the day 8 CD34+ CD43 population
a, Gating strategy used for the isolation of the CD184+ and CD73+ fractions from the day 8 CD34+ CD43 population. b, Flow cytometric analyses of the frequency of CD34+ and CD45+ cells in populations generated from the 3 H1 hESC-derived CD184/CD73 fractions following 7 days of EHT culture. c, Representative flow cytometric analysis of the frequency of CD34+ and RUNX1C-EGFP+ cells generated from the 3 R1C-GFP hESC-derived CD184/CD73 fractions following 7 days of EHT culture. d, Haematopoietic colony-forming potential of the CD184/CD73-derived populations following 7 days of EHT culture. The CD73CD184 -derived population was also treated with GSI during the EHT culture to evaluate NOTCH-dependency. n = 3, independent experiements. (Mean ± SEM). ** ANOVA p < 0.0001. e, T cell potential of the different H1-derived CD184/CD73 fractions measured by the development of CD4+ CD8+ cells following culture on OP9-DLL4 stromal cells for 24 days. f, qRT-PCR analysis of haematopoietic (MYB, TAL1 and RUNX1C), arterial (EFNB2, DLL4) and venous gene (NR2F2) expression in the different CD184/CD73 fractions isolated from a day 8 CD34+ EB population generated from H1 hESCs. n = 5, independent experiments. (Mean ± SEM). ** ANOVA MYB, TAL1, EFNB2 and NR2F2 p < 0.0001, RUNX1C p = 0.0003, DLL4 p = 0.0002. Plots in b are representative of 6 independent experiments, in c and e of 3 independent experiments.
Figure 5
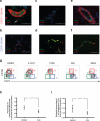
Figure 5. Engrafted CD73medCD184+ and CD73hiCD184 cells maintain their vascular identity
a,c,e, photomicrographs of immunostained histological sections of vascular grafts derived from day 8 CD73medCD184+ cells. b, d, f, photomicrographs of immunostained histological sections of vascular grafts derived from day 8 CD73hiCD184 cells. Green depicts the presence of human CD31+ cells and red the presence of α-smooth muscle actin (α-SMA)+ cells (a, b, e, f) and eprhin receptor B4 (EPHB4)+ cells (c, d). Nuclei are visualized by DAPI (blue) staining. The anti-CD31 antibody is specific for human CD31. Arrow indicates a murine vessel. * indicates autoflourescent red blood cells. Scale bars: 100 μm. g, Representative flow cytometric analysis of the frequency of CD184+ and CD73+ cells in day 8 CD34+CD43 populations generated from Hes2-ICN1-ER™ hESCs treated with DMSO, GSI (L-685,458 10μM), 4-OHT (1μM) , MEKi (PD0325901, 1μM) or PI3Ki (LY294002, 10μM) between day 3 and day 8 of differentiation. h, i, Graphs showing the total percentage of CD34+CD73CD184 (h) and the estimated total percentage of T cell progenitors (i) in day 8 H1-derived total EB populations following DMSO or GSI treatment from day 3 to day 8 of differentiation (Student's t-test; p-value is shown. h, n=6 independent experiments; i, n=3, independent experiments). Images in a-f are representative of 4 mice from 4 independent experiments, in g of 3 independent experiments.
Figure 6
Figure 6. The CD34+CD43CD73CD184 fraction contains both HE and VE progenitors cells
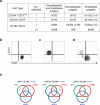
a, Table showing the clonal analysis of the day 8 CD34+CD184CD73 EB population. Numbers indicate the positive wells containing haematopoietic and/or endothelial cells relative to the total number of wells seeded. Data are compiled from 4 independent experiments. b-d, Flow cytometric analysis of haematopoietic (b) and endothelial (c) clones and a representative well seeded with 10 cells, containing both haematopoietic and endothelial progeny (d). Data in a-d are compiled from 4 independent experiments. e, Venn diagram summarizing the number of cells in each of the indicated CD34+ fractions that express the haematopoietic (MYB), arterial (EFNB2) and venous (NR2F2) genes measured by single cells qRT-PCR. The total number of cells from each fraction in which expression of housekeeping gene ACTB was detected is indicated in brackets. Data are compiled from 2 independent experiments.
Figure 7
Figure 7. The CD34+CD43CD73CD184DLL4 HE fraction contains cells with multilineage potential
a, Gating strategy used for the isolation of the DLL4 fractions from the day 8 CD34+CD43CD73CD184 population. b, qRT-PCR analysis of RUNX1C, MYB and GATA2 expression in the day 8 CD34+CD43CD73CD184DLL4 (DLL4) and CD34+CD43CD73CD184DLL4+ (DLL4+) fractions. n = 3, independent experiments. (Mean ± SEM). ** Student's t-test MYB and GATA2 p = 0.0001, RUNX1C p < 0.0001. c, Table showing the clonal analysis of the day 8 CD34+CD73CD184DLL4 EB population. Numbers indicate the positive wells containing haematopoietic and/or endothelial cells relative to the total number of wells seeded. Data are compiled from 5 independent experiments. d, Scheme depicting the strategy used for identifying multipotent progenitors from the day 8 CD34+CD43CD73CD184DLL4 HE. Single CD34+CD43CD73CD184-DLL4 HE cells were FACS directly onto OP9-DLL4 stromal cells in microtiter wells and cultured for 7 days to initiate EHT and expansion of the derivative haematopoietic progeny. At this stage, each well was harvested and half the cells were replated onto OP9-DLL4 stroma to assay for T cell potential, while the remaining half were plated in methylcellulose to assay for myeloid and erythroid progenitors. e, Flow cytometric analyses showing T lymphocytes and photomicrographs showing erythroid and myeloid colonies generated from a single CD34+CD43CD73CD184DLL4 HE progenitor. Scale bars: 100 μm. f, Table showing the multilineage clonal analysis of the day 8 CD34+CD73CD184DLL4 EB population. Numbers indicate the positive wells containing T lymphoid, myeloid and/or erythroid cells out of 252 wells seeded. Data in e and f are compiled from 3 independent experiments. g, Model depicting the lineage relationship of HE and VE in hPSC-derived populations. Following primitive-streak/mesoderm induction, the definitive HE lineage is specified and emerges as a CD34+CD43 CD184CD73DLL4 CD45 population by day 8 of differentiation. Under appropriate conditions, the HE undergoes EHT in a NOTCH-dependent manner, giving rise to CD34+CD144+CD45+RUNX1C+ definitive haematopoietic multipotent progenitors. Alternatively, mesoderm can be specified towards a vascular endothelial fate, generating a progenitor population that can directed to an arterial (CD73medCD184+) or venous fate (CD73hi CD184) by activation or inhibition of Notch signalling respectively. These endothelial cells derived from the vascular endothelial progenitors are devoid of any haematopoietic activity.

References

    1. Kaufman DS. Toward clinical therapies using hematopoietic cells derived from human pluripotent stem cells. Blood. 2009;114:3513–3523. - PMC - PubMed
    1. Kennedy M, et al. T lymphocyte potential marks the emergence of definitive hematopoietic progenitors in human pluripotent stem cell differentiation cultures. Cell reports. 2012;2:1722–1735. - PubMed
    1. Klimchenko O, et al. Monocytic cells derived from human embryonic stem cells and fetal liver share common differentiation pathways and homeostatic functions. Blood. 2011;117:3065–3075. - PubMed
    1. Takayama N, et al. Generation of functional platelets from human embryonic stem cells in vitro via ES-sacs, VEGF-promoted structures that concentrate hematopoietic progenitors. Blood. 2008;111:5298–5306. - PubMed
    1. Clements WK, Traver D. Signalling pathways that control vertebrate haematopoietic stem cell specification. Nature reviews. Immunology. 2013;13:336–348. - PMC - PubMed

Publication types

MeSH terms