. 2015 Jun;47(6):682-8.
doi: 10.1038/ng.3257. Epub 2015 Apr 27.

Improved genome inference in the MHC using a population reference graph

Affiliations

Improved genome inference in the MHC using a population reference graph

Alexander Dilthey et al. Nat Genet. 2015 Jun.

Abstract

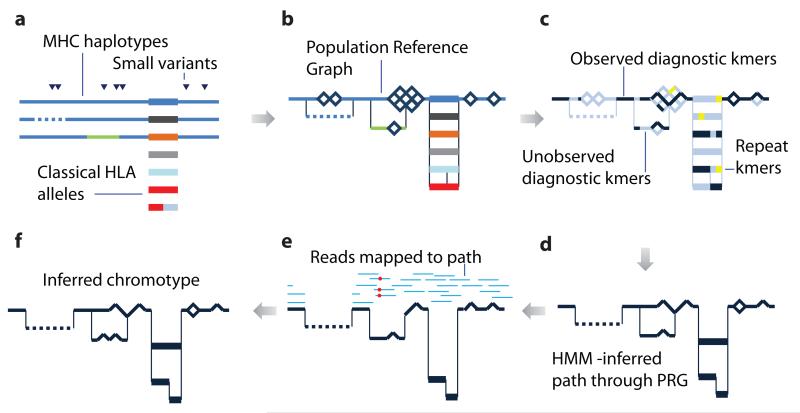
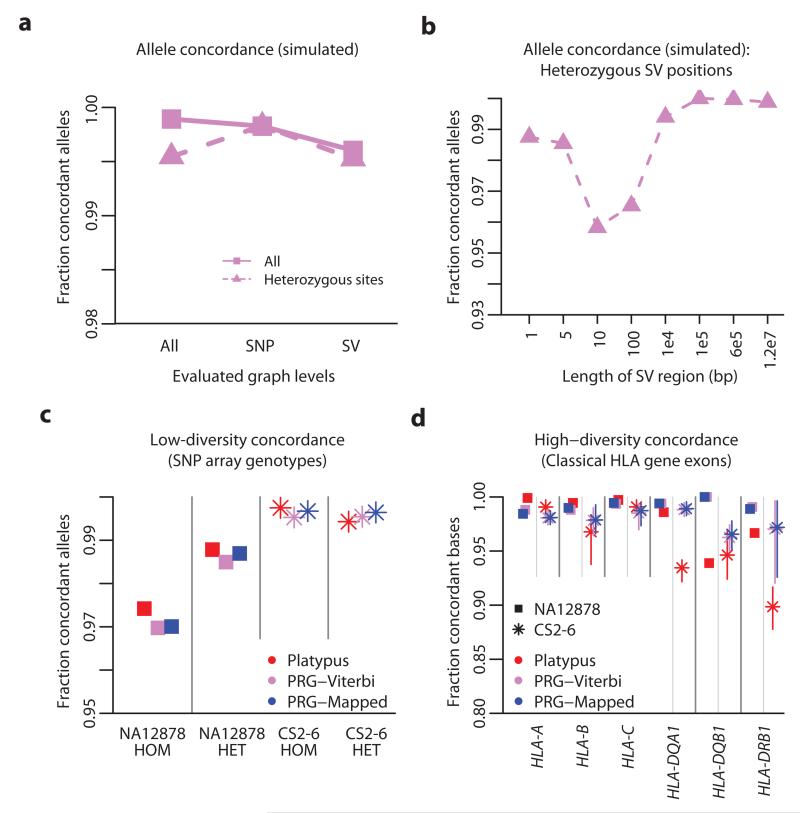
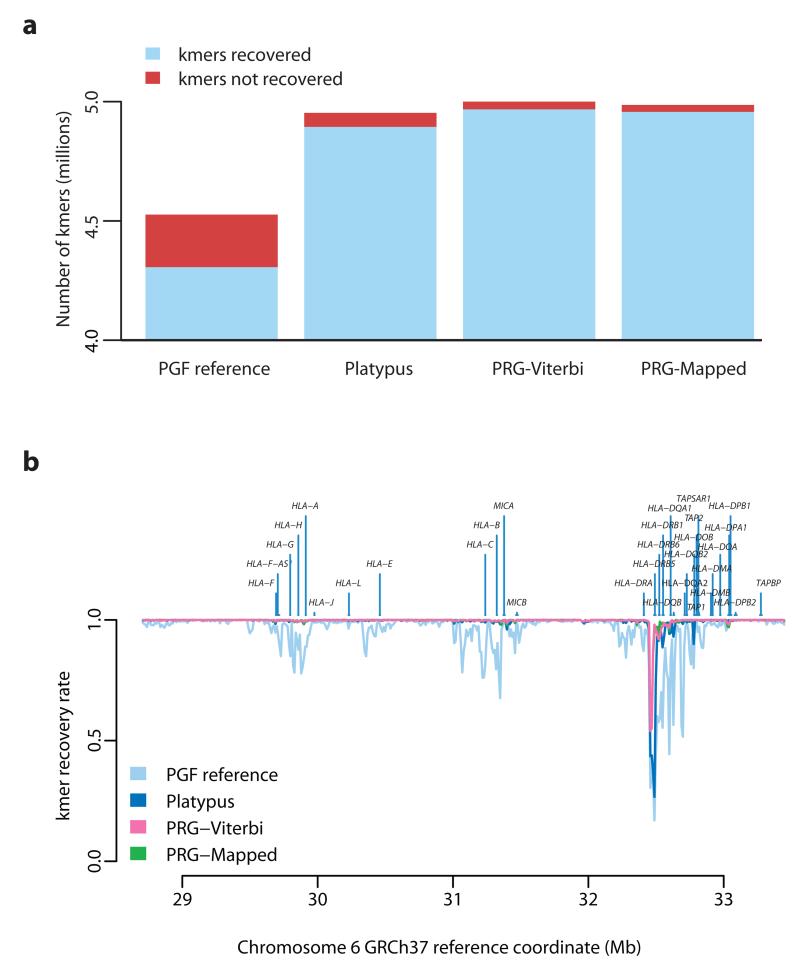
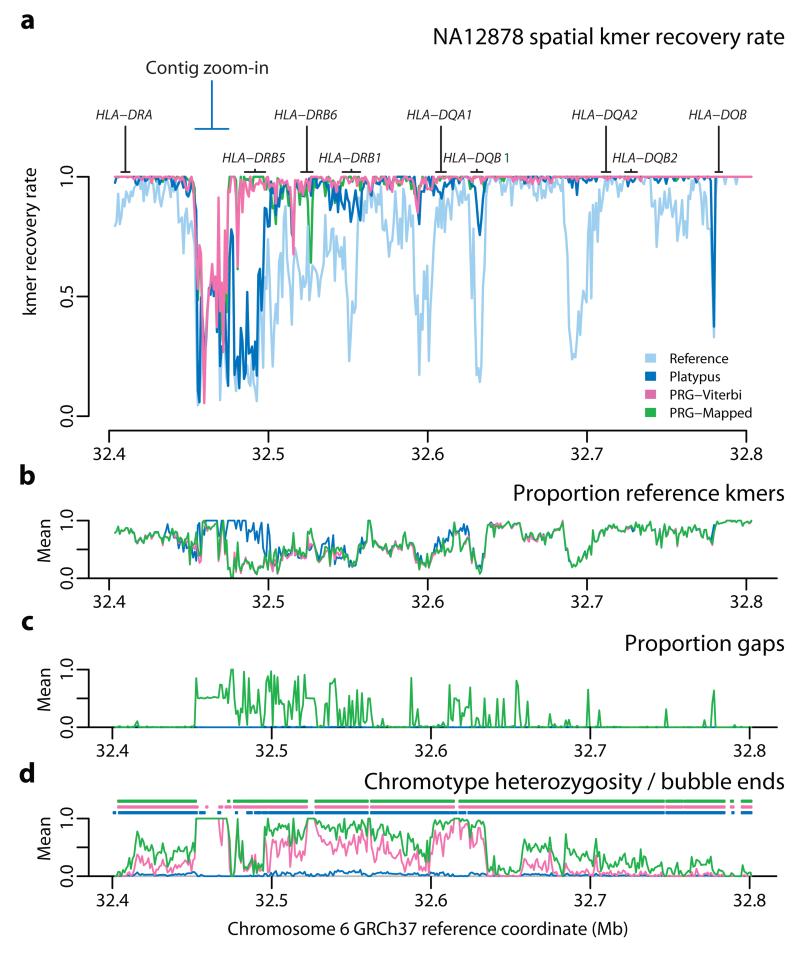
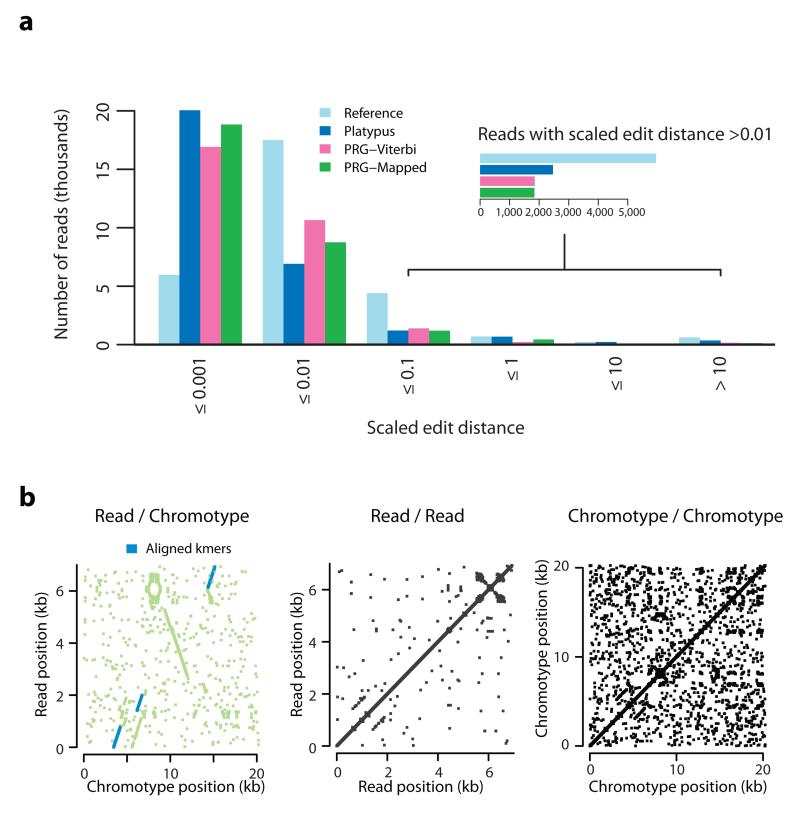
Although much is known about human genetic variation, such information is typically ignored in assembling new genomes. Instead, reads are mapped to a single reference, which can lead to poor characterization of regions of high sequence or structural diversity. We introduce a population reference graph, which combines multiple reference sequences and catalogs of variation. The genomes of new samples are reconstructed as paths through the graph using an efficient hidden Markov model, allowing for recombination between different haplotypes and additional variants. By applying the method to the 4.5-Mb extended MHC region on human chromosome 6, combining 8 assembled haplotypes, the sequences of known classical HLA alleles and 87,640 SNP variants from the 1000 Genomes Project, we demonstrate using simulations, SNP genotyping, and short-read and long-read data how the method improves the accuracy of genome inference and identified regions where the current set of reference sequences is substantially incomplete.


Figures

Figure 1
Figure 1. Read-mapping in the MHC Class II region
a. Summary of read alignment to a single reference (GRCh37 without alternative loci, containing the ‘PGF’ haplotype in the xMHC) for a single sample (CS1) in the MHC Class II region (around HLA-DRB1) showing coverage (grey profile) and the proportion of ‘broken’ read-pairs (red line; defined as mapping to different chromosomes, incompatible strands, or implausible insert size). b The same metrics as for part a, where mapping has been performed to a reference augmented with the MANN (ALT_REF_LOCI_4, Genbank ID GL000253.1) haplotype (i.e. in addition to PGF), chosen because the combined classical HLA genotypes from PGF and MANN match those of the sample. c. Number of mapped intact (blue) and broken (red) read pairs for experiments underlying panels a and b (results from the latter split according to which haplotype reads map to, and a combined metric), demonstrating that the augmented reference results in many more well-mapped and many fewer broken read-pairs.
Figure 2
Figure 2. Schematic illustration showing the construction and application of a population reference graph
a. Multiple sources of information about genetic variation, including alternative reference haplotypes (lines), classical HLA alleles (rectangles) and SNPs / short indels (triangles) are aligned. Colours indicate divergent sequence, dashes indicate gaps. b. A population reference graph (PRG) is constructed from the alignment, resulting in a generative model for variation within the region. SNPs, indicated by diamonds, are added as alternative paths to all valid backgrounds (i.e. excluding sequence with gaps or a third allele at the position). c. The PRG is compared to the de Bruijn graph constructed from reads obtained from a sample. Informative kmers (i.e. those that are found at only one level in the PRG) are identified (dark blue). Those found elsewhere in the genome (yellow) are ignored. d. A hidden Markov model is used to infer the most likely pair of paths through the PRG, allowing for read errors, resulting in an individualized reference chromotype for the sample. e. Two haploid genomes are constructed from the reference chromotype, with arbitrary phasing between adjacent bubbles, and reads (light blue lines) from the sample are aligned and assigned (on the basis of mapping quality) to a reference, thus identifying places where the sample contains novel variation (red circles; only one path through the chromotype is shown). f. Newly-discovered variants modify the reference chromotype, resulting in the inferred chromotype for the sample.
Figure 3
Figure 3. Simulation study and empirical validation
a. Allele concordance between simulated data (20 simulated diploid individuals; 101bp reads at 30x diploid coverage with empirical error distribution) and Viterbi path through the PRG stratified by simulated variant type (SNP or structural variant; SV) and genotype. b. Allele concordance in simulations at sites heterozygous for structural variants of different lengths. c. Allele concordance between SNP array genotypes and chromotypes from each method for NA12878 (squares; Illumina Omni 2.5M array) and the CS2-6 samples (stars; Illumina 1M array), stratified by whether the array specifies the genotype as homozygous or heterozygous. Results are shown for the mapping-based approach (Platypus, red), the Viterbi-path through the PRG (PRG-Viterbi, pink) and after mapping to the reference chromotype (PRG-Mapped, blue). d. Allele concordance between classical HLA genotypes at HLA-A, HLA-B, HLA-C, HLA-DQA1, HLA-DQB1 and HLA-DRB1 (measured at a per-base level) and chromotypes from each method for NA12878 and the CS2-6 samples (range of accuracy across CS2-6 displayed as vertical bars). Classical HLA genotypes were inferred from sequence-based HLA typing (see Methods).
Figure 4
Figure 4. Recovery of chromotype kmers from high throughput sequencing data
a. Number of recovered (blue) and non-recovered (red) kmers present in chromotypes inferred by the four methods (as for Fig. 3c with addition of single reference represented by the PGF MHC haplotype). A kmer is counted as recovered if it appears in HTS data from NA12878 (c. 60x coverage of 100bp paired-end reads represented by an un-cleaned Cortex graph; k = 31). Chromotypes within regions of clustered variants are disentangled using a greedy algorithm prior to evaluation, optimizing for the disentangled haplotypes to contain as many kmers recovered in the sample as possible (see Supplementary Note). b . Spatial pattern of kmer recovery along the extended MHC region for each of the four chromotypes showing the location of classical HLA loci. Recovery fraction averaged over 1 kb windows.
Figure 5
Figure 5. Spatial recovery of kmers within the HLA Class II region
a. Blow-up of kmer recovery in Fig 4b in the MHC Class II region for the chromotypes inferred by the four approaches. b. Fraction of kmers predicted to be present along region that are also presented in the PGF reference haplotype (1 kb windows; PGF reference not shown). c. Fraction of positions in chromotype that correspond to gaps in the multiple sequence alignment used to construct the PRG (1 kb windows). Note that PRGComplete chromotype is effectively identical to the PRG-Viterbi path. d. Fraction of positions in inferred chromotypes that are heterozygous (lines; note this includes sites where one allele is a gap character) and the ending points of chromotype bubbles (points).
Figure 6
Figure 6. Alignment of synthetic long-read data to chromotypes
a. Histogram of scaled edit distance (the number of non-concordant columns in the alignment between read and chromotype, divided by the total number of bases in the read) between long-read data (Illumina NA12878 Moleculo xMHC-specific reads) to chromotypes inferred by four methods. Lower boundary for each interval omitted for clarity. Inset shows a blow-up for reads with scaled edit distance >0.01. b. Dot-plot between the sequence of a Moleculo contig and the sequence of the non-gap branch of the Viterbi chromotype for NA12878 over the region highlighted in Fig. 5a. There is a point (x, y) if and only if the 10-mer beginning at position x in the chromotype segment is identical to the 10-mer (or its reverse complement) beginning at position y in the read. Green indicates the region of the read which, according to the alignment, is matched to the target region (i.e. each green point represents a read kmer between the leftmost and the rightmost read kmers aligned to the target region). Blue indicates that the match between the kmer found at positions x in the chromotype and y in the read can be recovered from the alignment. Middle, right: Analogous dot-plots for the read and the chromotype against themselves, showing that there is no large-scale self-similarity along either sequence.

References

    1. Li H, Durbin R. Fast and accurate long-read alignment with Burrows-Wheeler transform. Bioinformatics. 2010;26:589–595. - PMC - PubMed
    1. Li H, Ruan J, Durbin R. Mapping short DNA sequencing reads and calling variants using mapping quality scores. Genome Res. 2008;18:1851–1858. - PMC - PubMed
    1. Lunter G, Goodson M. Stampy: A statistical algorithm for sensitive and fast mapping of Illumina sequence reads. Genome Res. 2011;21:936–939. - PMC - PubMed
    1. Zook JM, et al. Integrating human sequence data sets provides a resource of benchmark SNP and indel genotype calls. Nat Biotechnol. 2014;32:246–251. - PubMed
    1. Horton R, et al. Variation analysis and gene annotation of eight MHC haplotypes: the MHC Haplotype Project. Immunogenetics. 2008;60:1–18. - PMC - PubMed

Methods only references

    1. Holdsworth R, et al. The HLA dictionary 2008: a summary of HLA-A, -B, -C, -DRB1/3/4/5, and -DQB1 alleles and their association with serologically defined HLA-A, -B, -C, -DR, and -DQ antigens. Tissue Antigens. 2009;73:95–170. - PubMed
    1. Flicek P, et al. Ensembl 2013. Nucleic Acids Res. 2013;41:D48–55. - PMC - PubMed
    1. Spraggs CF, Parham LR, Hunt CM, Dollery CT. Lapatinib-induced liver injury characterized by class II HLA and Gilbert’s syndrome genotypes. Clin Pharmacol Ther. 2012;91:647–652. - PubMed

Publication types

Substances