. 2015 Apr 27;10(4):e0125619.
doi: 10.1371/journal.pone.0125619. eCollection 2015.

Viral bimolecular fluorescence complementation: a novel tool to study intracellular vesicular trafficking pathways

Affiliations

Viral bimolecular fluorescence complementation: a novel tool to study intracellular vesicular trafficking pathways

Brennan S Dirk et al. PLoS One. .

Abstract

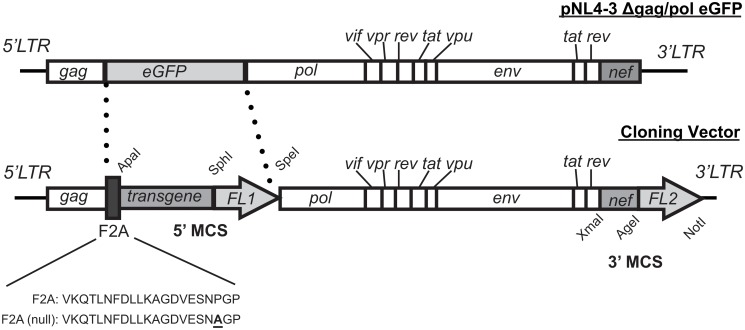
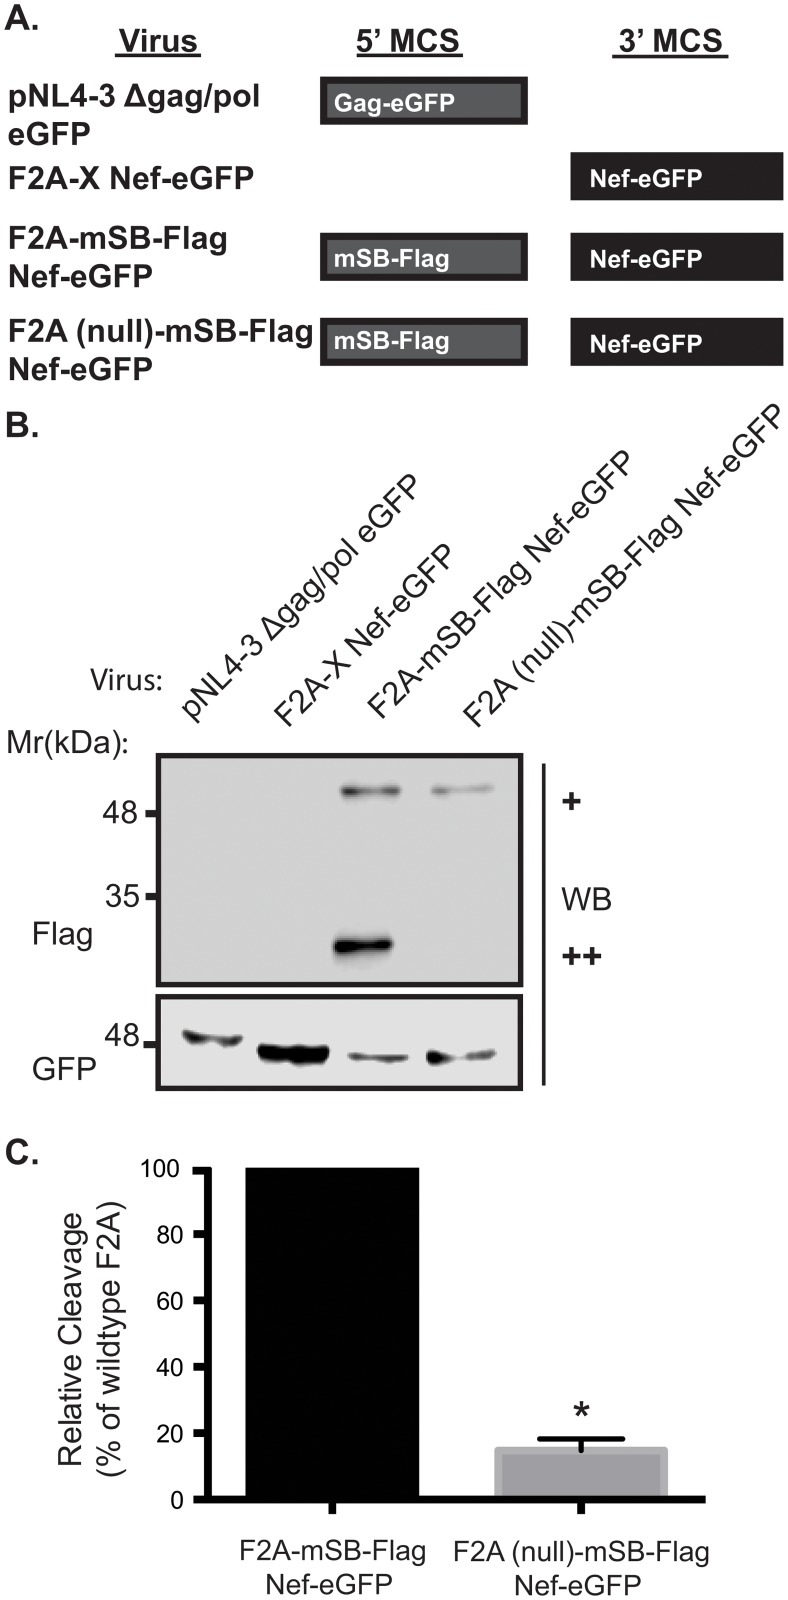
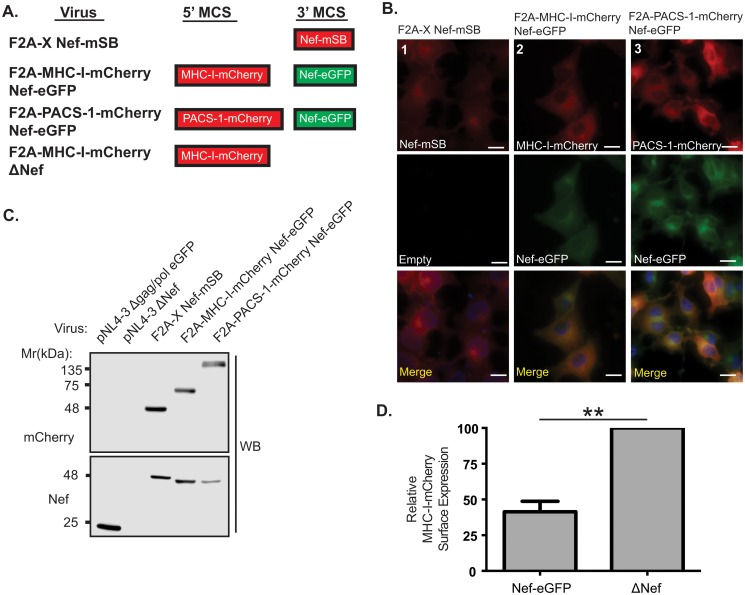
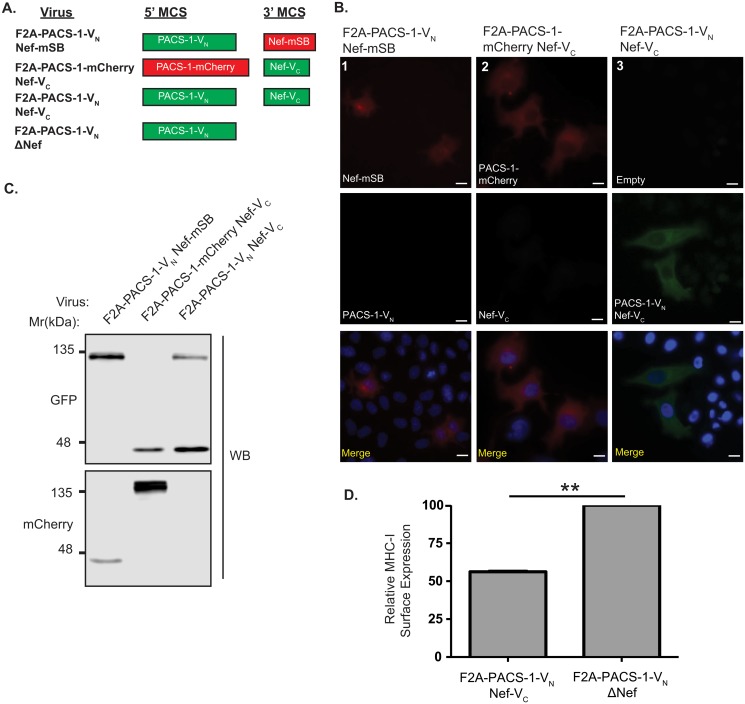
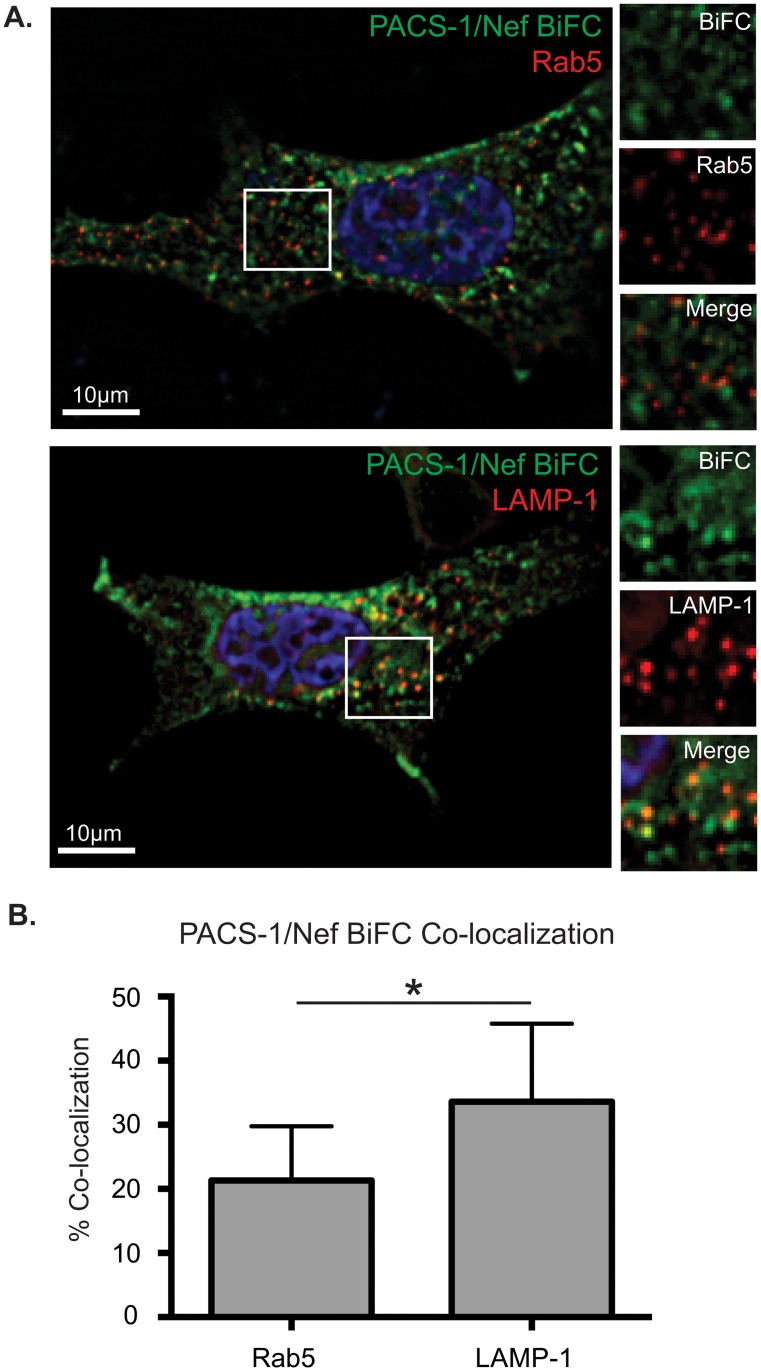
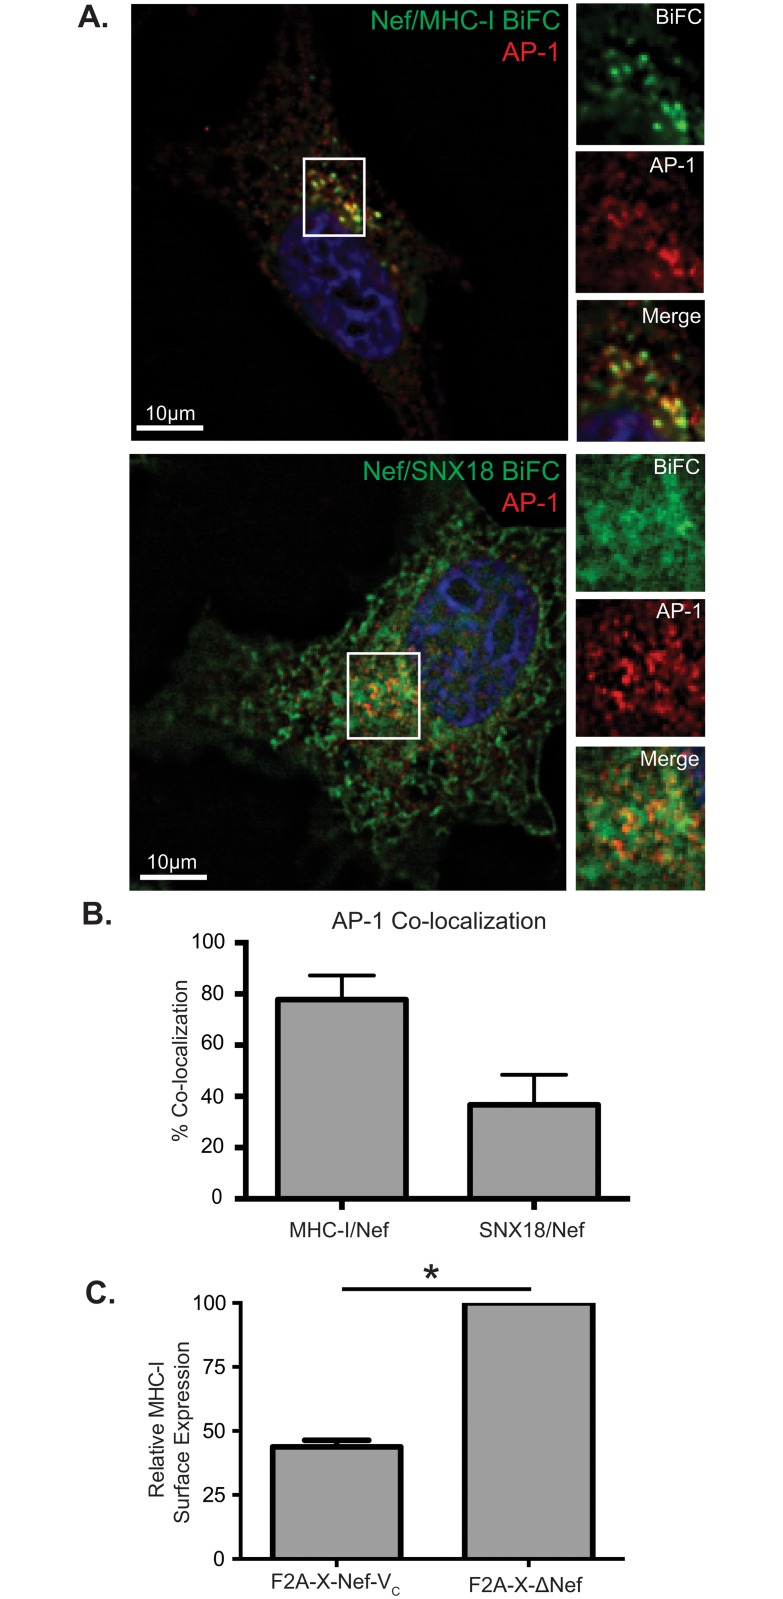
The Human Immunodeficiency Virus type 1 (HIV-1) accessory protein Nef interacts with a multitude of cellular proteins, manipulating the host membrane trafficking machinery to evade immune surveillance. Nef interactions have been analyzed using various in vitro assays, co-immunoprecipitation studies, and more recently mass spectrometry. However, these methods do not evaluate Nef interactions in the context of viral infection nor do they define the sub-cellular location of these interactions. In this report, we describe a novel bimolecular fluorescence complementation (BiFC) lentiviral expression tool, termed viral BiFC, to study Nef interactions with host cellular proteins in the context of viral infection. Using the F2A cleavage site from the foot and mouth disease virus we generated a viral BiFC expression vector capable of concurrent expression of Nef and host cellular proteins; PACS-1, MHC-I and SNX18. Our studies confirmed the interaction between Nef and PACS-1, a host membrane trafficking protein involved in Nef-mediated immune evasion, and demonstrated co-localization of this complex with LAMP-1 positive endolysosomal vesicles. Furthermore, we utilized viral BiFC to localize the Nef/MHC-I interaction to an AP-1 positive endosomal compartment. Finally, viral BiFC was observed between Nef and the membrane trafficking regulator SNX18. This novel demonstration of an association between Nef and SNX18 was localized to AP-1 positive vesicles. In summary, viral BiFC is a unique tool designed to analyze the interaction between Nef and host cellular proteins by mapping the sub-cellular locations of their interactions during viral infection.


Conflict of interest statement

Competing Interests: The authors have declared that no competing interests exist.

Figures

Fig 1
Fig 1. Construction of an HIV-1 derived lentiviral expression system harboring an F2A peptide and two multiple cloning sites.
The pNL4-3 Δgag/pol eGFP vector (top) was engineered to contain the self-cleaving F2A peptide followed by a 5’ MCS (ApaI, SphI and SpeI), to introduce various transgene fusion proteins of interest. A MCS was introduced at the 3’ end in order to insert various Nef fusion proteins (XmaI, AgeI and NotI). (MCS: multiple cloning site; FL1: fluorophore fused to transgene of interest in the 5’ MCS; FL2: fluorophore fused to Nef in the 3’ MCS).
Fig 2
Fig 2. Functional cleavage at the engineered F2A site.
Viruses were engineered with various proteins within the 5’ MCS and/or the 3’ MCS and Jurkat E6.1 T-cells were infected with the resulting pseudoviruses. Flag and GFP specific western blots were performed on lysates collected 48 hours post infection to verify protein expression levels. (A) Schematic representation of proteins produced from lentiviral expression system. (B) A Flag specific western blot was used to quantitate the cleavage efficiency at the F2A site in the F2A-mSB-Flag Nef-eGFP virus, compared to the F2A mutant, F2A (null)-mSB-Flag Nef-eGFP, which lacks cleavage activity (+ uncleaved product, ++ cleaved product). GFP specific western blots confirmed the presence of the Gag-eGFP fusion protein (lane 1) or Nef-eGFP fusion proteins (lanes 2–4). (C) Cleavage efficiency at the F2A site was 6-fold higher compared to the F2A (null) virus (* indicates p-value < 0.05). Details on how the cleavage efficiency was calculated are included in Materials and Methods. Error bars calculated from 3 independent experiments. p-value was determined by paired t-test.
Fig 3
Fig 3. Fluorescence microscopy confirms expression of proteins from the 5’ and 3’ MCS.
Viruses were engineered to produce MHC-I-mCherry or PACS-1-mCherry from the 5’ MCS in combination with Nef-eGFP from the 3’ MCS. (A) Schematic representation of proteins produced from lentiviral expression system. (B) To detect the fluorescent fusion proteins, HeLa cells were infected and visualized 48 hours post infection by widefield fluorescence microscopy. Expression of the Nef-mSB fusion protein was confirmed (column 1), along with concurrent expression of MHC-I or PACS-1-mCherry fusions with Nef-eGFP (columns 2 and 3). Cell nuclei were stained using Hoescht nuclear stain (blue). Scale bars represent 15μm. (C) mCherry and Nef specific western blots were performed to confirm the expression of the fusion proteins. (D) Jurkat E6.1 T-cells were infected with pNL4-3 F2A-MHC-I-mCherry Nef-eGFP (Nef-eGFP) or pNL4-3 F2A-MHC-I-mCherry ΔNef (ΔNef). At 48 hours post infection, cells were surface stained for MHC-I-mCherry (BB7.2 antibody), fixed, permeabilized and stained for intracellular p24 (KC57-RD1 antibody). Columns represent relative MHC-I-mCherry surface expression calculated from the geometric mean fluorescent intensity (gMFI) of surface MHC-I-mCherry on infected cells and normalized to the cell surface MHC-I-mCherry levels of ΔNef-infected cells. Error bars were calculated from four independent repeats. (* indicates p-value < 0.01).
Fig 4
Fig 4. Visualizing the Nef/PACS-1 interaction using viral Bimolecular Fluorescence Complementation.
(A) Schematic representation of proteins produced from lentiviral expression system. (B) HeLa cells were infected with various viruses encoding different fusion proteins and visualized using widefield fluorescence microscopy. BiFC (green, column 3) was visualized in the F2A-PACS-1-VN Nef-VC infected HeLa cells and not the control BiFC viral infections (columns 1 and 2). Cells were mounted in DAPI Fluoromount G media for nuclear staining (blue). Scale bars represent 15μm. (C) Expression of the VN or VC fragment was detected by a GFP specific Western blot, whereas the mCherry and mSB fusions, which acted as controls, were detected by an mCherry specific western blot. Densitometry measurements for PACS-1-VN and Nef-VC were 10,500 and 29,200 arbitrary units, respectively, as determined by Licor C-Digit. (D) Jurkat E6.1 T-cells were infected with F2A-PACS-1-VN Nef-VC and the corresponding non-functional Nef mutant (F2A-PACS-1-VN ΔNef). At 72 hours post infection, cells were surface stained for MHC-I (W6/32 antibody), fixed, permeabilized and stained for intracellular p24 (KC57-RD1 antibody). Columns represent relative MHC-I surface expression calculated from the geometric mean fluorescent intensity (gMFI) of surface MHC-I on infected cells and normalized to cell surface MHC-I levels of ΔNef-infected cells. Error bars were calculated from four independent repeats. (* indicates p-value < 0.01).
Fig 5
Fig 5. Nef/PACS-1 viral BiFC signal is localized to specific Rab5 and LAMP-1 positive endosomes.
(A) HeLa cells were infected with the F2A-PACS-1-VN Nef-VC virus and immunostained for Rab5 or LAMP-1. Cells were fixed, permeablized and stained using Rab5 or LAMP-1 specific primary antibodies. Viral BiFC (green) was observed under the FITC channels and Rab5/LAMP-1 (red) fluorescence was observed under the Far-Red channel. Cells were mounted in DAPI Fluoromount G media for nuclear staining (blue). Scale bars represent 10μm. Panels on the right represent a magnification of the boxed region from the left panel. (B) Twenty-one percent of the viral BiFC signal co-localized with Rab5, whereas 34% co-localized with LAMP-1. Co-localization was determined by the Manders Coefficient. Pearson’s correlation values were determined to be 0.36 and 0.42 for Rab5 and LAMP-1 co-localization, respectively. Error bars were calculated from 3 independent experiments and quantification of at least 25 different cells. (* indicates p value < 0.05).
Fig 6
Fig 6. Viral BiFC signals of MHC-I/Nef and SNX18/Nef are localized to AP-1 positive endosomes.
(A) HeLa cells were infected with either the F2A-MHC-I-VN Nef-VC virus (top) or the F2A-SNX18-VN Nef-VC virus (bottom) and immunostained for AP-1. Cells were fixed, permeabilized and stained using an AP-1 specific primary antibody. Viral BiFC fluorescence (green) was observed under the FITC channels and AP-1 fluorescence (red) was observed under the Far-Red channel. Cells were mounted in DAPI Fluoromount G media for nuclear staining (blue). Scale bars represent 10μm. Panels on the right represent a magnification of the boxed region from the left panel. (B) 78% percent of the Nef/MHC-I BiFC signal co-localized with AP-1, whereas 37% of the Nef/SNX18 BiFC signal co-localized with AP-1. Co-localization was determined by the Manders Coefficient, and mean Pearson’s correlation was determined to be 0.74 and 0.40 for Nef/MHC-I and Nef/SNX18, respectively. Error bars were calculated by 3 independent experiments and quantification of at least 25 different cells. (C) Jurkat E6.1 T-cells were infected with F2A-X Nef-VC virus and the corresponding non-functional Nef mutant (F2A-X ΔNef). At 72 hours post infection, cells were surface stained for MHC-I (W6/32 antibody), fixed, permeabilized and stained for intracellular p24 (KC57-RD1 antibody). Columns represent relative MHC-I surface expression calculated from the geometric mean fluorescent intensity (gMFI) of surface MHC-I on infected cells and normalized to the cell surface MHC-I levels of ΔNef-infected cells. Error bars were calculated from four independent repeats. (** indicates p-value < 0.01).

References

    1. Pfeffer SR. Entry at the trans-face of the Golgi. Cold Spring Harb Perspect Biol. 2011;3(3). Epub 2011/03/23. cshperspect.a005272 [pii] 10.1101/cshperspect.a005272 - DOI - PMC - PubMed
    1. Bonifacino JS, Rojas R. Retrograde transport from endosomes to the trans-Golgi network. Nat Rev Mol Cell Biol. 2006;7(8):568–79. Epub 2006/08/29. nrm1985 [pii] 10.1038/nrm1985 . - DOI - PubMed
    1. Frankel AD, Young JA. HIV-1: fifteen proteins and an RNA. Annu Rev Biochem. 1998;67:1–25. Epub 1998/10/06. 10.1146/annurev.biochem.67.1.1 . - DOI - PubMed
    1. Swanson CM, Malim MH. SnapShot: HIV-1 proteins. Cell. 2008;133(4):742, e1 Epub 2008/05/20. S0092-8674(08)00569-2 [pii] 10.1016/j.cell.2008.05.005 . - DOI - PubMed
    1. Kestler HW 3rd, Ringler DJ, Mori K, Panicali DL, Sehgal PK, Daniel MD, et al. Importance of the nef gene for maintenance of high virus loads and for development of AIDS. Cell. 1991;65(4):651–62. Epub 1991/05/17. 0092-8674(91)90097-I [pii]. . - PubMed

Publication types

MeSH terms

Substances