

Effect of influenza-induced fever on human bioimpedance values
- PMID: 25915945
- PMCID: PMC4410917
- DOI: 10.1371/journal.pone.0125301
Effect of influenza-induced fever on human bioimpedance values
Abstract
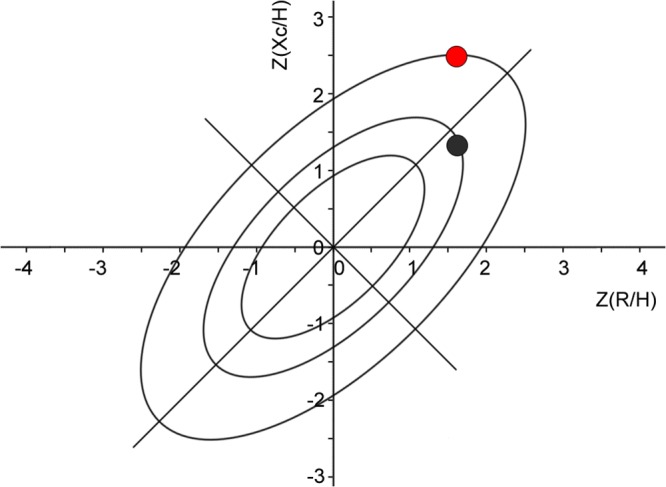
Background and aims: Bioelectrical impedance analysis (BIA) is a widely used technique to assess body composition and nutritional status. While bioelectrical values are affected by diverse variables, there has been little research on validation of BIA in acute illness, especially to understand prognostic significance. Here we report the use of BIA in acute febrile states induced by influenza.
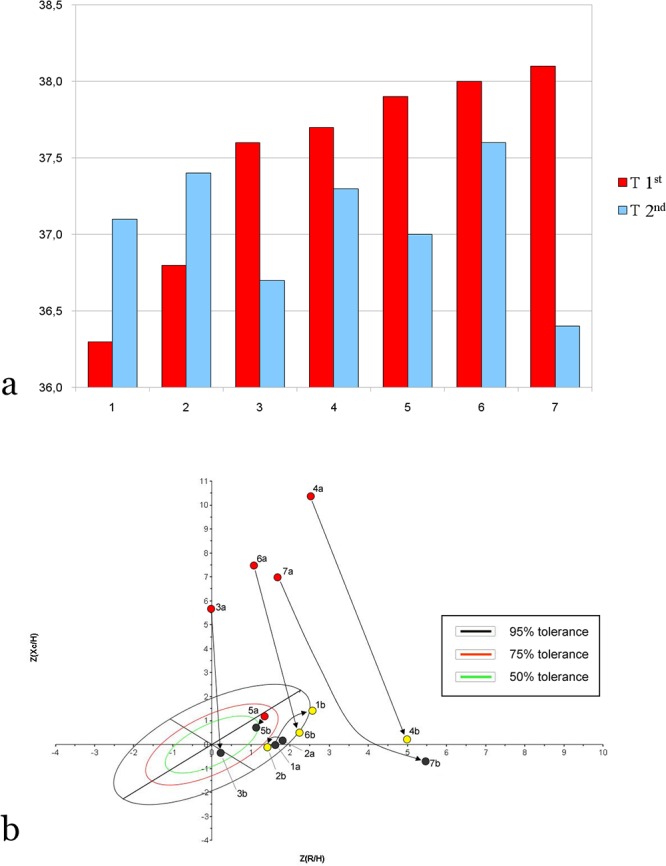
Methods: Bioimpedance studies were conducted during an H1N1 influenza A outbreak in Venezuelan Amerindian villages from the Amazonas. Measurements were performed on 52 subjects between 1 and 40 years of age, and 7 children were re-examined after starting Oseltamivir treatment. Bioelectrical Impedance Vector Analysis (BIVA) and permutation tests were applied.
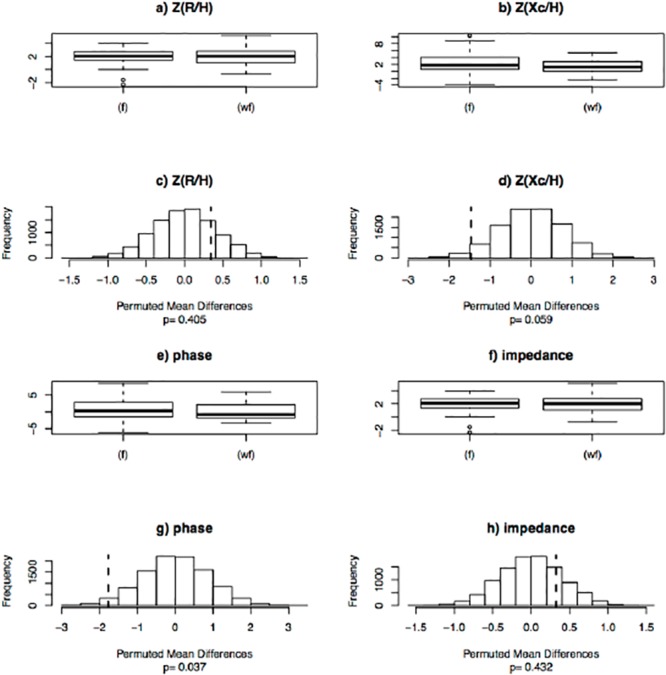
Results: For the entire sample, febrile individuals showed a tendency toward greater reactance (p=0.058) and phase angle (p=0.037) than afebrile individuals, while resistance and impedance were similar in the two groups. Individuals with repeated measurements showed significant differences in bioimpedance values associated with fever, including increased reactance (p<0.001) and phase angle (p=0.007), and decreased resistance (p=0.007) and impedance (p<0.001).
Conclusions: There are bioelectrical variations induced by influenza that can be related to dehydration, with lower extracellular to intracellular water ratio in febrile individuals, or a direct thermal effect. Caution is recommended when interpreting bioimpedance results in febrile states.
Conflict of interest statement
Figures
Similar articles
-
Comparison between virus shedding and fever duration after treating children with pandemic A H1N1/09 and children with A H3N2 with a neuraminidase inhibitor.Antivir Ther. 2015;20(1):49-55. doi: 10.3851/IMP2798. Epub 2014 May 16. Antivir Ther. 2015. PMID: 24832015
-
Bioimpedance vector analysis and conventional bioimpedance to assess body composition in older adults with dementia.Nutrition. 2015 Jan;31(1):155-9. doi: 10.1016/j.nut.2014.06.006. Epub 2014 Jul 5. Nutrition. 2015. PMID: 25466660
-
Comparison of the clinical effectiveness of oseltamivir and zanamivir against influenza virus infection in children.Clin Infect Dis. 2008 Aug 1;47(3):339-45. doi: 10.1086/589748. Clin Infect Dis. 2008. PMID: 18582202
-
Bioelectrical phase angle and impedance vector analysis--clinical relevance and applicability of impedance parameters.Clin Nutr. 2012 Dec;31(6):854-61. doi: 10.1016/j.clnu.2012.05.008. Epub 2012 Jun 12. Clin Nutr. 2012. PMID: 22698802 Review.
-
Body fluid volumes measurements by impedance: A review of bioimpedance spectroscopy (BIS) and bioimpedance analysis (BIA) methods.Med Eng Phys. 2008 Dec;30(10):1257-69. doi: 10.1016/j.medengphy.2008.06.009. Epub 2008 Aug 3. Med Eng Phys. 2008. PMID: 18676172 Review.
Cited by
-
Anthropometric Measurements and Admission Parameters as Predictors of Acute Respiratory Distress Syndrome in Hospitalized COVID-19 Patients.Biomedicines. 2023 Apr 18;11(4):1199. doi: 10.3390/biomedicines11041199. Biomedicines. 2023. PMID: 37189817 Free PMC article.
-
Bioelectric impedance analysis for body composition measurement and other potential clinical applications in critical illness.Curr Opin Crit Care. 2021 Aug 1;27(4):344-353. doi: 10.1097/MCC.0000000000000840. Curr Opin Crit Care. 2021. PMID: 33967207 Free PMC article. Review.
-
Phase angle and standardized phase angle from bioelectrical impedance measurements as a prognostic factor for mortality at 90 days in patients with COVID-19: A longitudinal cohort study.Clin Nutr. 2022 Dec;41(12):3106-3114. doi: 10.1016/j.clnu.2021.02.017. Epub 2021 Feb 17. Clin Nutr. 2022. PMID: 33642143 Free PMC article.
References
-
- National Institutes of Health. Bioelectrical impedance analysis in body composition measurement: National Institutes of Health Technology assessment conference statement—December 12–14, 1994. Am J Clin Nutr. 1996;64: 524S–532S. - PubMed
-
- Kyle UG, Bosaeus I, De Lorenzo AD, Deurenberg P, Elia M, Manuel Gómez J, et al. Bioelectrical impedance analysis—part II: utilization in clinical practice. Clin Nutr. 2004;23: 1430–1453. - PubMed
-
- World Health Organization. Evolution of a pandemic: A(H1N1) 2009, April 2009–March 2010. Geneva: World Health Organization; 2010.
-
- Piccoli A, Rossi B, Pillon L, Bucciante G. A new method for monitoring body-fluid variation by bioimpedance analysis—the RXc graph. Kidney Int. 1994;46: 534–539. - PubMed
-
- Chertow GM, Lowrie EG, Wilmore DW, Gonzalez J, Lew NL, Ling J, et al. Nutritional assessment with bioelectrical-impedance analysis in maintenance hemodialysis-patients. J Am Soc Nephrol. 1995;6: 75–81. - PubMed
Publication types
MeSH terms
Substances
LinkOut - more resources
Full Text Sources
Other Literature Sources
Medical
