. 2016 Sep;29(9):1295-304.
doi: 10.1002/nbm.3306. Epub 2015 Apr 27.

Assessment of blood flow velocity and pulsatility in cerebral perforating arteries with 7-T quantitative flow MRI

Affiliations

Assessment of blood flow velocity and pulsatility in cerebral perforating arteries with 7-T quantitative flow MRI

W H Bouvy et al. NMR Biomed. 2016 Sep.

Abstract

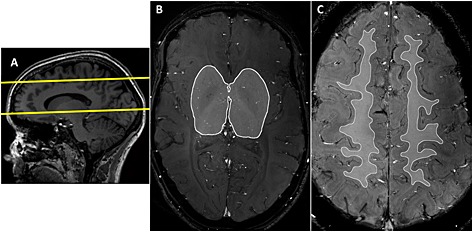
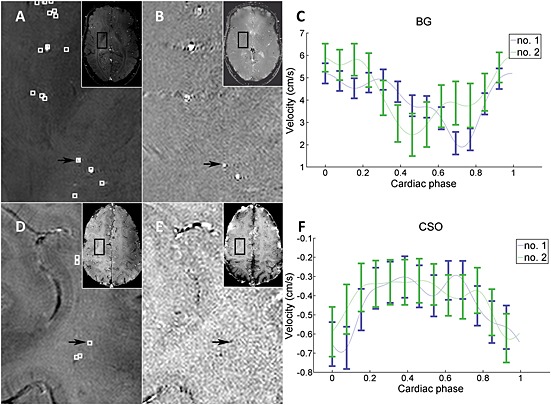
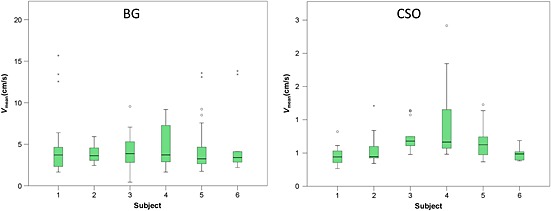
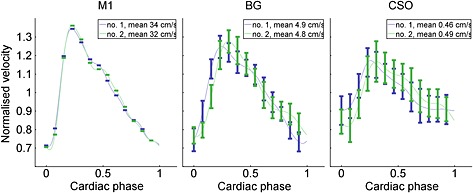
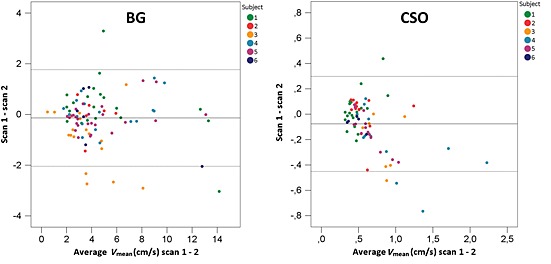
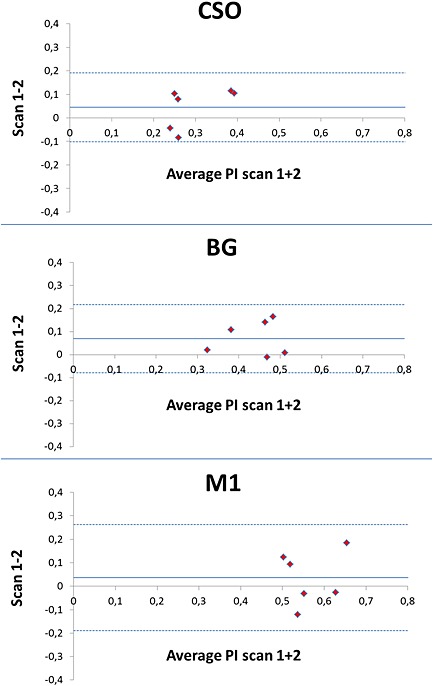
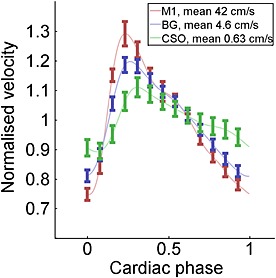
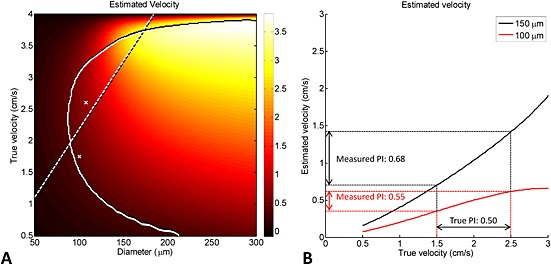
Thus far, blood flow velocity measurements with MRI have only been feasible in large cerebral blood vessels. High-field-strength MRI may now permit velocity measurements in much smaller arteries. The aim of this proof of principle study was to measure the blood flow velocity and pulsatility of cerebral perforating arteries with 7-T MRI. A two-dimensional (2D), single-slice quantitative flow (Qflow) sequence was used to measure blood flow velocities during the cardiac cycle in perforating arteries in the basal ganglia (BG) and semioval centre (CSO), from which a mean normalised pulsatility index (PI) per region was calculated (n = 6 human subjects, aged 23-29 years). The precision of the measurements was determined by repeated imaging and performance of a Bland-Altman analysis, and confounding effects of partial volume and noise on the measurements were simulated. The median number of arteries included was 14 in CSO and 19 in BG. In CSO, the average velocity per volunteer was in the range 0.5-1.0 cm/s and PI was 0.24-0.39. In BG, the average velocity was in the range 3.9-5.1 cm/s and PI was 0.51-0.62. Between repeated scans, the precision of the average, maximum and minimum velocity per vessel decreased with the size of the arteries, and was relatively low in CSO and BG compared with the M1 segment of the middle cerebral artery. The precision of PI per region was comparable with that of M1. The simulations proved that velocities can be measured in vessels with a diameter of more than 80 µm, but are underestimated as a result of partial volume effects, whilst pulsatility is overestimated. Blood flow velocity and pulsatility in cerebral perforating arteries have been measured directly in vivo for the first time, with moderate to good precision. This may be an interesting metric for the study of haemodynamic changes in aging and cerebral small vessel disease. © 2015 The Authors NMR in Biomedicine Published by John Wiley & Sons Ltd.

Keywords: MRI; Qflow; blood; brain; pulsatility; velocity.


Figures

Figure 1
Figure 1
Planning of the two‐dimensional (2D) quantitative flow (Qflow) slices and regions of interest (ROIs). (A) Planning of the basal ganglia (BG) and semioval centre (CSO) slices on a sagittal T 1‐weighted image. The slice planning is indicated by the yellow lines. (B) ROI on the 2D Qflow image in the BG slice. (C) ROI on the 2D Qflow image in the CSO slice. A relatively narrow ROI was used that excluded juxtacortical white matter (WM) to avoid counting vessels from sulci beneath the slice as penetrating arteries.
Figure 2
Figure 2
Vessel selection and raw data example. (A–C) Basal ganglia (BG). (D–F) Semioval centre (CSO). (A, D) Mean magnitude images over all 13 cardiac time points. (B, E) Mean phase images. (C, F) Raw data curves for the measurement of velocity for the individual vessels indicated with the black arrows. All images are of volunteer 1. Local maxima in mean velocity are indicated with white squares on the magnitude images. Note that some local maxima are not located within a corresponding artery on the magnitude images (these were excluded). The black arrows point to the vessels for which the velocity profiles are shown as an example of our raw data in (C) and (F). Note that the blood flow direction of the perforating arteries in CSO is opposite to that of the arteries in BG, which can be observed from the negative values of the CSO velocity curve (F) and the hypointense appearance of arteries in the CSO phase image (E), which is caused by the direction of flow. The error bars show ± standard deviation of the estimated noise [Equation 2] at the location of the measurement. The connecting lines are interpolated. The blue lines indicate measurement 1 and the green lines the repeated measurement after repositioning of the subject.
Figure 3
Figure 3
Boxplots showing the distribution of the average velocity of individual blood vessels for each subject. The number of vessels per subject is displayed in Table 1. Note that little between‐subject variability is seen in the median average velocity in the basal ganglia (BG), despite considerable variability in the range of velocities that were measured within subjects. In the semioval centre (CSO), more variability in the median average velocity was observed compared with BG.
Figure 4
Figure 4
Example of normalised velocity curves of the first and second scans. Data shown from volunteer 1. Error bars show ± standard error of the mean over all vessels in the respective area. Because there was only one measurement for the M1 segment of the middle cerebral artery (M1), no error bars are shown. The connecting lines are interpolated. For visualisation purposes, the samples of all curves were shifted to show the minimum of M1 as the first point in the cardiac cycle. The blue lines indicate the mean normalised velocity curves per region for measurement 1 of all vessels, and the green curves show measurement 2. BG, basal ganglia; CSO, semioval centre.
Figure 5
Figure 5
Bland–Altman plots showing the agreement of V mean per vessel between repeated scans. The broken lines indicate the upper and lower limits of agreement and the full line the mean difference between scans 1 and 2. BG, basal ganglia; CSO, semioval centre.
Figure 6
Figure 6
Bland–Altman plots showing the agreement of the pulsatility index (PI) between repeated scans. The broken lines indicate the upper and lower limits of agreement and the full line the mean difference between scans 1 and 2. BG, basal ganglia; CSO, semioval centre; M1, M1 segment of the middle cerebral artery.
Figure 7
Figure 7
Average normalised velocity profiles over all vessels of all volunteers combined, shown per area. Error bars show ± standard error of the mean. The connecting lines are interpolated. The pulsatility (difference between the maximum and minimum normalised velocity) is highest in M1, and lowest in CSO. BG, basal ganglia; CSO, semioval centre; M1, M1 segment of the middle cerebral artery.
Figure 8
Figure 8
Simulation showing the estimated velocity map as a function of the true velocity. (A) Simulation results showing the estimated velocity as a function of the true blood velocity and vessel diameter for the scan protocol parameters used in the semioval centre (CSO): slice thickness, 2 mm; in‐plane resolution, 300 µm; flip angle, 60°; static tissue signal‐to‐noise ratio (SNR), ≈7. The velocities in the area on the right‐hand side of the curved full line are statistically significant (two standard deviations above zero, estimated from 10 000 noise realisations). The straight broken line and the crosses indicate physiological data regarding the relation between blood velocity and vessel diameter. The broken line originates from blood velocity measurements in feline pial arteries 21 and the two crosses from measurements in human retinal arterioles 22, as explained in Methods. (B) Estimated velocity versus true velocity for two vessels with diameters of 100 and 150 µm, respectively (taken from the data in A). Although the velocities are strongly underestimated, the pulsatility index (PI) is overestimated.

References

    1. Mitchell GF. Physiology of the aging vasculature. Effects of central arterial aging on the structure and function of the peripheral vasculature: implications for end‐organ damage. J. Appl. Physiol. 2008; 105(5): 1652–1660. - PMC - PubMed
    1. Mitchell GF, van Buchem MA, Sigurdsson S, Gotal JD, Jonsdottir MK, Kjartansson Ó. Arterial stiffness, pressure and flow pulsatility and brain structure and function: the Age, Gene/Environment Susceptibility—Reykjavik study. Brain, 2011; 134(11): 3398–3407. - PMC - PubMed
    1. Mills S, Cain J, Purandare N, Jackson A. Biomarkers of cerebrovascular disease in dementia. Br. J. Radiol. 2007; 80 Spec No: S128–S145. - PubMed
    1. Henskens LHG, Kroon AA, van Oostenbrugge RJ, Gronenschild EHBM, Fuss‐Lejeune MMJJ, Hofman PAM, Lodder J, de Leeuw P. Increased aortic pulse wave velocity is associated with silent cerebral small‐vessel disease in hypertensive patients. Hypertension 2008; 52(6): 1120–1126. - PubMed
    1. Duprez DA, De Buyzere ML, Van den Noortgate N, Simoens J, Achten E, Clement DL, Afschrift M, Cohn JN. Relationship between periventricular or deep white matter lesions and arterial elasticity indices in very old people. Age Ageing, 2001; 30(4): 325–330. - PubMed

Publication types

LinkOut - more resources