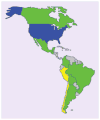
Pharmacogenomic assessment of Mexican and Peruvian populations
- PMID: 25916516
- PMCID: PMC4515450
- DOI: 10.2217/pgs.15.10
Pharmacogenomic assessment of Mexican and Peruvian populations
Abstract
Background: Clinically relevant polymorphisms often demonstrate population-specific allele frequencies. Central and South America remain largely uncategorized in the context of pharmacogenomics.
Materials & methods: We assessed 15 polymorphisms from 12 genes (ABCB1 3435C>T, ABCG2 Q141K, CYP1B1*3, CYP2C19*2, CYP3A4*1B, CYP3A5*3C, ERCC1 N118N, ERCC2 K751Q, GSTP1 I105V, TPMT 238G>C, TPMT 460G>A, TPMT 719A>G, TYMS TSER, UGT1A1*28 and UGT1A1 -3156G>A) in 81 Peruvian and 95 Mexican individuals.
Results: Six polymorphism frequencies differed significantly between the two populations: ABCB1 3435C>T, CYP1B1*3, GSTP1 I105V, TPMT 460G>A, UGT1A1*28 and UGT1A1 -3156G>A. The pattern of observed allele frequencies for all polymorphisms could not be accurately estimated from any single previously studied population.
Conclusion: This highlights the need to expand the scope of geographic data for use in pharmacogenomics studies.
Keywords: Hispanic; Mexico; Peru; genotype; pharmacogenomics; polymorphism; population.
Figures

Similar articles
-
TPMT gene polymorphisms (c.238G>C, c.460G>A and c.719A>G) in a healthy Venezuelan population.Pharmacogenomics. 2023 Mar;24(4):219-225. doi: 10.2217/pgs-2022-0187. Epub 2023 Mar 22. Pharmacogenomics. 2023. PMID: 36946340
-
Inter and intra-ethnic differences in the distribution of the molecular variants of TPMT, UGT1A1 and MDR1 genes in the South Indian population.Mol Biol Rep. 2012 May;39(5):6343-51. doi: 10.1007/s11033-012-1456-8. Epub 2012 Feb 9. Mol Biol Rep. 2012. PMID: 22318545
-
Genetic Analysis of Pharmacogenomic VIP Variants of ABCB1, VDR and TPMT Genes in an Ethnically Isolated Population from the North Caucasus Living in Jordan.Curr Drug Metab. 2020;21(4):307-317. doi: 10.2174/1389200221666200505081139. Curr Drug Metab. 2020. PMID: 32368972
-
An interethnic comparison of polymorphisms of the genes encoding drug-metabolizing enzymes and drug transporters: experience in Singapore.Drug Metab Rev. 2005;37(2):327-78. doi: 10.1081/dmr-28805. Drug Metab Rev. 2005. PMID: 15931768 Review.
-
Effect of CYP3A and ABCB1 single nucleotide polymorphisms on the pharmacokinetics and pharmacodynamics of calcineurin inhibitors: Part I.Clin Pharmacokinet. 2010 Mar;49(3):141-75. doi: 10.2165/11317350-000000000-00000. Clin Pharmacokinet. 2010. PMID: 20170205 Review.
Cited by
-
High frequency of mutant thiopurine S-methyltransferase genotypes in Mexican patients with systemic lupus erythematosus and rheumatoid arthritis.Clin Rheumatol. 2018 Apr;37(4):963-970. doi: 10.1007/s10067-017-3955-4. Epub 2017 Dec 20. Clin Rheumatol. 2018. PMID: 29264794
-
CYP2D6 and CYP2C19 Genes Associated with Tricontinental and Latin American Ancestry of Pe-ruvians.Drug Metab Bioanal Lett. 2022 Dec 13;16(1):14-26. doi: 10.2174/1872312815666221213151140. Online ahead of print. Drug Metab Bioanal Lett. 2022. PMID: 36518034 Free PMC article.
-
Prevalence of pain-related single nucleotide polymorphisms in patients of African origin with sickle cell disease.Pharmacogenomics. 2015 Nov;16(16):1795-806. doi: 10.2217/pgs.15.126. Epub 2015 Nov 10. Pharmacogenomics. 2015. PMID: 26555434 Free PMC article.
-
Variation in Actionable Pharmacogenetic Markers in Natives and Mestizos From Mexico.Front Pharmacol. 2019 Oct 10;10:1169. doi: 10.3389/fphar.2019.01169. eCollection 2019. Front Pharmacol. 2019. PMID: 31649539 Free PMC article.
-
Genetic variability among Mexican Mestizo and Amerindian populations based on three ABCB1 polymorphisms.Mol Biol Rep. 2018 Dec;45(6):2525-2533. doi: 10.1007/s11033-018-4419-x. Epub 2018 Oct 13. Mol Biol Rep. 2018. PMID: 30317428
References
-
- Kidd KK, Pakstis AJ, Yun L. An historical perspective on the world-wide distribution of allele frequencies at the human dopamine D4 receptor locus. Hum Genet. 2014;133(4):431–433. - PubMed
-
- Stathias V, Sotiris GR, Karagiannidis I, et al. Exploring genomic structure differences and similarities between the Greek and European HapMap populations: implications for association studies. Ann Hum Genet. 2012;76(6):472–483. Study cautioning the use of generalizations when inferring genotype data in different populations. - PubMed
-
- Engen RM, Marsh S, Van Booven DJ, McLeod HL. Ethnic differences in pharmacogenetically relevant genes. Curr Drug Targets. 2006;7(12):1641–1648. - PubMed
-
- Cavaco I, Piedade R, Gil JP, Ribeiro V. CYP2C8 polymorphism among the Portuguese. Clin Chem Lab Med. 2006;44(2):168–170. - PubMed
-
- King CR, Yu J, Freimuth RR, McLeod HL, Marsh S. Interethnic variability of ERCC2 polymorphisms. Pharmacogenomics J. 2005;5(1):54–59. - PubMed
Publication types
MeSH terms
Grants and funding
LinkOut - more resources
Full Text Sources
Other Literature Sources
Research Materials
Miscellaneous
