

The transcription factor Cabut coordinates energy metabolism and the circadian clock in response to sugar sensing
- PMID: 25916830
- PMCID: PMC4474529
- DOI: 10.15252/embj.201591385
The transcription factor Cabut coordinates energy metabolism and the circadian clock in response to sugar sensing
Abstract
Nutrient sensing pathways adjust metabolism and physiological functions in response to food intake. For example, sugar feeding promotes lipogenesis by activating glycolytic and lipogenic genes through the Mondo/ChREBP-Mlx transcription factor complex. Concomitantly, other metabolic routes are inhibited, but the mechanisms of transcriptional repression upon sugar sensing have remained elusive. Here, we characterize cabut (cbt), a transcription factor responsible for the repressive branch of the sugar sensing transcriptional network in Drosophila. We demonstrate that cbt is rapidly induced upon sugar feeding through direct regulation by Mondo-Mlx. We found that CBT represses several metabolic targets in response to sugar feeding, including both isoforms of phosphoenolpyruvate carboxykinase (pepck). Deregulation of pepck1 (CG17725) in mlx mutants underlies imbalance of glycerol and glucose metabolism as well as developmental lethality. Furthermore, we demonstrate that cbt provides a regulatory link between nutrient sensing and the circadian clock. Specifically, we show that a subset of genes regulated by the circadian clock are also targets of CBT. Moreover, perturbation of CBT levels leads to deregulation of the circadian transcriptome and circadian behavioral patterns.
Keywords: cabut; circadian; metabolism; nutrient sensing; transcription.
© 2015 The Authors.
Figures
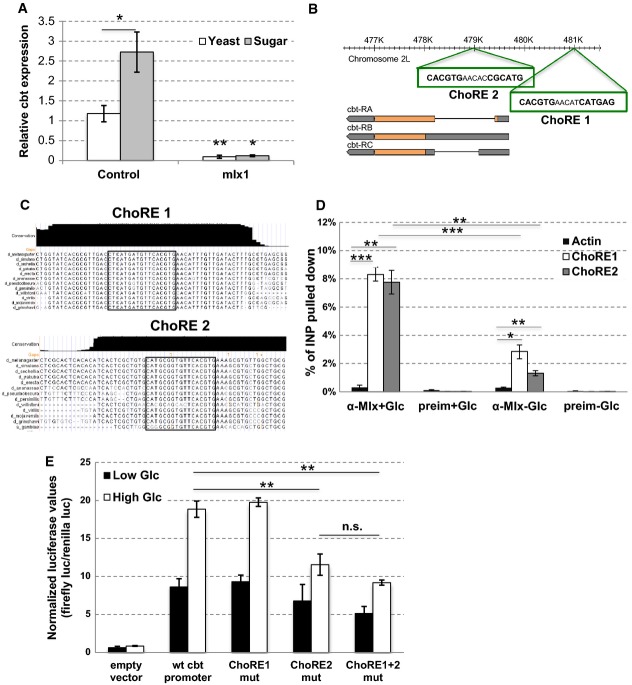
cbt expression is sugar inducible and Mlx dependent. cbt mRNA levels in control (precise excision of P-element line) and mlx1 mutant 2nd instar larvae after 8 h of 10% yeast (Yeast) or 10% yeast and 20% sucrose feeding (Sugar). Actin was used as a reference gene. Error bars indicate SD, n = 3. *P < 0.05; **P < 0.01.
Two putative ChoRE sites in the cbt gene region.
Conservation of the putative ChoRE sites in the cbt gene region in Drosophila species.
ChIP from S2C cells with anti-Mlx antibody or pre-immune serum in the presence or absence of 50 mM glucose (6 h). The percentage of input pulled down was determined by qPCR. Actin was used as a negative control. Error bars indicate SD, n = 3. *P < 0.05, **P < 0.01, ***P < 0.001.
ChoRE2 is required for full cbt promoter activity and sugar responsiveness. Luciferase reporter assay with cbt promoter in HepG2 cells grown in low (5.5 mM) or high (25 mM) glucose. Error bars indicate SD, n = 3. **P < 0.01.
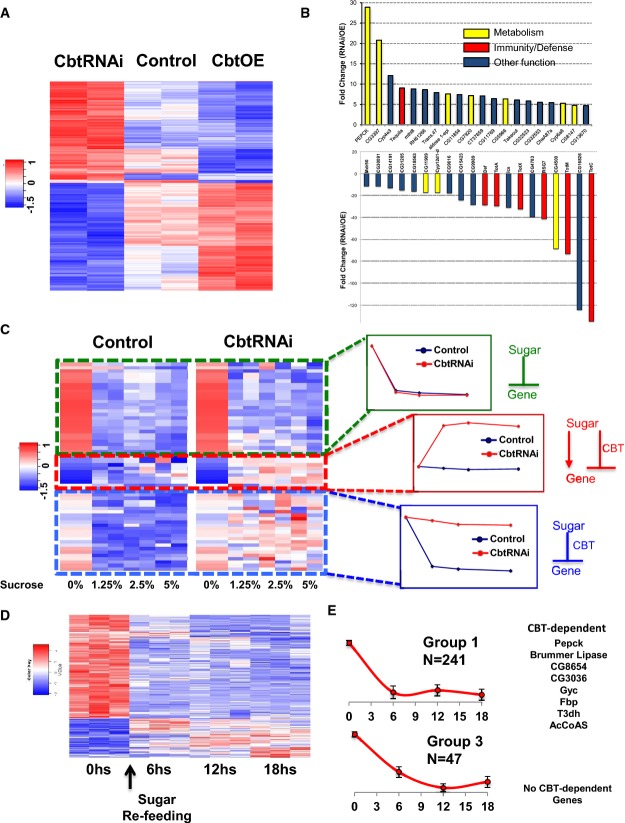
Heatmap representing the microarray data obtained from control, cbtRNAi, and cbtOE flies. From each strain, fly heads at two different time points during the day–night cycle (3 h after light on or light off) were collected. Based on statistical analysis, levels of 1,023 mRNAs were affected in one or more of the strains (FDR < 0.2 and fold change > 1.5).
Histogram showing the fold change of the top 20 genes with expression altered by downregulation (top panel) or upregulation (bottom panel) of CBT. For each gene, the fold change was calculated as the ratio between the values obtained in cbtOE and cbtRNAi flies.
Heatmap representing the 3′ RNA-seq data of control and cbtRNAi adult flies following 24 h of sugar refeeding (left). For clarity, selected transcripts are displayed. mRNAs were classified into three main groups depending on their response to sugar: genes that are downregulated similarly in control and cbtRNAi flies, genes that are not significantly affected in control but upregulated in cbtRNAi flies, and genes that are downregulated in control flies but are not differentially expressed following sugar intake in cbtRNAi flies. The regulation by sugar and CBT is represented on the right.
Heatmap representing 3′ RNA-seq data of genes that change significantly following sugar intake. The transcriptome assay was performed from heads of adult flies that had been starved for 16 h and transferred to vials containing food with 5% sucrose. The arrow indicates the time when the flies were re-fed. The levels of 520 mRNAs were significantly changed at least in one of the time points.
Two transcriptional modules that contain mRNAs that were strongly downregulated following sugar intake. The graphs were obtained by averaging normalized expression of all the genes in these modules. CBT targets are clustered into the module displaying rapid and persistent downregulation by sugar.
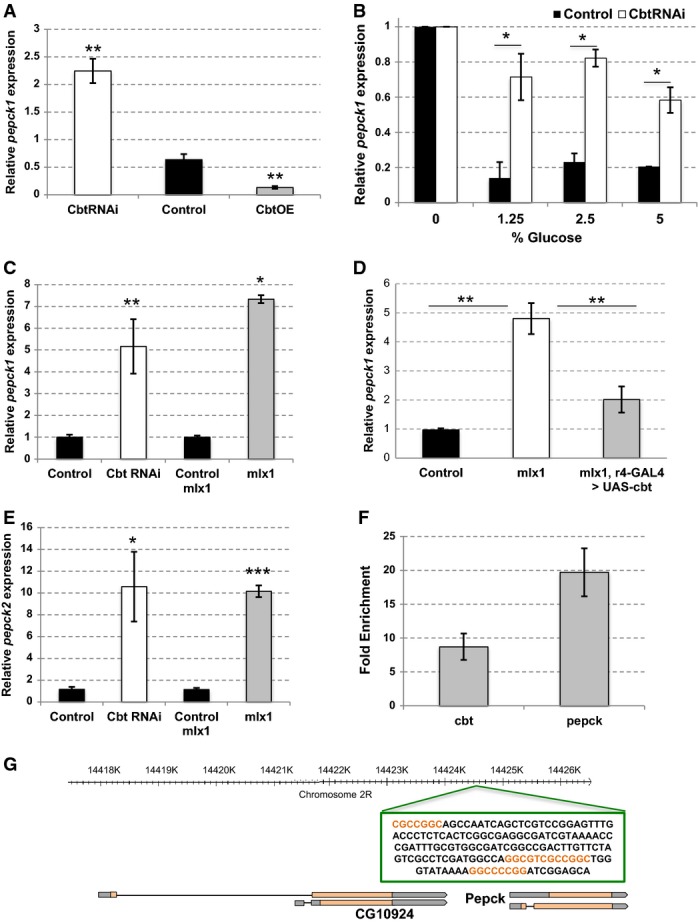
pepck1 mRNA levels in heads of cbtRNAi, control (yw; UAS-cbt), and cbtOE adult flies. pepck1 levels were normalized to rp49. Error bars indicate SD, n = 6. **P < 0.01.
pepck1 mRNA levels in the heads of control (+/cbtE1-UAS-cbt RNAi) or cbtRNAi adult flies that were starved for 16 h and then exposed to food containing different concentrations of sucrose for 18 h. RNA-seq data. Error bars indicate SD, n = 3. *P < 0.05.
pepck1 mRNA levels in 1st instar cbt knock-down and mlx1 mutant larvae. Actin was used as a reference gene. Control (Tub-GAL80ts; Tub-GAL4 > ), cbtRNAi (Tub-GAL80ts; Tub-GAL4 > cbtRNAi NIG 4427R-1), control for mlx1, and mlx1 mutants were grown on 20% yeast. Error bars indicate SD, n = 3. *P < 0.05, **P < 0.01.
pepck1 mRNA levels in 1st instar control (precise excision of P-element line) larvae, mlx1 mutants, and in mlx1 mutants with fat body-specific over-expression of cbt (mlx1, r4-GAL4 > UAS-cbt). Actin was used as a reference gene. Error bars indicate SD, n = 3 (control and mlx1) and n = 7 (mlx1; r4-GAL4 > UAS-cbt). **P < 0.01.
pepck2 mRNA levels in 1st instar cbt knock-down and mlx1 mutant larvae. Actin was used as a reference gene. Control (Tub-GAL80ts; Tub-GAL4 > ), cbtRNAi (Tub-GAL80ts; Tub-GAL4 > cbtRNAi NIG 4427R-1), control and mlx1 mutants were grown on 20% yeast. Error bars indicate SD, n = 3. *P < 0.05, ***P < 0.001.
Fold enrichment of ChIP-PCR in the promoter regions of cbt and pepck1 performed from adult heads. The fold enrichment was obtained by normalization of signals in the immunoprecipitates to those in input fractions. Normalization was performed using primer pairs that amplify non-specific DNA regions. Error bars indicate SD, n = 3.
Schematic representation of the CBT binding sites in between the PEPCK-encoding genes. GC-rich regions are highlighted.
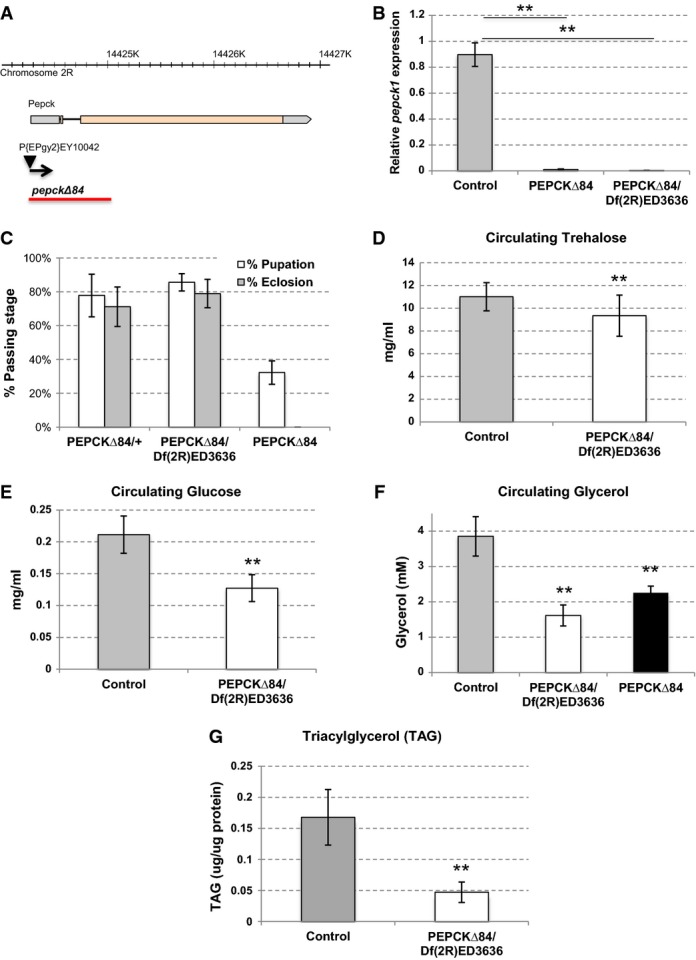
Schematic representation of the pepckΔ84 allele generated by imprecise P-element excision. The resulting deletion spans 825 base pairs and removes the transcription start site, start codon, and sequence encoding 108 amino acids of the N-terminal region of the protein.
qPCR analysis of pepck1 expression levels in control (precise excision of P-element line crossed with yw), pepckΔ84, and pepckΔ84/Df(2R)ED3636 larvae. Results indicate that pepckΔ84 allele is likely null or a strong hypomorph. Error bars indicate SD, n = 3. **P < 0.01.
PEPCK1 is dispensable for viability, but pepckΔ84 homozygotes display lethality likely due to genetic background. Pupation and adult emergence of pepckΔ84/+, pepckΔ84, and pepckΔ84/Df(2R)ED3636 animals.
Loss of PEPCK1 leads to modest downregulation of circulating trehalose. Hemolymph was harvested from 3rd instar larvae grown on 20% yeast. Error bars indicate SD, n = 10. **P < 0.01.
Loss of PEPCK1 causes reduction of circulating glucose levels. Hemolymph was harvested from 3rd instar larvae grown on 20% yeast. Error bars indicate SD. **P < 0.01.
Loss of PEPCK1 strongly reduces circulating glycerol levels. Hemolymph was harvested from 3rd instar larvae grown on 20% yeast. Error bars indicate SD. **P < 0.01.
Triglyceride levels are reduced in the pepck1 mutant male adult flies. Flies were aged for 5 days after eclosion on regular fly food. Errors bars indicate SD. **P < 0.01.
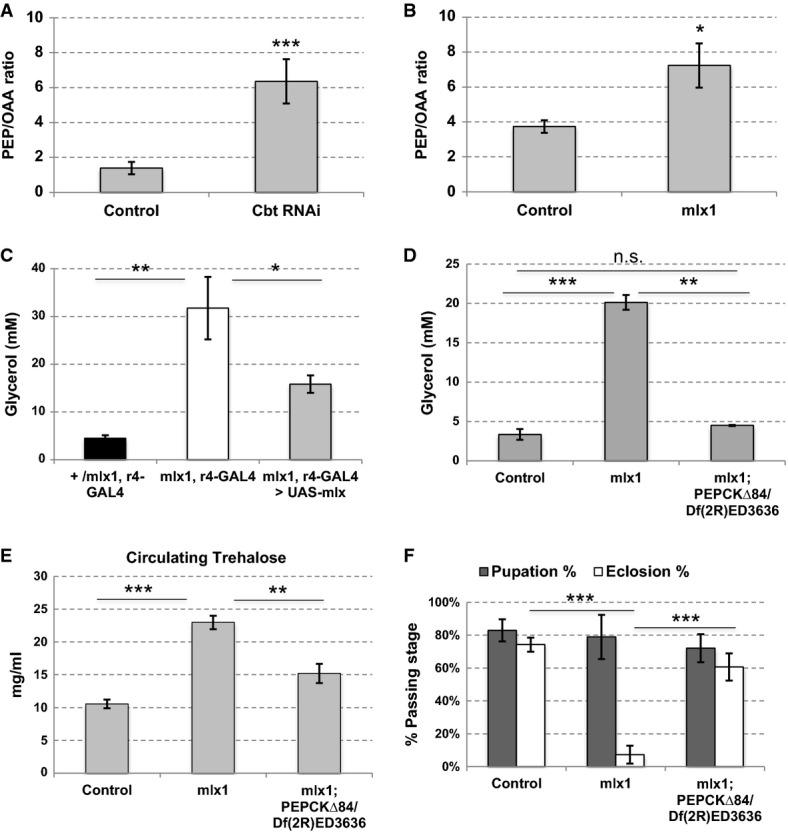
A, B cbtRNAi and mlx1 mutant larvae display higher phosphoenolpyruvate (PEP) to oxaloacetate (OAA) ratio. Control (Tub-GAL80ts; Tub-GAL4 > ), cbtRNAi (Tub-GAL80ts; Tub-GAL4 > cbtRNAi NIG 4427R-1), control and mlx1 mutants were grown on 20% yeast until 3rd instar. Error bars indicate SD, n = 3 (A) or 4 (B). *P < 0.05, ***P < 0.001.
C mlx1 mutants display highly elevated circulating glycerol levels that can partially be rescued by introduction of mlx expression in the fat body using r4-GAL4. +/mlx1, r4-GAL4; mlx1, r4-GAL4; and mlx1, r4-GAL4 > UAS-mlx larvae were grown on 20% yeast. Hemolymph was harvested from 3rd instar larvae, and circulating levels of free glycerol were assayed. Error bars indicate SD, n = 4. *P < 0.05, **P < 0.01.
D The elevated circulating glycerol phenotype of mlx1 mutants is rescued by loss of pepck1. Control, mlx1, and mlx1; pepckΔ84/Df(2R)ED3636 animals were grown on 20% yeast until 3rd larval instar; hemolymph was collected, and free glycerol was measured. Error bars indicate SD, n = 3. **P < 0.01, ***P < 0.001.
E The elevated circulating trehalose of mlx1 mutants is partially rescued by loss of pepck1. Control, mlx1, and mlx1; pepckΔ84/Df(2R)ED3636 animals were grown on 20% yeast until 3rd larval instar; hemolymph was collected and subjected to trehalose measurement. Error bars indicate SD, n = 4 (control and mlx1) or 3 (mlx1; pepckΔ84/Df(2R)ED3636). **P < 0.01, ***P < 0.001.
F mlx1 mutant pupal lethality is rescued by loss of pepck1. Pupation and adult emergence of control, mlx1, and mlx1; pepckΔ84/Df(2R)ED3636 animals grown on standard lab food. Error bars indicate SD, n = 4. ***P < 0.001.
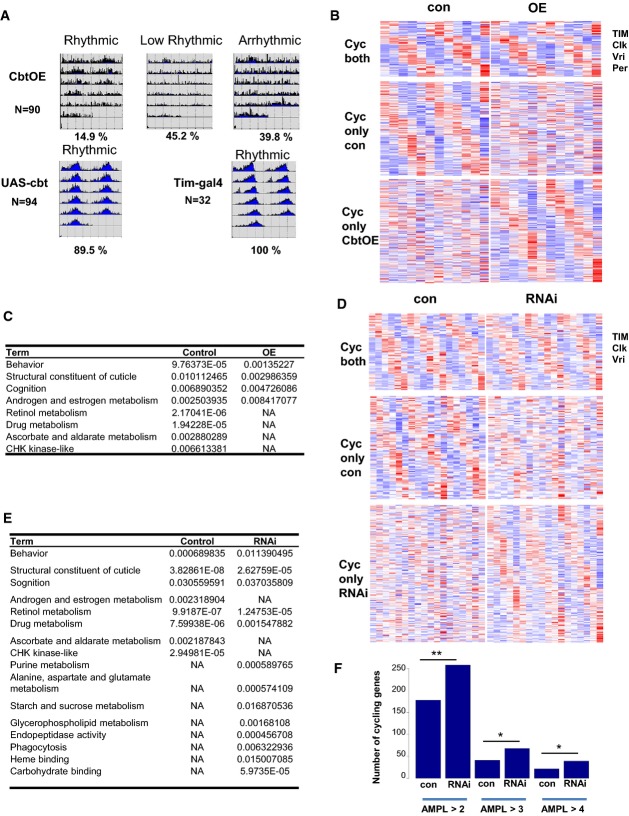
Circadian locomotor behavior of tim-cbtOE flies. Tim-cbtOE and their respective control adult flies were placed first for 3–4 days in 12:12 LD condition and then transferred into DD (constant darkness). Average actograms show their circadian activity during DD conditions. Rhythmic (RI ≥ 0.2) or arrhythmic activity pattern of these flies were grouped, and their average profiles were plotted. The percentage indicates the percentage of flies in each group (N = number of flies).
Heatmap representation of genes cycling in both control and tim-cbtOE adult flies (upper panel), only in the control (middle), and only in RNAi flies (lower panel).
Gene ontology (GO) enrichment analyses for cycling genes in either cbtOE or control adult flies. P-value < 0.05 after Bonferroni correction was used to determine statistical significance. NA indicates that the term did not reach statistical significance in this sample.
Heatmap representation of genes cycling in both control and cbtRNAi adult flies (upper panel), only in the control (middle) and only in RNAi flies (lower panel).
Gene ontology (GO) enrichment analyses results of cycling genes in cbtRNAi adult flies or in control. P-value < 0.05 after Bonferroni correction was used to determine statistical significance. NA indicates that the term did not reach statistical significance in this sample.
More genes cycle in the RNAi adult flies compared to control. Selection of genes by different cutoff of the cycling amplitude (AMPL) shows similar patterns. Chi-square test demonstrated statistical significance of the differences (**P < 0.001, *P < 0.05).
References
-
- Ballard FJ, Hanson RW, Leveille GA. Phosphoenolpyruvate carboxykinase and the synthesis of glyceride-glycerol from pyruvate in adipose tissue. J Biol Chem. 1967;242:2746–2750. - PubMed
-
- Bass J. Circadian topology of metabolism. Nature. 2012;491:348–356. - PubMed
-
- Becker A, Schlöder P, Steele JE, Wegener G. The regulation of trehalose metabolism in insects. Experientia. 1996;52:433–439. - PubMed
Publication types
MeSH terms
Substances
Associated data
- Actions
- Actions
- Actions
Grants and funding
LinkOut - more resources
Full Text Sources
Other Literature Sources
Molecular Biology Databases
Research Materials
