. 2015 May 26;43(10):5249-62.
doi: 10.1093/nar/gkv391. Epub 2015 Apr 27.

New insights into the regulatory mechanisms of ppGpp and DksA on Escherichia coli RNA polymerase-promoter complex

Affiliations

New insights into the regulatory mechanisms of ppGpp and DksA on Escherichia coli RNA polymerase-promoter complex

Nicola Doniselli et al. Nucleic Acids Res. .

Abstract

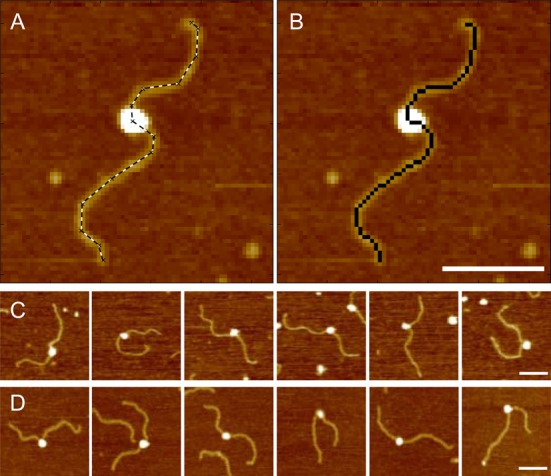
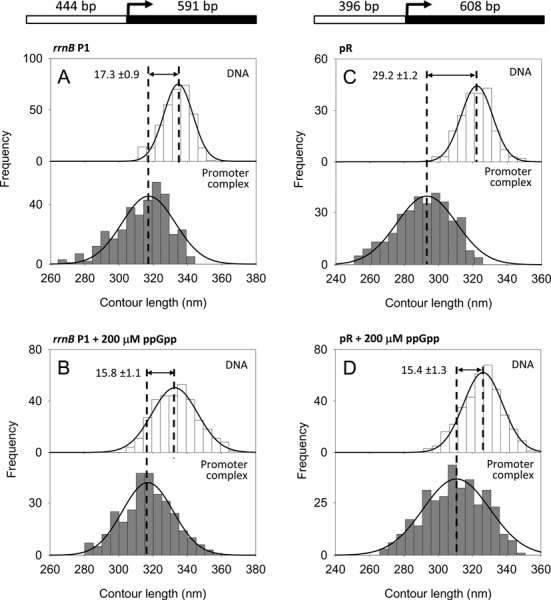
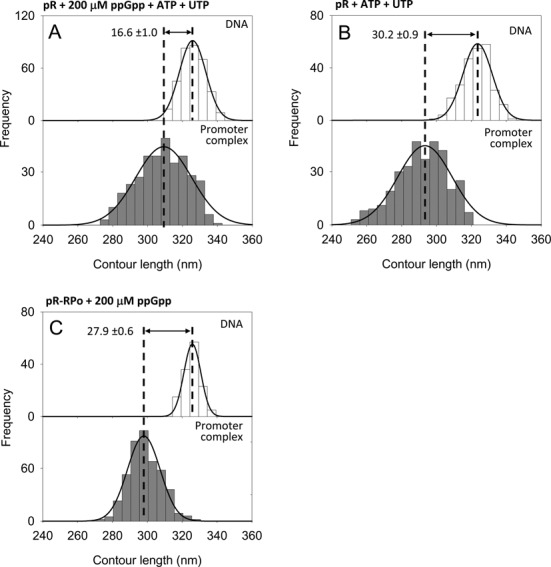
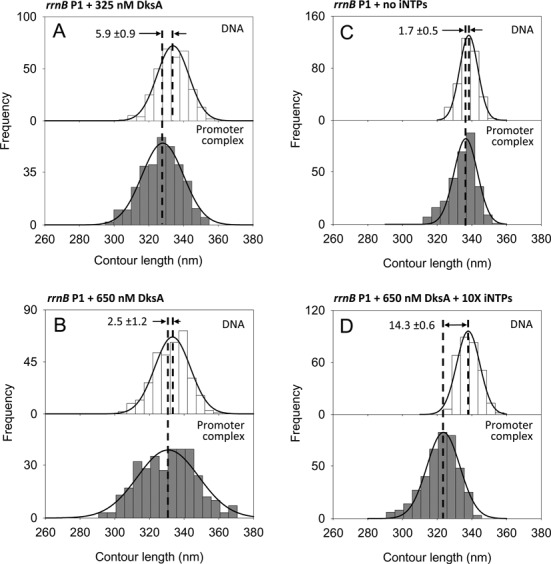
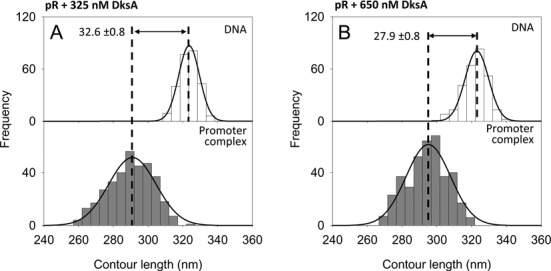
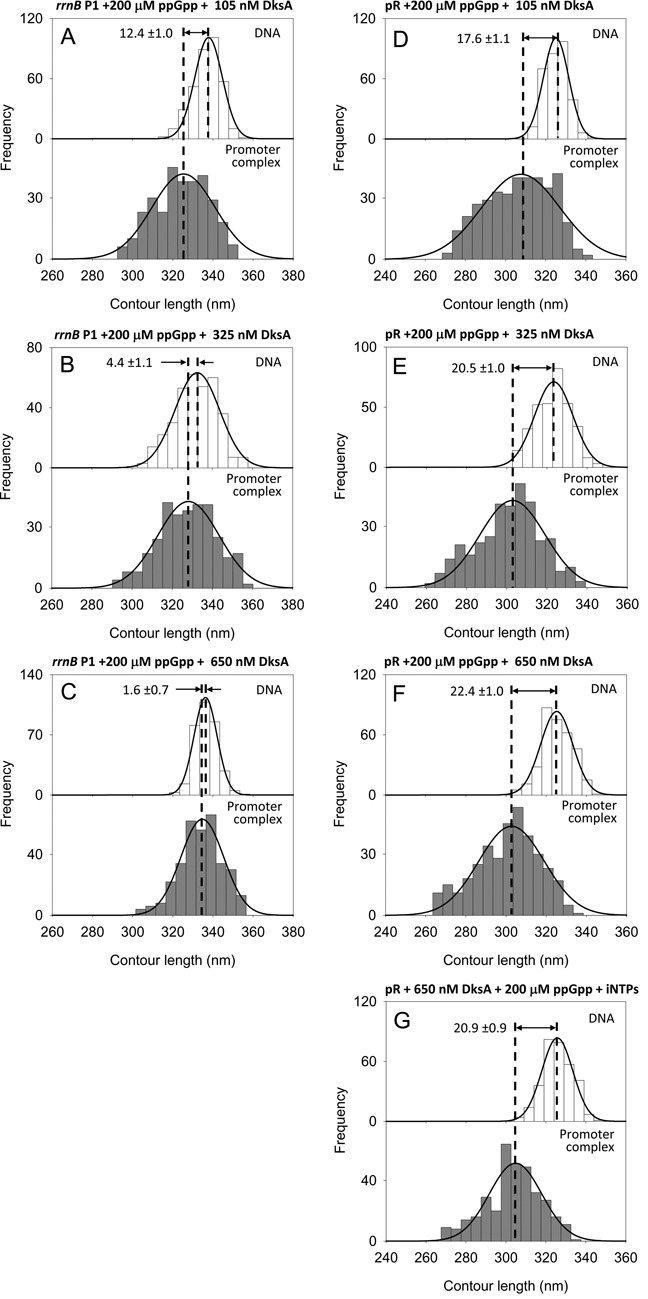
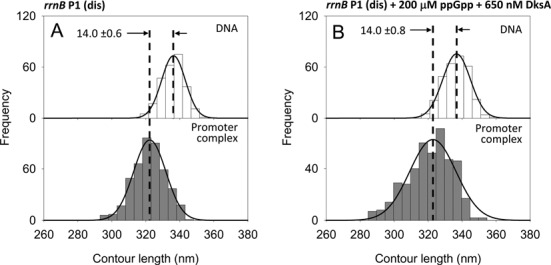
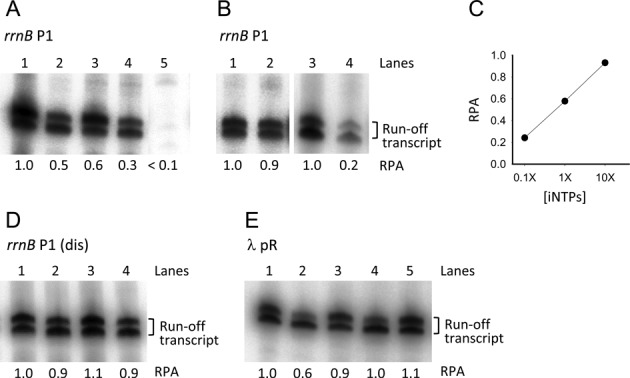
The stringent response modulators, guanosine tetraphosphate (ppGpp) and protein DksA, bind RNA polymerase (RNAP) and regulate gene expression to adapt bacteria to different environmental conditions. Here, we use Atomic Force Microscopy and in vitro transcription assays to study the effects of these modulators on the conformation and stability of the open promoter complex (RPo) formed at the rrnA P1, rrnB P1, its discriminator (dis) variant and λ pR promoters. In the absence of modulators, RPo formed at these promoters show different extents of DNA wrapping which correlate with the position of UP elements. Addition of the modulators affects both DNA wrapping and RPo stability in a promoter-dependent manner. Overall, the results obtained under different conditions of ppGpp, DksA and initiating nucleotides (iNTPs) indicate that ppGpp allosterically prevents the conformational changes associated with an extended DNA wrapping that leads to RPo stabilization, while DksA interferes directly with nucleotide positioning into the RNAP active site. At the iNTPs-sensitive rRNA promoters ppGpp and DksA display an independent inhibitory effect, while at the iNTPs-insensitive pR promoter DksA reduces the effect of ppGpp in accordance with their antagonistic role.


Figures

Figure 1.
Figure 1.
(A) A promoter complex with a manually traced outline (dashed line). (B) The same complex as in C with the sequence of pixels used for DNA contour length measurements highlighted in black. (C) Gallery of promoter complexes formed in the absence of modulators. (D) Gallery of promoter complexes formed with 200 μM ppGpp and 650 nM DksA. The broadening effect of the AFM tip does not allow to detect the presence of the modulators bound to the RNAP. Scale bars 100 nm.
Figure 2.
Figure 2.
DNA contour length distributions of bare DNA (top panel) and RPo complexes (bottom panel). (A) rrnB P1 promoter without ppGpp. (B) rrnB P1 promoter with 200 μM ppGpp. (C) λ pR promoter without ppGpp. (D) λ pR promoter with 200 μM ppGpp. The DNA compaction is shown as the difference between the mean values of the fitted Gaussian functions ± SEM. A schematic representation of the DNA templates used is drawn at the top.
Figure 3.
Figure 3.
DNA contour length distributions of bare DNA (top panel) and RPo complexes (bottom panel) at the λ pR promoter. (A) With 200 μM ppGpp and 1 mM ATP, 0.1 mM UTP. (B) With 1 mM ATP, 0.1 mM UTP. (C) With 200 μM ppGpp added after RPo formation.
Figure 4.
Figure 4.
DNA contour length distributions of bare DNA (top panels) and promoter-bound complexes (bottom panels) assembled onto a 1035 bp long DNA fragment harboring the rrnB P1 promoter under different conditions. (A) 325 nM DksA; (B) 650 nM DksA; (C) without iNTPs; (D) 650 nM DksA, 10 mM ATP and 1 mM CTP.
Figure 5.
Figure 5.
DNA contour length distributions of bare DNA (top panels) and specific complexes (bottom panels) assembled onto a 1004 bp long DNA fragment harboring the pR promoter. (A) With 325 nM DksA. (B) With 650 nM DksA.
Figure 6.
Figure 6.
(A–C) DNA contour length distributions of bare DNA (top panels) and promoter-bound complexes (bottom panels) assembled onto a 1035 bp long DNA fragment harboring the rrnB P1 promoter in the presence of 200 μM ppGpp and increasing concentration of DksA. (D–F) DNA contour length distributions of bare DNA (top panels) and RPo (bottom panels) assembled onto a 1004 bp long DNA fragment harboring the λ pR promoter in the presence of 200 μM ppGpp and increasing concentration of DksA. (A,D) 105 nM DksA; (B,E) 325 nM DksA; (C,F) 650 nM DksA. (G) DNA contour length distributions of bare DNA (top panels) and RPo (bottom panels) assembled at pR with 200 μM ppGpp, 650 nM DksA, 1 mM ATP and 0.1 mM UTP.
Figure 7.
Figure 7.
DNA contour length distributions of bare DNA (top panels) and promoter-bound complexes (bottom panels) assembled onto a 1035 bp long DNA fragment harboring the rrnB P1 (dis) promoter mutant. (A) In the absence of modulators. (B) In the presence of 200 μM ppGpp and 650 nM DksA.
Figure 8.
Figure 8.
In vitro single-round transcription assays. (A) rrnB P1 promoter activity with 1X iNTPs (1 mM ATP, 0.1 mM CTP) and with no modulators (lane 1); with 200 μM ppGpp (lane 2); with 650 nM DksA (lane 3); with 200 μM ppGpp and 650 nM DksA (lane 4); without iNTPs (lane 5). (B) rrnB P1 promoter activity with 10X iNTPs (10 mM ATP, 1 mM CTP) and no modulators (lane 1); with 10X iNTPs and 650 nM DksA (lane 2); with 0.1X iNTPs (0.1 mM ATP, 0.01 mM CTP) and no modulators (lane 3); with 0.1X iNTPs and 650 nM DksA (lane 4). (C) Plot of the rrnB P1 relative promoter activity (RPA) in the presence of 650 nM DksA versus the iNTPs concentration. (D) rrnB P1 (dis) promoter activity with 1X iNTPs and with no modulators (lane 1); with 200 μM ppGpp (lane 2); with 650 nM DksA (lane 3); with 200 μM ppGpp and 650 nM DksA (lane 4). (E) λ pR promoter activity with no modulators (lane 1); with 200 μM ppGpp (lane 2); with 650 nM DksA (lane 3); with 200 μM ppGpp and 650 nM DksA (lane 4); with 200 μM ppGpp added after RPo formation (lane 5). All transcription reactions were carried out in the presence 100 μg/ml heparin. The two bands of the transcript are probably due to inhomogeneous run-off termination. For each gel, the RPA indicated below each lane was determined from the cumulative intensity of the two bands relative to that in lane 1 except for lane 4 in panel B which is relative to lane 3.

References

    1. Haugen S.P., Ross W., Gourse R.L. Advances in bacterial promoter recognition and its control by factors that do not bind DNA. Nat. Rev. Microbiol. 2008;6:507–519. - PMC - PubMed
    1. Paul B.J., Barker M.M., Ross W., Schneider D.A., Webb C., Foster J.W., Gourse R.L. DksA: a critical component of the transcription initiation machinery that potentiates the regulation of rRNA promoters by ppGpp and the initiating NTP. Cell. 2004;118:311–322. - PubMed
    1. Murray H.D., Schneider D.A., Gourse R.L. Control of rRNA expression by small molecules is dynamic and nonredundant. Mol. Cell. 2003;12:125–134. - PubMed
    1. Lyzen R., Kochanowska M., Wegrzyn G., Szalewska-Palasz A. Transcription from bacteriophage lambda pR promoter is regulated independently and antagonistically by DksA and ppGpp. Nucleic Acids Res. 2009;37:6655–6664. - PMC - PubMed
    1. Davis C.A., Bingman C.A., Landick R., Record M.T., Saecker R.M. Real-time footprinting of DNA in the first kinetically significant intermediate in open complex formation by Escherichia coli RNA polymerase. Proc. Natl Acad. Sci. U.S.A. 2007;104:7833–7838. - PMC - PubMed

Publication types

MeSH terms