. 2015 Jun 12;290(24):15163-74.
doi: 10.1074/jbc.M114.622209. Epub 2015 Apr 27.

Role of Apolipoprotein E in β-Amyloidogenesis: ISOFORM-SPECIFIC EFFECTS ON PROTOFIBRIL TO FIBRIL CONVERSION OF Aβ IN VITRO AND BRAIN Aβ DEPOSITION IN VIVO

Affiliations

Role of Apolipoprotein E in β-Amyloidogenesis: ISOFORM-SPECIFIC EFFECTS ON PROTOFIBRIL TO FIBRIL CONVERSION OF Aβ IN VITRO AND BRAIN Aβ DEPOSITION IN VIVO

Yukiko Hori et al. J Biol Chem. .

Erratum in

Abstract

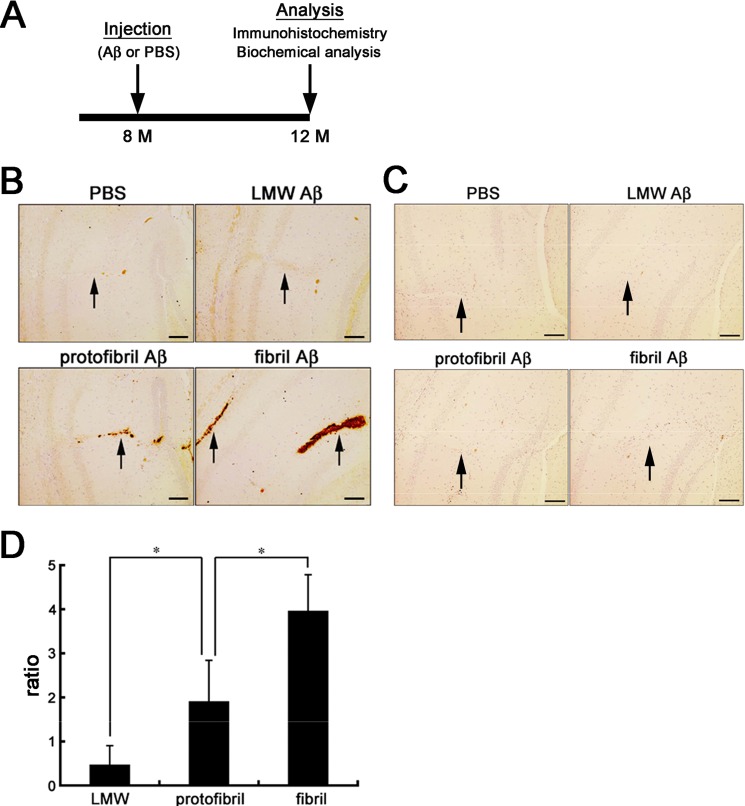
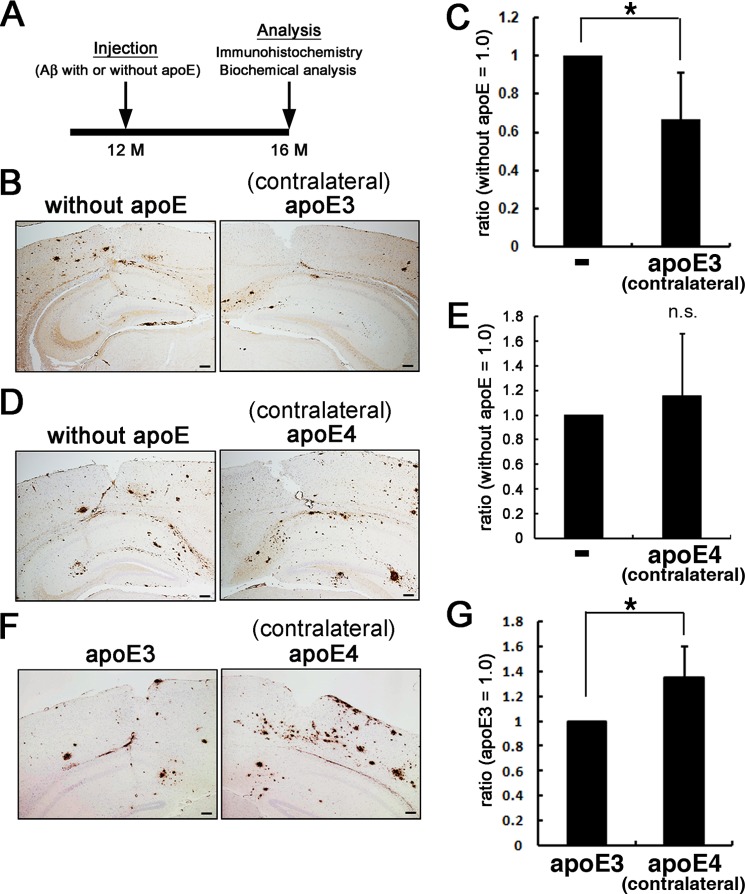
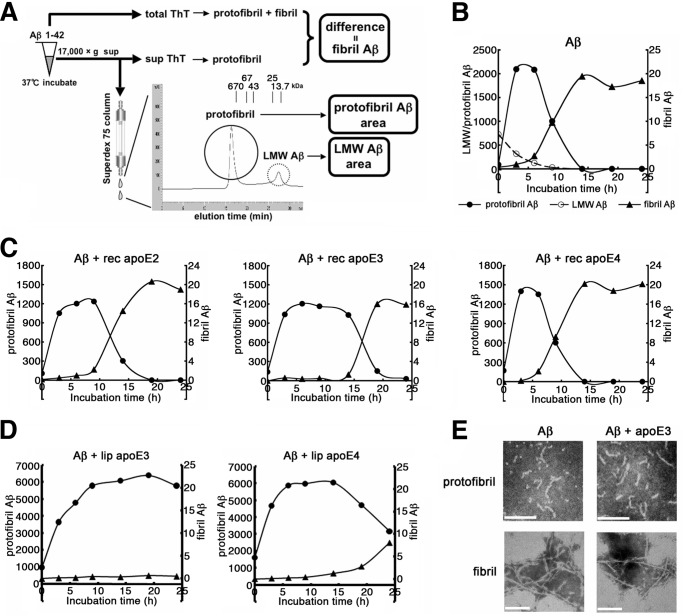
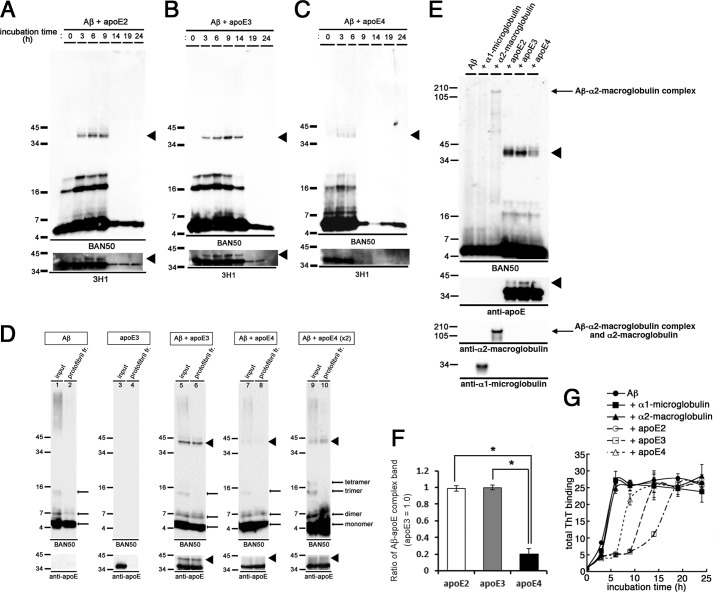
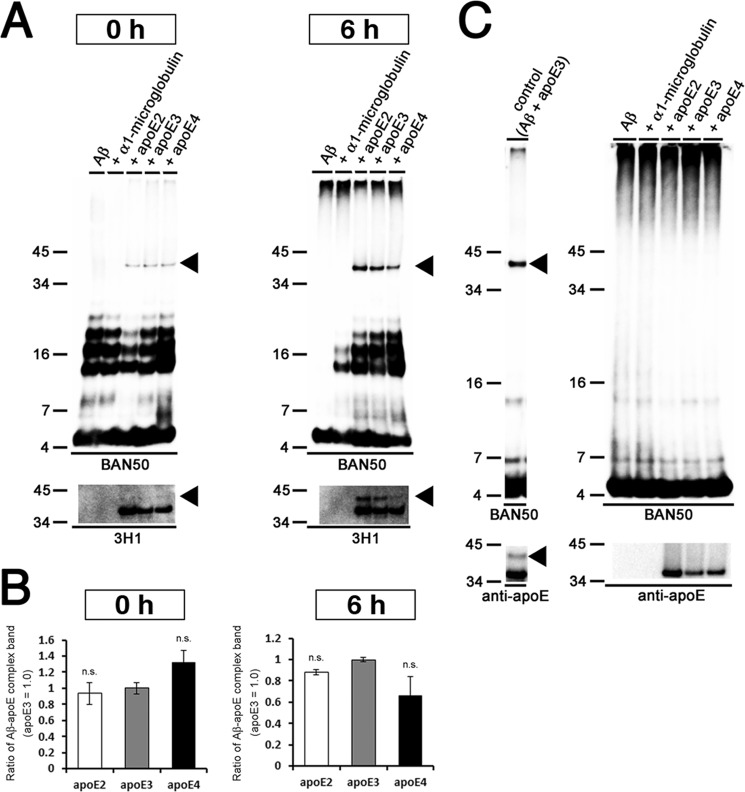
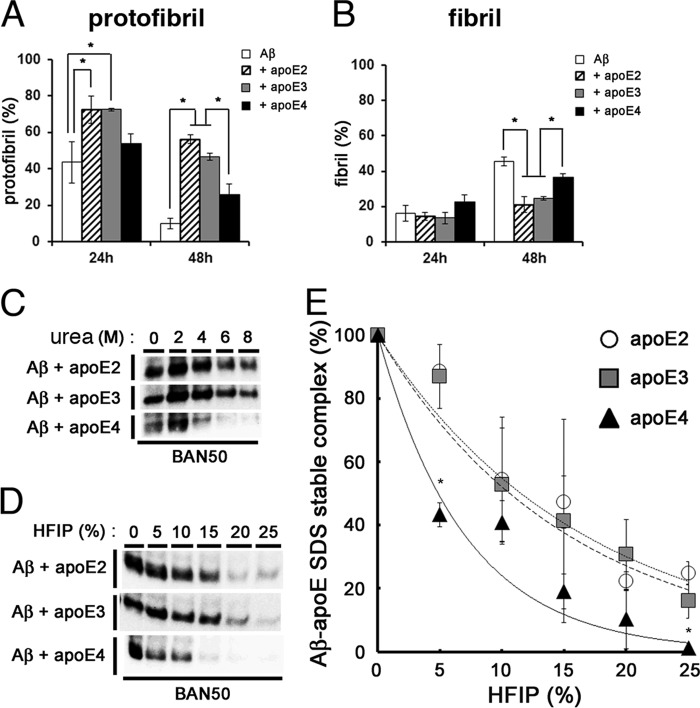
Human APOE ϵ4 allele is a strong genetic risk factor of Alzheimer disease. Neuropathological and genetic studies suggested that apolipoprotein E4 (apoE4) protein facilitates deposition of amyloid β peptide (Aβ) in the brain, although the mechanism whereby apoE4 increases amyloid aggregates remains elusive. Here we show that injection of Aβ protofibrils induced Aβ deposition in the brain of APP transgenic mice, suggesting that Aβ protofibrils acted as a seed for aggregation and deposition of Aβ in vivo. Injection of Aβ protofibrils together with apoE3 significantly attenuated Aβ deposition, whereas apoE4 did not have this effect. In vitro assays revealed that the conversion of Aβ protofibrils to fibrils progressed more slowly upon coincubation with apoE2 or apoE3 compared with that with apoE4. Aβ protofibrils complexed with apoE4 were less stable than those with apoE2 or apoE3. These data suggest that the suppression effect of apoE2 or apoE3 on the structural conversion of Aβ protofibrils to fibrils is stronger than those of apoE4, thereby impeding β-amyloid deposition.

Keywords: Alzheimer disease; amyloid; amyloid-β; apolipoprotein E; protein stability.


Figures

FIGURE 1.
FIGURE 1.
In vivo seeding effects of Aβ protofibrils and fibrils in the brains of A7 mice. A, schematic representation of the timeline of experiments. A7 mice were injected with Aβ or PBS into the neocortex and hippocampus at 8 months. Then at 4 months after injection, the both hemispheres were immunohistochemically or biochemically analyzed. B and C, Aβ immunostaining of the hippocampi and neocortices of mouse brains injected with PBS, LMW, protofibril, or fibril Aβ. A7 mice (B) or wt (C) mice were injected with PBS, LMW, protofibril, or fibril Aβ, respectively, into the hippocampi and neocortices at 8 months old, and Aβ deposits around the trajectories of injection (arrows) were immunostained by 82E1 at 12 months. Representative images in each group (n = 4) are shown. Scale bar, 100 μm. D, relative levels of insoluble Aβ42 in the hippocampi of A7 mice injected with different Aβ preparations. Hippocampi of A7 mice injected with PBS, LMW, protofibril, or fibril Aβ, respectively, at 8 months old were dissected at 12 months, and the levels of insoluble Aβ42 were measured by two-site ELISA. The bars represent the mean ratios of the levels of insoluble Aβ42 after injection of LMW (n = 4), protofibril (n = 3), or fibril (n = 3) forms of Aβ divided by those injected with PBS. The mean values ± S.D. are shown. *, p < 0.05. One-way analysis of variance was used.
FIGURE 2.
FIGURE 2.
In vivo effects of apoE on the seeding effects of Aβ protofibrils. A, schematic representation of the timeline of experiments. A7 mice were injected with Aβ protofibrils preincubated with or without apoE into the neocortex and hippocampus at 12 months. At 4 months after injection, both hemispheres were immunohistochemically or biochemically analyzed. B and C, A7 mice were injected with Aβ protofibrils preincubated without apoE on one side of the neocortex and hippocampus and those with apoE3 on the contralateral side. The both hemispheres were immunohistochemically analyzed for Aβ using 82E1 antibody (B; n = 3 in each group) or subjected to biochemical quantification of insoluble Aβ (C; n = 5). Insoluble Aβ levels were quantitated by two-site ELISA, and the ratios of those in the contralateral side (i.e. injected with protofibrils preincubated with apoE3) divided by those in the side injected with Aβ protofibrils alone) were calculated (C). Similarly, those injected with protofibrils preincubated without apoE on one side and with apoE4 on the contralateral side (D; n = 3 in each group, E; n = 5) and those injected with protofibrils preincubated with apoE3 on one side and with apoE4 on the contralateral side (F; n = 3 in each group, G; n = 5) were immunohistochemically and biochemically analyzed. Scale bars, 100 μm. The mean values ± S.D. are shown. *, p < 0.05.
FIGURE 3.
FIGURE 3.
Isoform-dependent effects of apoE on the formation of Aβ protofibrils and fibrils in vitro. A, schematic depiction of the method for the measurement of LMW, protofibril, and fibril forms of Aβ. The levels of LMW Aβ and protofibril Aβ are quantitated as areas corresponding to the ∼10-kDa peak and >100-kDa peak, respectively. The levels of Aβ fibrils are evaluated as the differences of ThT binding between samples prior to (total ThT) and after centrifugation (sup ThT). B, time course of the formation of LMW, protofibril, and fibril Aβ as monitored by SEC and ThT binding. 22 μm of Aβ(1–42) was incubated for 0, 3, 6, 9, 14, 19, or 24 h, and the levels of LMW Aβ (open circles) and protofibril Aβ (filled circles) were quantitatively evaluated by SEC and those of Aβ fibrils (triangles) by ThT binding, respectively. Representative data out of four independent experiments (that showed similar profiles) are shown. C, the effects of recombinant (rec) apoE on the formation of protofibril and fibril Aβ. 22 μm of Aβ(1–42) was incubated for 0, 3, 6, 9, 14, 19, or 24 h with 220 nm of rec apoE2 (left panel, n = 4), rec apoE3 (middle panel, n = 5), or rec apoE4 (right panel, n = 4), and the time course of the formation of Aβ protofibrils (circles) and fibrils (triangles) was monitored as in B. The starting time points of fibril formation were estimated to be 7.6, 13.9, and 5.2 h, respectively, in preparations incubated with rec apoE2, apoE3, and apoE4. The mean values are shown. D, the effects of the lipidated (lip) apoE particles on the formation of protofibril and fibril Aβ. 22 μm of Aβ(1–42) was incubated for 0, 3, 6, 9, 14, 19, or 24 h with 220 nm of lipid apoE3 particles (left panel, n = 4) or lipid apoE4 particles (right panel, n = 4), and the time course of the formation of protofibrils (circles) and fibrils (triangles) were monitored as in C. Fibril formation was observed starting at >24 h and 24 h of incubation, respectively, in preparations incubated with lipidated (lip) apoE3 and apoE4. The mean values are shown. E, negative stain electron microgram of protofibril and fibril forms of Aβ(1–42) incubated alone (left column) or with apoE3 (right column) for 6 h (protofibrils, upper row) and 24 h (fibrils, lower row), respectively. Scale bar, 100 nm.
FIGURE 4.
FIGURE 4.
Formation of SDS-stable Aβ-apoE complex in vitro. A–C, time course of formation of the SDS-stable Aβ-apoE complex. 22 μm of Aβ(1–42) was incubated for 0, 3, 6, 9, 14, 19, or 24 h with rec apoE2 (A), rec apoE3 (B), or rec apoE4 (C). After centrifugation, SDS-stable Aβ-apoE complex was monitored by immunoblot analyses with an anti-Aβ antibody (BAN50, upper panel) and an anti-apoE antibody (3H1, bottom panel). Arrowheads indicate the SDS-stable Aβ-apoE complex bands (n = 3). D, formation of SDS-stable Aβ-apoE complex in the Aβ protofibril fraction. Immunoblot analyses of isolated protofibrils without apoE (lanes 1 and 2), with rec apoE3 (lanes 5 and 6), with rec apoE4 (lanes 7–10), and of rec apoE3 alone (lanes 3 and 4) with an anti-Aβ antibody (BAN50, upper panels) and an anti-apoE antibody (bottom panels). Lanes 9 and 10 were loaded with double the amount of samples. Arrowheads indicate the bands corresponding to SDS-stable Aβ-apoE complex migrating at ∼40 kDa (n = 3). E, 22 μm of Aβ(1–42) was incubated alone (Aβ) or with rec α1-microglobulin, rec α2M, rec apoE2, rec apoE3, or rec apoE4 for 6 h. After centrifugation at 17,000 × g for 5 min, SDS-stable complex was monitored by immunoblotting analyses using an anti-Aβ antibody (BAN50, upper panel), an anti-apoE antibody (3H1, the second panel from the top), an anti-α2M antibody (the third panel from the top), and an anti-α1-microglobulin antibody (bottom panel). Arrowheads indicate ∼40-kDa bands corresponding to the SDS-stable Aβ-apoE complex, and the arrow indicates the SDS-stable Aβ-α2M complex migrating at ∼190 kDa. F, quantitative measurement of the band intensities in E. The mean values ± S.D. in three independent experiments are shown as ratios relative to the values of apoE3 as 1.0. *, p < 0.05. One-way analysis of variance was used. G, in vitro Aβ fibrillization assay in the presence of binding proteins. 22 μm of Aβ(1–42) was incubated in the absence (filled circles) or presence of rec α1-microglobulin (the molar ratio of Aβ/α1-microglobulin at 100:1, filled squares), rec α2M (the molar ratio of Aβ/α2M at 100:1, filled triangles), rec apoE2 (the molar ratio of Aβ/apoE2 at 100:1, open circles), rec apoE3 (the molar ratio of Aβ/apoE3 at 100:1, open squares), or rec apoE4 (the molar ratio of Aβ/apoE4 at 100:1, open triangles) for 0, 3, 6, 9, 14, 19, and 24 h, and then ThT fluorescence was measured. The mean values in three independent experiments are shown.
FIGURE 5.
FIGURE 5.
Chemical cross-linking analyses of the interaction between Aβ protofibrils and apoE. A, 22 μm of Aβ(1–42) was incubated alone (Aβ) or with rec α1-microglobulin, rec apoE2, rec apoE3, or rec apoE4 for 0 or 6 h and cross-linked by PICUP. The binding between Aβ and apoE was assayed by immunoblot analyses using an anti-Aβ antibody (BAN50, upper panel) and an anti-apoE antibody (3H1, bottom panel). Arrowheads indicate bands corresponding to the SDS-stable Aβ-apoE complex. B, quantitative measurement of the band intensities in A. The mean values ± S.D. in three independent experiments are shown as ratios relative to the values of apoE3 as 1.0. n.s. means no significant difference. One-way analysis of variance was used. C, formation of SDS-stable Aβ-apoE complex from the preformed protofibrils. Post lanes, 22 μm of Aβ(1–42) was incubated for 6 h to generate protofibrils, and thus formed protofibrils were again incubated alone or with rec α1-microglobulin, rec apoE2, rec apoE3, or rec apoE4 for 8 h at 37 °C. Control lane, 22 μm of Aβ(1–42) was incubated for 6 h with rec apoE3. SDS-stable Aβ-apoE complex was detected by immunoblot analyses with an anti-Aβ antibody (BAN50, upper panels) or an anti-apoE antibody (bottom panels). Arrowheads indicate the bands corresponding to SDS-stable Aβ-apoE complex.
FIGURE 6.
FIGURE 6.
Isoform-dependent effects of apoE on the stability of Aβ protofibrils. A and B, the effects of apoE on the stability of Aβ protofibrils (A) and formation of fibrils (B). Aβ protofibrils isolated by SEC were incubated alone (white column), with rec apoE2 (hatched column), with rec apoE3 (gray column), or rec apoE4 (black column) for 24 and 48 h. After centrifugation at 17,000 × g for 5 min, the levels of protofibrils were monitored by the ThT fluorescence of supernatants, and those of fibrils were determined by the difference in ThT fluorescence between samples before and after centrifugation. The percentage of levels of protofibrils (A) and fibrils (B) at 24 or 48 h that comprise those prior to incubation as 100% (mean values ± S.D. in three independent experiments) are shown. *, p < 0.05. One-way analysis of variance was used. C, stability of SDS-stable Aβ-apoE complex against urea. 22 μm of Aβ(1–42) was incubated for 6 h with rec apoE2, rec apoE3, or rec apoE4, followed by addition of urea at 0, 2, 4, 6, or 8 m of final concentrations and additionally incubated for 12 h. SDS-stable Aβ-apoE complex was detected by immunoblot analyses with an anti-Aβ antibody (BAN50). D, stability of SDS-stable Aβ-apoE complex against HFIP. 22 μm of Aβ(1–42) was incubated for 6 h with rec apoE2, rec apoE3, or rec apoE4, followed by addition of HFIP at 0, 5, 10, 15, 20, or 25% of final concentrations and additionally incubated for 12 h. SDS-stable Aβ-apoE complex was detected by immunoblot analyses with an anti-Aβ antibody (BAN50). E, quantitation of data in D. The levels of Aβ-apoE2 (circles), Aβ-apoE3 (squares), and Aβ-apoE4 (triangles) complexes after addition of indicated concentrations of HFIP were evaluated by densitometry. The mean values ± S.D. in three independent experiments are shown. *, p < 0.05. One-way analysis of variance was used.

References

    1. Selkoe D. J. (2001) Alzheimer's disease: genes, proteins, and therapy. Physiol. Rev. 81, 741–766 - PubMed
    1. Dickson D. W. (1997) The pathogenesis of senile plaques. J. Neuropathol. Exp. Neurol. 56, 321–339 - PubMed
    1. Boyles J. K., Pitas R. E., Wilson E., Mahley R. W., Taylor J. M. (1985) Apolipoprotein E associated with astrocytic glia of the central nervous system and with nonmyelinating glia of the peripheral nervous system. J. Clin. Invest. 76, 1501–1513 - PMC - PubMed
    1. Pitas R. E., Boyles J. K., Lee S. H., Foss D., Mahley R. W. (1987) Astrocyte synthesize apolipoprotein E and metabolize apolipoprotein E-containing lipoproteins. Biochim. Biophys. Acta 917, 148–161 - PubMed
    1. Nakai M., Kawamata T., Taniguchi T., Maeda K., Tanaka C. (1996) Expression of apolipoprotein E mRNA in rat microglia. Neurosci. Lett. 211, 41–44 - PubMed

Publication types