. 2015 May 4;212(5):743-57.
doi: 10.1084/jem.20131675. Epub 2015 Apr 27.

Modular expression analysis reveals functional conservation between human Langerhans cells and mouse cross-priming dendritic cells

Affiliations

Modular expression analysis reveals functional conservation between human Langerhans cells and mouse cross-priming dendritic cells

Maxim N Artyomov et al. J Exp Med. .

Abstract

Characterization of functionally distinct dendritic cell (DC) subsets in mice has fueled interest in whether analogous counterparts exist in humans. Transcriptional modules of coordinately expressed genes were used for defining shared functions between the species. Comparing modules derived from four human skin DC subsets and modules derived from the Immunological Genome Project database for all mouse DC subsets revealed that human Langerhans cells (LCs) and the mouse XCR1(+)CD8α(+)CD103(+) DCs shared the class I-mediated antigen processing and cross-presentation transcriptional modules that were not seen in mouse LCs. Furthermore, human LCs were enriched in a transcriptional signature specific to the blood cross-presenting CD141/BDCA-3(+) DCs, the proposed equivalent to mouse CD8α(+) DCs. Consistent with our analysis, LCs were highly adept at inducing primary CTL responses. Thus, our study suggests that the function of LCs may not be conserved between mouse and human and supports human LCs as an especially relevant therapeutic target.


Figures

Figure 1.
Figure 1.
Experimental strategy. The research strategy showing the computational and functional analyses that are involved in identifying and validating functional homology between human and mouse DC subsets.
Figure 2.
Figure 2.
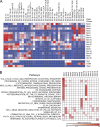
Gene co-expression network analysis identifies conserved transcriptional modules in mouse and human skin DCs. (A) Transcriptional landscape of mouse DCs described in 16 modules (Mm1–Mm16). Expression values for eigen genes corresponding to each module are shown, as well as the expression of xcr1, cd8a, and (Itgae) CD103 as identifiers of cross-presenting subsets (bottom). (B) Enrichment of annotated pathways in individual murine transcriptional modules. Top 19 enriched pathways are shown.
Figure 3.
Figure 3.
Characterization of human epidermal and dermal DCs. (A) Epidermal- and dermal-resident DCs were allowed to migrate from their respective tissues and were harvested after 2 d. The cells were stained with CD1a and CD14 mAbs, and analyzed by flow cytometry. Epidermal sheets yielded CD1ahiCD14 cells (LCs; blue). Dermis yielded two distinct populations: CD1aCD14+ cells (dermal CD14+ DCs; Red) and CD1a(dim)CD14 cells (dermal CD1a(dim) DCs). Dermal CD1a(dim)Langerin(neg) DC population was further divided into two major sub populations based on CD141 expression (dark and light purple). 1 representative out of at least 30 donors analyzed. (B) Principal component analysis (PCA) of microarray data describing the relationship between the distinct human skin DC subsets: LCs, dermal CD1a(dim)CD141, dermal CD1a(dim)CD141+, and dermal CD14+ DCs. Plot shows the first two principal components. Data of 3–4 donors from each DC subset are graphed. (C, top) Expression values for nine eigen genes describing transcriptional modules that were identified for four human skin DC subset through Gene Coexpression Network Analysis. (C, bottom) Conservation analysis (through Fisher’s exact test) between human and mouse transcriptional modules is shown. Higher red color intensity signified a greater significant overlap between the modules. (D) PSME1, Sec61a, and TAP2 expression in Langerhans cells: 5-µm skin sections were co-stained for nuclei using DAPI (blue), Langerin (AF488 channel, green), and either PSME1, Sec61a, or TAP2 (AF647 channel, red) as stated in the Materials and methods section. (left) Staining was observed in three channels corresponding to DAPI, AF488, or AF647 and co-localization between AF488 and AF647 channels was observed in the merged picture. Pictures show one representative z position. DCs expressing PSME1, Sec61a, or TAP2, (co-localization between AF488 and AF647 channel) are highlighted in white squares. (right) 9× numerical zoom on highlighted DCs is shown and white arrows show co-localization between Langerin and markers of interest. Bar, 100 µm. Representative images out of six independent experiments done with four different donors.
Figure 4.
Figure 4.
Characterization of human epidermal and dermal DCs. (A) Flow cytometry analysis of isolated epidermal and dermal cells. Cells were gated on epidermal CD1ahi LCs, dermal CD1a(dim) or dermal CD14+ populations and analyzed for the expression of CD11b, CD11c, Langerin, CD24, Sirpα, and BTLA. CD1ahiLangerin+ DCs that were found in the dermal suspension were excluded from this analysis. Representative phenotype of one out of five examined donors. (B and C) Gene expression analysis showing relative amounts of mRNAs expression of IL-15 (A) and Zbtb46 (B) by sorted skin DC subsets: epidermal LCs, dermal CD1a(dim)CD141 DCs, CD1a(dim)CD141+ DCs, and CD14+ DCs isolated from at least three different specimens. Mean values ± SEM; n > 3 are plotted.
Figure 5.
Figure 5.
Enrichment of human LC-specific genes in different signatures as computed through GSEA. The GSEA algorithm for the enrichment of a specific gene signature in a gene expression dataset was performed. The genes are first arranged by expression level with the highest expressed genes on the left and the lowest expressed genes on the right. The positions of each of the genes in the “set” or “signature” is depicted by the black lines. The score is a running sum calculated by the expression level of each gene in the signature moving from left to right. (A) Human blood CD141+ DC specific signature among LC genes (P < 10−4). Human blood CD141+ DC specific signature was identified as top 200 genes specific for CD141+ DCs relative to other blood DC subtypes based on data from Haniffa et al., 2012 (Fig. S2). (B) LC-specific gene signature (200 most LC-specific genes from module 2, which is enriched in cross-presentation pathway) is enriched in human blood CD141+ DCs (P < 10−4). (C) Genes from annotated antigen cross-presentation pathway (REACTOME; P < 10−4) and eight other annotated cross-presentation related pathways are also enriched in human LCs (Fig. S3 B). (D) Migratory DC signature defined by Immgen (Miller et al., 2012) in human LCs (P < 10−4).
Figure 6.
Figure 6.
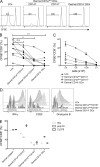
LCs are more efficient than dermal DCs at priming allogeneic naive CD8+ T cells. (A) Proliferation of allogeneic naive CD8+ T cells primed with sorted skin LCs, dermal CD1a(dim)CD141 DCs, dermal CD1a(dim)CD141+ DCs, or dermal CD14+ DCs was measured after 6 d by the dilution of CFSE dye as analyzed by flow cytometry. Histograms show the percentage of proliferating (CFSElo) CD3+CD8+ T cells. Data are representative of eight independent experiments. (B) Graph shows the percentage of proliferating (CFSElo) CD3+CD8+ T cells in nine experiments. (C) Graph shows the percentage of naive CD8+ T cell that diluted CFSE in response to descending numbers of each DC subset that are present in the culture. Graph shows Mean ± SEM; n = 3. (D) Graph shows the percentage of naive CD8+ T cell that diluted CFSE in response to each DC subset that were activated with either CD40L, TLR3-agonist (Poly I:C), or TLR7/8-agonist (CLO75). Data are representative of three independent experiments. (E) Allogeneic CFSE-labeled naive CD8+ T cells were primed for 7 d by each skin mDC subset. The proliferating CFSElo cells were stained and analyzed by flow cytometry for the expression of the effector molecules IFN-γ and Granzyme B, as well as the activation marker CD25 upon restimualtion with PMA and Ionomycin. Data are representative of three independent experiments.
Figure 7.
Figure 7.
LCs Are highly efficient at cross-presenting and cross-priming antigens to CD8+ T cells. (A) Skin DC subsets (LCs, dermal CD1a(dim)CD141, CD1a(dim)CD141+, and dermal CD14(dim) DCs) from an HLA-A201+ donor were loaded with 10 aa HLA-A201-MART-1–restricted epitope and cultured with a specific CD8+ T cell clone. Graph shows the amounts of IFN-γ that were measured in the culture supernatant after 48 h by Luminex. One representative experiment out of three performed. (B) Skin DC subsets (LCs, dermal CD1a(dim)CD141, CD1a+CD141+, and dermal CD14+ DCs) from an HLA-A201+ donor were loaded with 15 aa MART-1 peptide containing the HLA-A201–restricted epitope and cultured with MART-1–specific CD8+ T cell clone. Graph shows the amounts of IFN-γ that were measured in the culture supernatant after 48 h. One representative experiment out of three performed. (C) LCs display more antigen uptake compared with other skin DC subsets. Epidermal or dermal DCs were cultured with 40 kD FITC-labeled Dextran at conc. 1 mg/ml at either 4°C or 37°C. The uptake was measured by the amount of FITC fluorescence in the cells after 30 or 90 min by flow cytometry. Cells that were not exposed to beads served as an additional control. (right) Histograms show FITC uptake by the different DC subsets at 30 min. (left) Graph shows FITC geometric mean as measured for the different skin DC subsets after 30 and 90 min. One representative experiments of three performed. (D) Blood DC subsets (CD1c+ and CD141+) from an HLA-A201+ donor were loaded with 10 aa HLA-A201-MART-1–restricted epitope and cultured with a specific CD8+ T cell clone. Graph shows the amounts of IFN-γ that were measured in the culture supernatant after 48h by Luminex. One representative experiments out of three performed. (E) Blood DC subsets (CD1c+ and CD141+) from an HLA-A201+ donor were loaded with 15 aa MART-1 peptide containing the HLA-A201–restricted epitope and cultured with MART-1–specific CD8+ T cell clone. Graph shows the amounts of IFN-γ that were measured in the culture supernatant after 48 h. One representative experiment out of three performed. (F) To assess cross-priming, skin DC subsets were incubated with a MART-1 protein and autologous naive CD8+ T cells. After 9 d, IFN-γ–producing CD8+ T cells were assessed by flow cytometry upon restimulation with fresh MART-1–loaded DCs. (Graph shows mean ± SEM; n = 3). (G, top) To assess the cross-priming of a specific MART-1 CD8+ T cell epitope, skin DC subsets (LCs, dermal CD1a(dim)CD141, CD1a(dim)CD141+, and dermal CD14+ DCs) from an HLA-A201+ donor were incubated with 15 aa MART-1 peptide containing the HLA-A201–restricted epitope and with autologous purified CD8+ T cells for the donor’s skin. After 10 d, the number of MART-1–specific CD8+ T cells was determined by the binding of a specific tetramer. (bottom) Similar to the top, except that CD8+ T cells were purified from the donor’s blood. Two representative experiments of six performed.

References

    1. Amit I., Regev A., and Hacohen N.. 2011. Strategies to discover regulatory circuits of the mammalian immune system. Nat. Rev. Immunol. 11:873–880. - PMC - PubMed
    1. Bachem A., Güttler S., Hartung E., Ebstein F., Schaefer M., Tannert A., Salama A., Movassaghi K., Opitz C., Mages H.W., et al. . 2010. Superior antigen cross-presentation and XCR1 expression define human CD11c+CD141+ cells as homologues of mouse CD8+ dendritic cells. J. Exp. Med. 207:1273–1281 10.1084/jem.20100348 - DOI - PMC - PubMed
    1. Banchereau J., and Steinman R.M.. 1998. Dendritic cells and the control of immunity. Nature. 392:245–252 10.1038/32588 - DOI - PubMed
    1. Banchereau J., Thompson-Snipes L., Zurawski S., Blanck J.P., Cao Y., Clayton S., Gorvel J.P., Zurawski G., and Klechevsky E.. 2012a. The differential production of cytokines by human Langerhans cells and dermal CD14(+) DCs controls CTL priming. Blood. 119:5742–5749 10.1182/blood-2011-08-371245 - DOI - PMC - PubMed
    1. Banchereau J., Zurawski S., Thompson-Snipes L., Blanck J.P., Clayton S., Munk A., Cao Y., Wang Z., Khandelwal S., Hu J., et al. . 2012b. Immunoglobulin-like transcript receptors on human dermal CD14+ dendritic cells act as a CD8-antagonist to control cytotoxic T cell priming. Proc. Natl. Acad. Sci. USA. 109:18885–18890 10.1073/pnas.1205785109 - DOI - PMC - PubMed

Publication types

Substances