. 2015 May 4;212(5):759-74.
doi: 10.1084/jem.20141843. Epub 2015 Apr 27.

Specific bone cells produce DLL4 to generate thymus-seeding progenitors from bone marrow

Affiliations

Specific bone cells produce DLL4 to generate thymus-seeding progenitors from bone marrow

Vionnie W C Yu et al. J Exp Med. .

Abstract

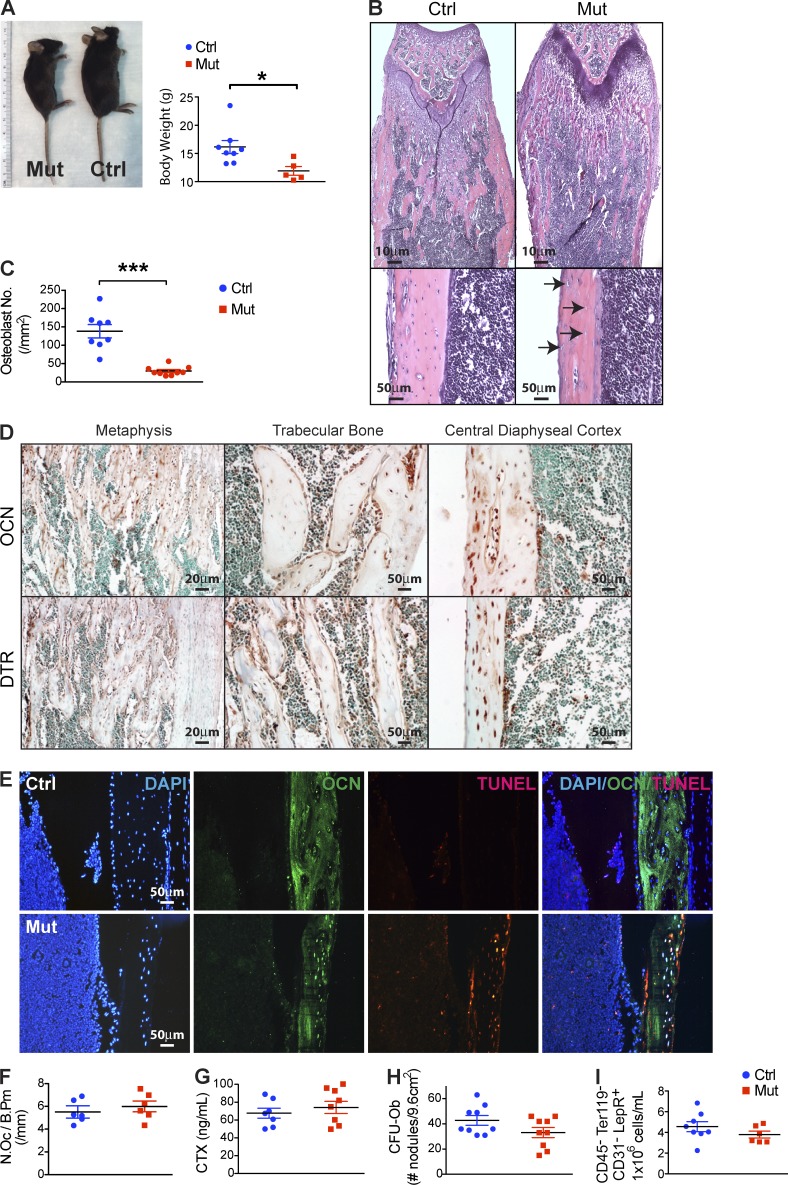
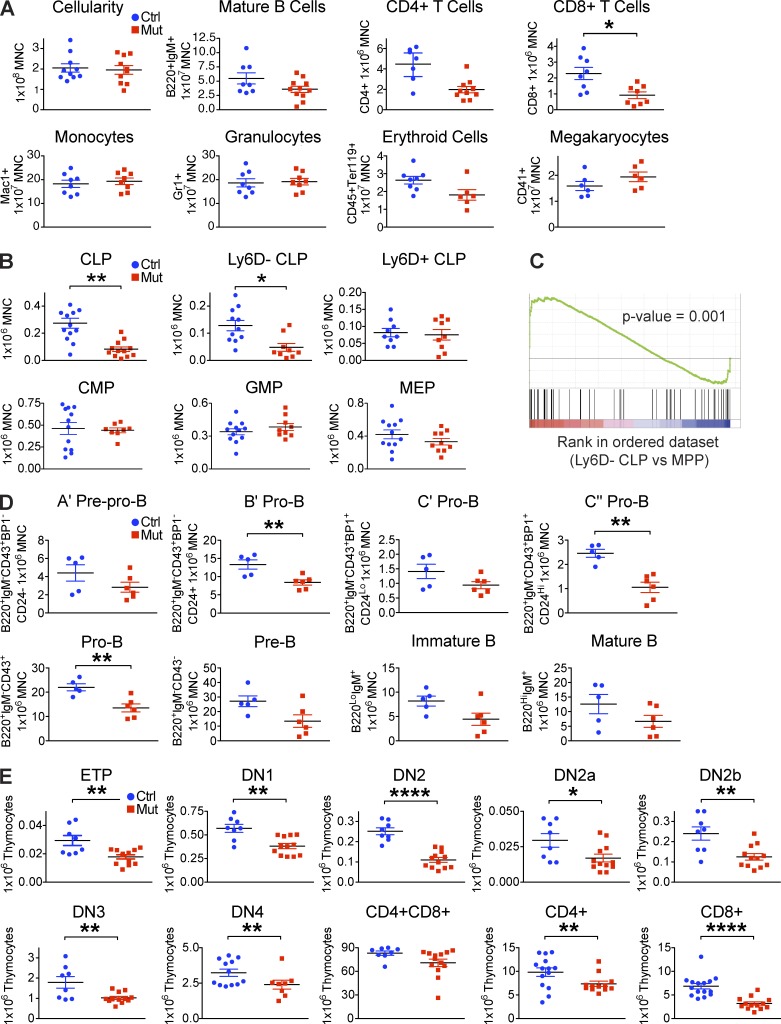
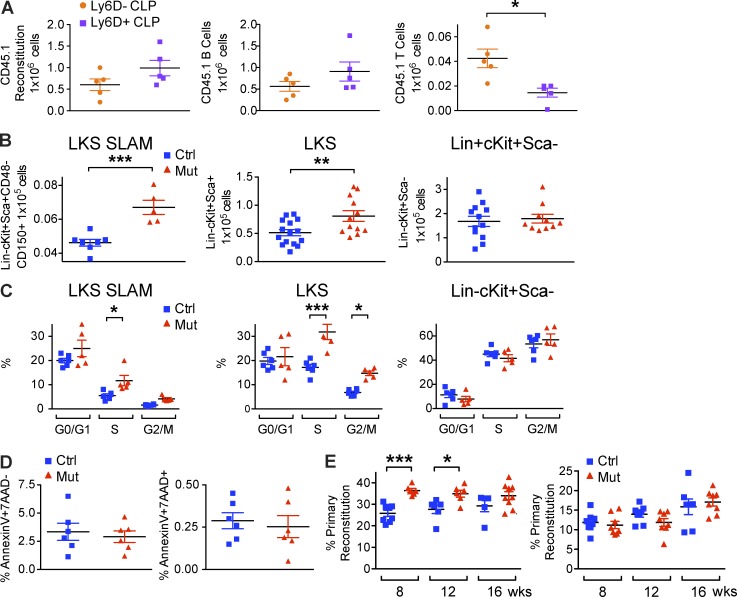
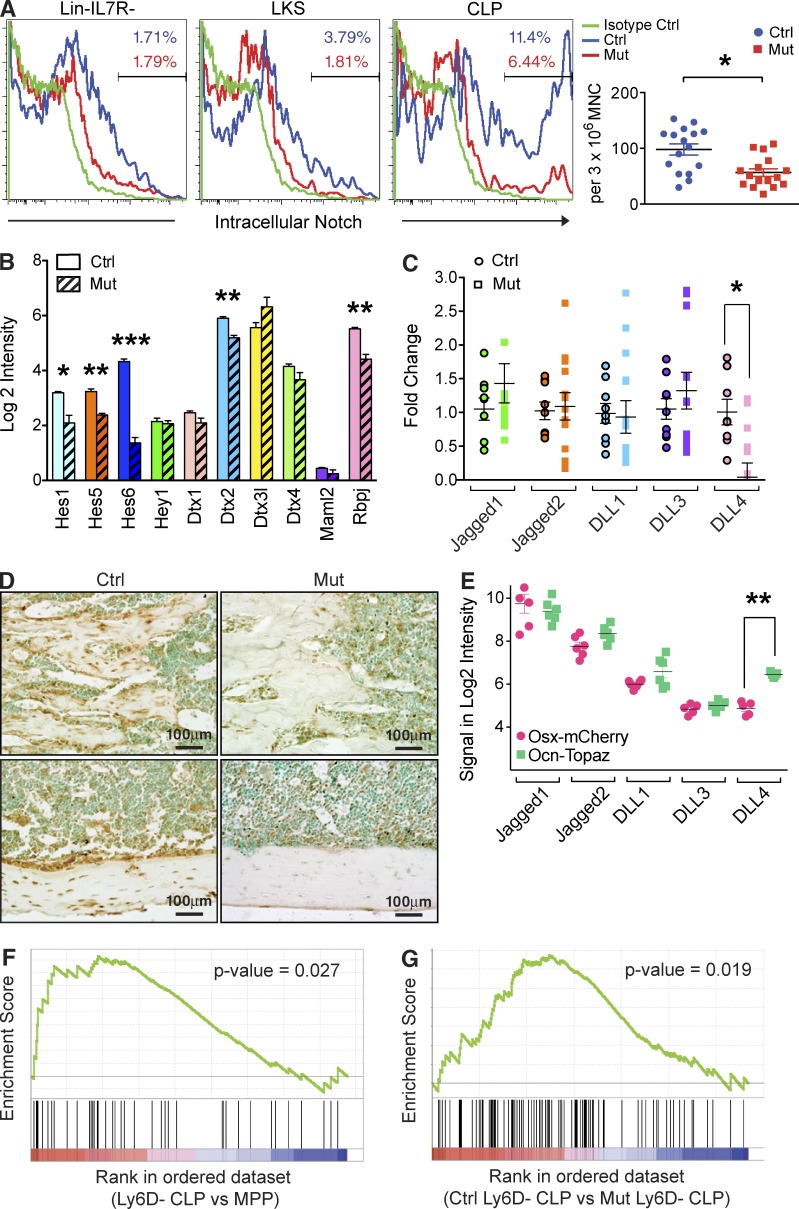
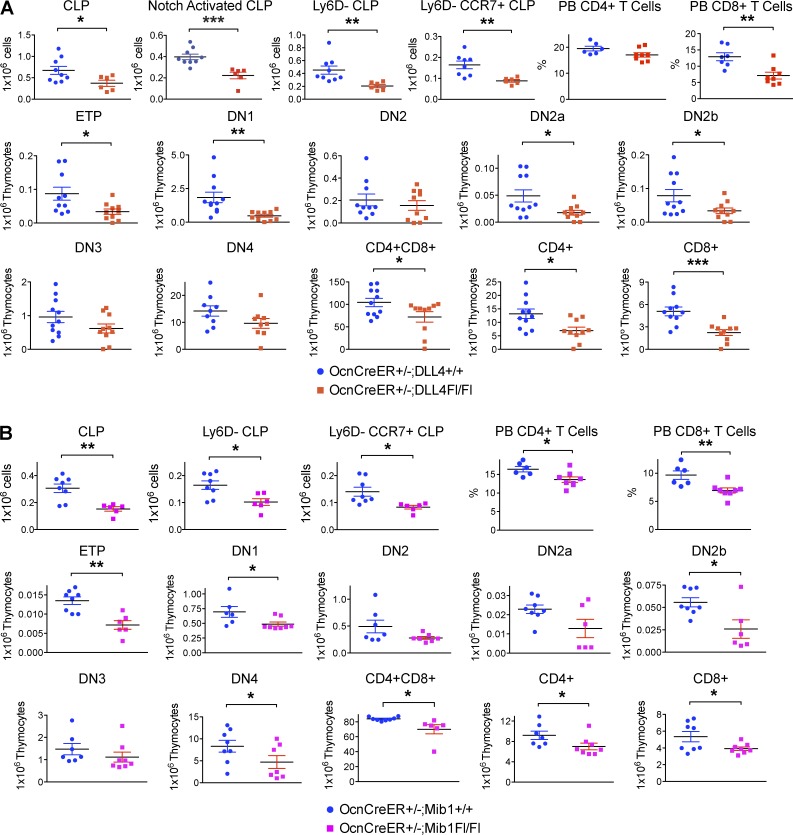
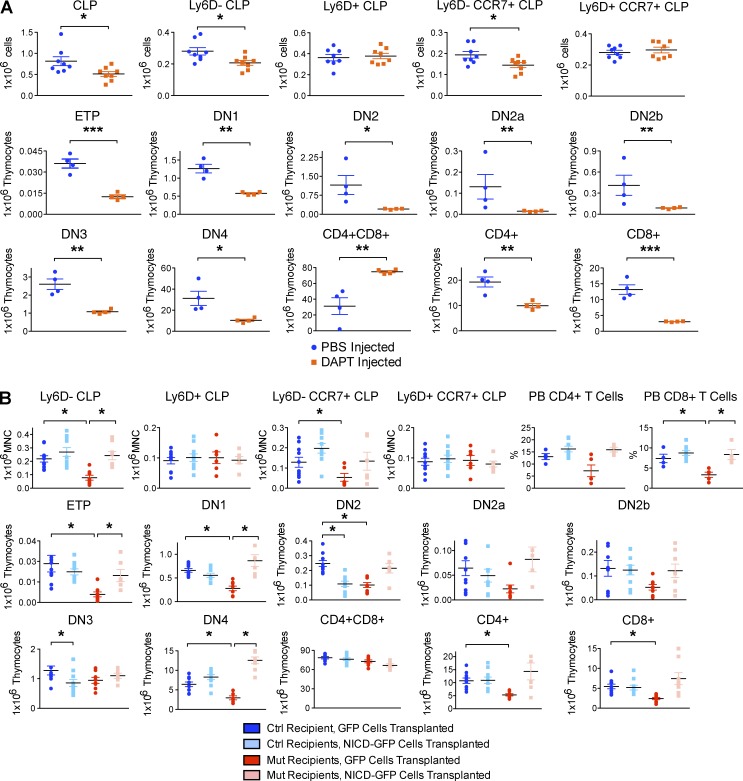
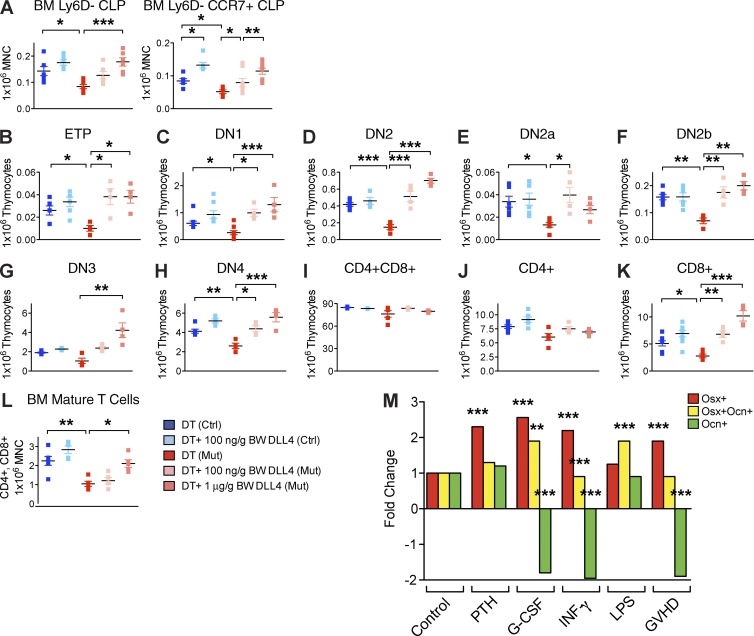
Production of the cells that ultimately populate the thymus to generate α/β T cells has been controversial, and their molecular drivers remain undefined. Here, we report that specific deletion of bone-producing osteocalcin (Ocn)-expressing cells in vivo markedly reduces T-competent progenitors and thymus-homing receptor expression among bone marrow hematopoietic cells. Decreased intrathymic T cell precursors and decreased generation of mature T cells occurred despite normal thymic function. The Notch ligand DLL4 is abundantly expressed on bone marrow Ocn(+) cells, and selective depletion of DLL4 from these cells recapitulated the thymopoietic abnormality. These data indicate that specific mesenchymal cells in bone marrow provide key molecular drivers enforcing thymus-seeding progenitor generation and thereby directly link skeletal biology to the production of T cell-based adaptive immunity.


Figures

Figure 1.
Figure 1.
Ocn+ cell–specific deletion in vivo without altering osteoclastogenesis and mesenchymal progenitors. (A) WT mice (Ctrl) Ocn+ osteolineage cell deletion mice (Mut) were monitored for body size and weight; n = 8–10 mice/group. Data show mean ± SEM. (B) Femurs and tibiae in the OcnCre+/−;iDTR mutants or WT (Ctrl) mice were assessed histologically. Bottom images are at a higher magnification with arrows pointing to empty lacunae within the cortex and altered endosteal surface; images reflect comparable findings in all animals; n = 8/experiment. (C) Osteoblasts in the OcnCre+/−;iDTR and WT mice were quantitated by histomorphometry; n = 7–8 mice/group. Data show mean ± SEM. (D and E) Ocn and DTR expression was examined in bone sections from untreated OcnCre+/−;iDTR by immunohistochemistry using Ocn- and DTR-specific antibodies (D), or by immunofluorescence using Ocn-specific antibodies and TUNEL staining after DT treatment (E); n = 6 mice/group. (F) Osteoclast numbers were assessed by TRAP staining (n = 6 mice/group) and (G) osteoclast activity by collagen breakdown in sera using ELISA assay; n = 7–8 mice/group. Data show mean ± SEM. (H) Mesenchymal progenitor activity in the bone marrow of OcnCre+/−;iDTR mutants or WT controls was assessed by CFU-Ob assay; n = 9 mice/group. Data show mean ± SEM. (I) CD31CD45Ter119LepR+ cells in the bone marrow stroma of OcnCre+/−;iDTR mutants and controls were quantified by flow cytometry; n = 6–7 mice/group. Data show mean ± SEM. (A–I) For each experiment, 3–6 independent repeats were performed.
Figure 2.
Figure 2.
Ocn+ cell deletion decreases T cell competent lymphoid progenitors and T lineage cells. (A) Flow cytometric evaluation of lymphoid, myeloid, erythroid, and megakaryocytic mature cells and (B) T cell competent (Ly6D) CLP, B potential enriched (Ly6D+) CLP, CMP, GMP, and MEP populations in the bone marrow of control and Ocn+ cell–deleted animals. Minimum of three independent experiments; n = 8–16 mice/group. Data show mean ± SEM. (C) Gene set enrichment analysis (GSEA) comparing Ly6D CLP versus multipotent progenitor (MPP) microarray data. Experiment was performed twice independently; n = 3/experiment. (D) Flow cytometric quantification of different stages of B progenitors and mature cells in the bone marrow of OcnCre;iDTR mutant and control littermates. Experiment was performed twice independently; n = 5–6 mice/group. Data show mean ± SEM. (E) Flow cytometric quantification of T cell subsets in the thymus. Minimum of four independent experiments; n = 8–12 mice/group. Data show mean ± SEM.
Figure 3.
Figure 3.
Lymphopenic phenotype in OcnCre;iDTR mice was not caused by a stem cell defect. (A) 44,000 flow sorted Ly6D or Ly6D+ CLPs from SJL (CD45.1) mice were intravenously transplanted into each of 10 nonirradiated C57BL/6J (CD45.2) recipients. Recipients were bled 3 wk after transplant for enumeration of donor-derived B and T reconstitution by staining with CD45.1, B220, CD4 and CD8 antibodies and analysis by flow cytometry. Experiment was performed twice independently; n = 10/experiment. Data show mean ± SEM. (B) Mature osteolineage cells were deleted from OcnCre;iDTR mice and hematopoietic stem cells (LKS SLAM), LineageLoc-Kit+Sca+ (LKS) multipotent progenitors, and LineageLoc-Kit+Sca cells were enumerated by flow cytometry. (C) Cell cycle analysis of the indicated cell populations was performed by flow cytometry. (D) Frequency of apoptotic (AnnexinV+7-AAD) and necrotic (AnnexinV+7-AAD+) LKS SLAM, LKS, and LineageLoc-Kit+Sca cells was assessed. Experiments were repeated 3 times independently; n = 5–16 mice/group. Data show mean ± SEM. (E) CD45.2 OcnCre;iDTR mutant or control donor cells were mixed with CD45.1 SJL donor cells in a 1:1 ratio, injected into primary SJL recipients. Reconstitution was assessed at 8, 12, and 16 wk after transplantation. Bone marrow cells from primary recipients were harvested and transplanted into secondary recipients. Reconstitution was assessed at 8, 12, and 16 wk following transplantation. Transplantation was performed twice independently; n = 20–22 mice/experiment. Data show mean ± SEM.
Figure 4.
Figure 4.
Ocn+ cell regulation of T lymphopoiesis is dependent on bone marrow microenvironment. (A) 106 WT CD45.1 hematopoietic bone marrow cells were transplanted into lethally irradiated CD45.1 OcnCre;iDTR hosts that were untreated or treated with DT. Animals were bled at 8, 12, and 16 wk after transplantation for blood count and assessment of hematopoietic reconstitution by flow cytometry. (B) 5 × 10⁵ bone marrow cells from either control or mutant CD45.2 OcnCre+/−;iDTR donors were mixed with 5 × 10⁵ CD45.1 SJL bone marrow competitors in a 1:1 ratio and transplanted into lethally irradiated WT SJL recipients. Animals were bled at 8, 12, and 16 wk after transplantation for blood count and hematopoietic reconstitution by flow cytometry. (A and B) Two independent transplantations were performed; n = 20–22 mice/experiment. Data show mean ± SEM. (C) Cell cycle status, apoptosis, and necrosis in CLPs in OcnCre+/−;iDTR mutants and controls were assessed by flow cytometry. 2 independent experiments; n = 5–6 mice/group. Data show mean ± SEM.
Figure 5.
Figure 5.
Reduced DLL4 in the bone marrow of Ocn+ cell depleted mice led to decreased Notch signaling in CLP. (A) Intracellular Notch signaling was assessed by flow cytometry in the indicated cell populations. Representative flow plots are shown, and data are summarized by dot plot (right). Three independent experiments; n = 16–17 mice/group. Data show mean ± SEM. (B) Expression of the indicated Notch target genes in Ly6D CLP from OcnCre+/−;iDTR mutants and controls. Mutant and WT mice were treated with DT for 28 d before being subjected to flow cytometry for Ly6D CLP isolation and quantitative PCR. Two independent experiments; n = 12 mice/group. Data show mean ± SEM. (C) Expression of the Notch ligands in the bones of OcnCre+/−;iDTR DT-treated and control animals was assessed by qPCR. Mice were examined after 28 d after DT treatment. Three independent experiments; n = 12–14 mice/group. Data show mean ± SEM. (D) DLL4 expression in bone sections from control or Ocn+ cell deleted animals was assessed by immunohistochemistry. Two independent experiments; n = 6 mice/group. (E) Osx-mCherry cells and Ocn-Topaz cells were isolated from the OsxCre-mCherry;OcnCre-Topaz double transgenic mice by flow cytometry and expression of the indicated Notch ligands was assessed by qPCR. Experiment performed twice; n = 3/experiment. Data show mean ± SEM. (F) Gene set enrichment analysis (GSEA) comparing Ly6D CLP versus MPP microarray data. Experiment performed twice; n = 3/experiment. (G) GSEA comparing Ly6D CLP microarray data obtained from OcnCre;iDTR control versus mutant mice. Experiment was performed twice independently; n = 3–4/experiment.
Figure 6.
Figure 6.
Conditional deletion of DLL4 or Notch ligands in Ocn+ cells impaired T lymphopoiesis. (A) OcnCreER+/−;Dll4Fl/Fl mutants and OcnCreER+/−;Dll4+/+ control littermates were injected with 2mg 4-OH-tamoxifen/15 g BW eight times over 4 wk to induce deletion of the DLL4 ligand. Mice were harvested immediately after 4 wk of deletion and bone marrow CLPs, thymic T cell progenitors, and peripheral blood mature T cells were enumerated by flow cytometry. Experiment was performed 3 times independently; n = 9–10 mice/group. Data show mean ± SEM. (B) OcnCreER+/−;Mib1Fl/Fl mutants and OcnCreER+/−;Mib1+/+ control littermates were injected with 2 mg 4-OH-tamoxifen/15 g BW 8 times over 4 wk to induce deletion of the Mib1 gene. Mice were harvested immediately after 4 wk of deletion and bone marrow CLPs, thymic T cell progenitors, and peripheral blood mature T cells were enumerated by flow cytometry. Experiment was performed twice independently; n = 6–8 mice/group. Data show mean ± SEM.
Figure 7.
Figure 7.
Conditional ablation of Notch signaling in hematopoietic cells impaired T lymphopoiesis. (A) Mx1Cre+/−;Pofut1Fl/Fl mutants and Mx1Cre+/−;Pofut+/+ control littermates were injected with 12.5 µg/g BW polyinosinic:polycytidylic acid (poly(I:C)) every alternate day for 7 d to induce deletion of the Pofut1 gene. Mice were harvested 4 wk after injection and bone marrow CLPs, thymic T cell progenitors, and peripheral blood mature T cells were enumerated by flow cytometry. Experiment was performed twice independently; n = 4–6 mice/group. Data show mean ± SEM. (B) Mx1Cre+/−;RBPjkFl/Fl mutants and Mx1Cre+/−;RBPjk+/+ control littermates were injected with 12.5 µg/g BW poly(I:C) every alternate day for 7 d to induce deletion of RBP-Jκ. Mice were harvested 4 wk after injection and bone marrow CLPs, thymic T cell progenitors, and peripheral blood mature T cells were enumerated by flow cytometry. Experiment was performed twice independently; n = 6–8 mice/group. Data show mean ± SEM.
Figure 8.
Figure 8.
Notch blockade in the bone marrow by γ-secretase inhibitor impaired thymic T cell development, whereas Notch overexpression rescued T lymphoid defect. (A) 2.5 mM DAPT or PBS was injected into the left femur of each of 8 C57BL/6J mice at day −12, −9, −6. At day 0, the left femur, thymus, and peripheral blood were harvested for enumeration of bone marrow CLPs, thymic T cell progenitors, and peripheral blood mature T cells by flow cytometry. Experiment was performed twice independently; n = 4–8 mice/group. Data show mean ± SEM. (B) 106 Lineage-depleted hematopoietic progenitors were flow sorted from poly(I:C)-induced Mx1Cre;LSL-NICD-GFP mice or Mx1Cre;LSL-GFP control mice and transplanted into either OcnCre;iDTR mutant or control recipients. Recipients were harvested 1 wk after transplant and bone marrow CLPs, thymic T cell intermediates, and mature peripheral blood T cells were analyzed by flow cytometry. Experiment was performed twice independently; n = 8 mice/group. Data show mean ± SEM.
Figure 9.
Figure 9.
Ocn+ cell–depleted animals had intact thymic function but impaired CLP homing ability. (A) 30,000 flow sorted bone marrow CLPs from diphtheria treated OcnCre+/−;iDTR animals (Mut) or controls (Ctrl) were injected into the thymus of either OcnCre+/−;iDTR DT treated (Mut) or control (Ctrl) animals. Injection of PBS served as mock controls. Thymic T progenitor and mature populations were assessed after 4 wk. Two independent experiments; n = 4–6 mice/group. Data show mean ± SEM. (B) CCR7, CCR9, and PSGL1 cell surface expression on CLP from Ocn+ cell–depleted or control mice was assessed by flow cytometry. Panels on the left show expression levels (indicated by fluorescent intensity on the y axis) and dot plots on the right show numbers of cells with positive expression. Minimum two independent experiments; n = 8–10 mice/group. Data show mean ± SEM. (C) CLPs from diphtheria-treated OcnCre;iDTR control and mutant mice were labeled with green and red fluorescent dyes, respectively, mixed in a 1:1 ratio and transplanted intravenously into congenic SJL recipients, and harvested 24 h after transplant. Equal number of CLPs harvested from CCR7−/− mice was used as another control and competed with OcnCre;iDTR mutant CLPs in a similar manner. Donor-derived cells were enumerated from recipient thymi 24 h after transplant. Experiment was repeated with reciprocal dye to control for dye labeling efficiency. 2 independent experiments; n = 10 mice/experiment. Data show mean ± SEM.
Figure 10.
Figure 10.
In vivo rescue of T lineage defect by intravenous infusion of DLL4. (A–L) OcnCre;iDTR control and mutant mice were first treated with DT for 21 d to induce Ocn+ cell deletion, then injected with recombinant DLL4 intravenously at two different dosages: 100 ng/g BW or 1 µg/g BW. Flow cytometric evaluation of effects on the number of bone marrow CLPs (A), thymic T cell intermediates (B–K), and mature T cells circulated back to the bone marrow (L). Experiments was performed twice independently; n = 6–12 mice/group. Data show mean ± SEM. (M) Transgenic mice with osteolineage cells at the progenitor stage (Osx+) labeled red, intermediate stage (Osx+Ocn+) labeled yellow, and mature stage (Ocn+) labeled green were treated with either saline control (CNTR), parathyroid hormone (PTH), granulocyte colony-stimulating factor (G-CSF), IFN-γ, LPS, or transplanted in a noncompatible setting to elicit graft-versus-host disease (GvHD). The number of Osx+, Osx+Ocn+, and Ocn+ cells in femurs were enumerated by FACS. Experiment was performed twice; n = 8 mice/experiment. Results are means ± SEM.

Comment in

  • T cell development runs marrow deep.
    Zúñiga-Pflücker JC. Zúñiga-Pflücker JC. J Exp Med. 2015 May 4;212(5):599-600. doi: 10.1084/jem.2125insight3. J Exp Med. 2015. PMID: 25941319 Free PMC article. No abstract available.

References

    1. Androutsellis-Theotokis A., Leker R.R., Soldner F., Hoeppner D.J., Ravin R., Poser S.W., Rueger M.A., Bae S.K., Kittappa R., and McKay R.D.. 2006. Notch signalling regulates stem cell numbers in vitro and in vivo. Nature. 442:823–826 10.1038/nature04940 - DOI - PubMed
    1. Awong G., Singh J., Mohtashami M., Malm M., La Motte-Mohs R.N., Benveniste P.M., Serra P., Herer E., van den Brink M.R., and Zúñiga-Pflücker J.C.. 2013. Human proT-cells generated in vitro facilitate hematopoietic stem cell-derived T-lymphopoiesis in vivo and restore thymic architecture. Blood. 122:4210–4219 10.1182/blood-2012-12-472803 - DOI - PMC - PubMed
    1. Benedito R., Rocha S.F., Woeste M., Zamykal M., Radtke F., Casanovas O., Duarte A., Pytowski B., and Adams R.H.. 2012. Notch-dependent VEGFR3 upregulation allows angiogenesis without VEGF-VEGFR2 signalling. Nature. 484:110–114 10.1038/nature10908 - DOI - PubMed
    1. Buch T., Heppner F.L., Tertilt C., Heinen T.J., Kremer M., Wunderlich F.T., Jung S., and Waisman A.. 2005. A Cre-inducible diphtheria toxin receptor mediates cell lineage ablation after toxin administration. Nat. Methods. 2:419–426 10.1038/nmeth762 - DOI - PubMed
    1. Ding L., and Morrison S.J.. 2013. Haematopoietic stem cells and early lymphoid progenitors occupy distinct bone marrow niches. Nature. 495:231–235 10.1038/nature11885 - DOI - PMC - PubMed

Publication types

MeSH terms

Substances