. 2015 May 12;112(19):6140-5.
doi: 10.1073/pnas.1417320112. Epub 2015 Apr 27.

Ipilimumab-dependent cell-mediated cytotoxicity of regulatory T cells ex vivo by nonclassical monocytes in melanoma patients

Affiliations

Ipilimumab-dependent cell-mediated cytotoxicity of regulatory T cells ex vivo by nonclassical monocytes in melanoma patients

Emanuela Romano et al. Proc Natl Acad Sci U S A. .

Abstract

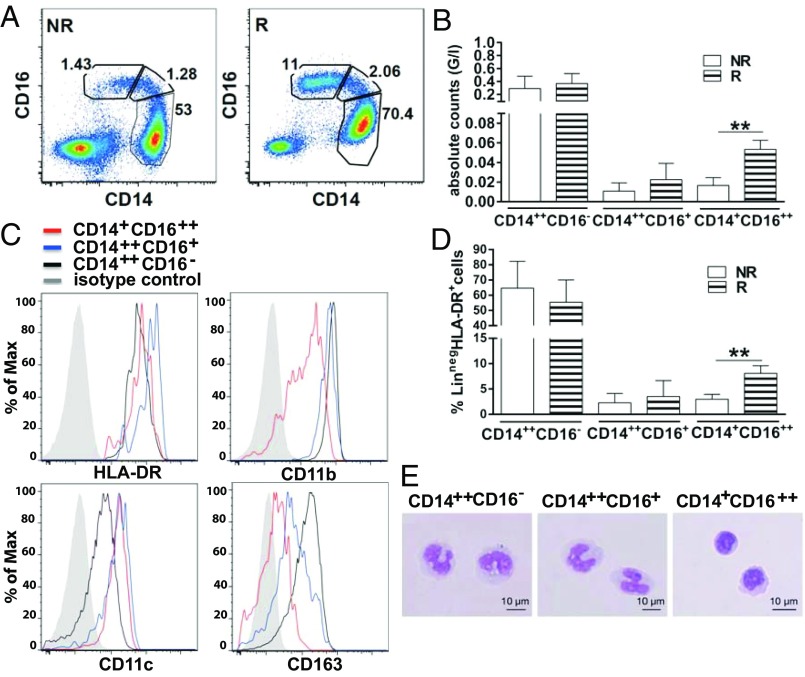
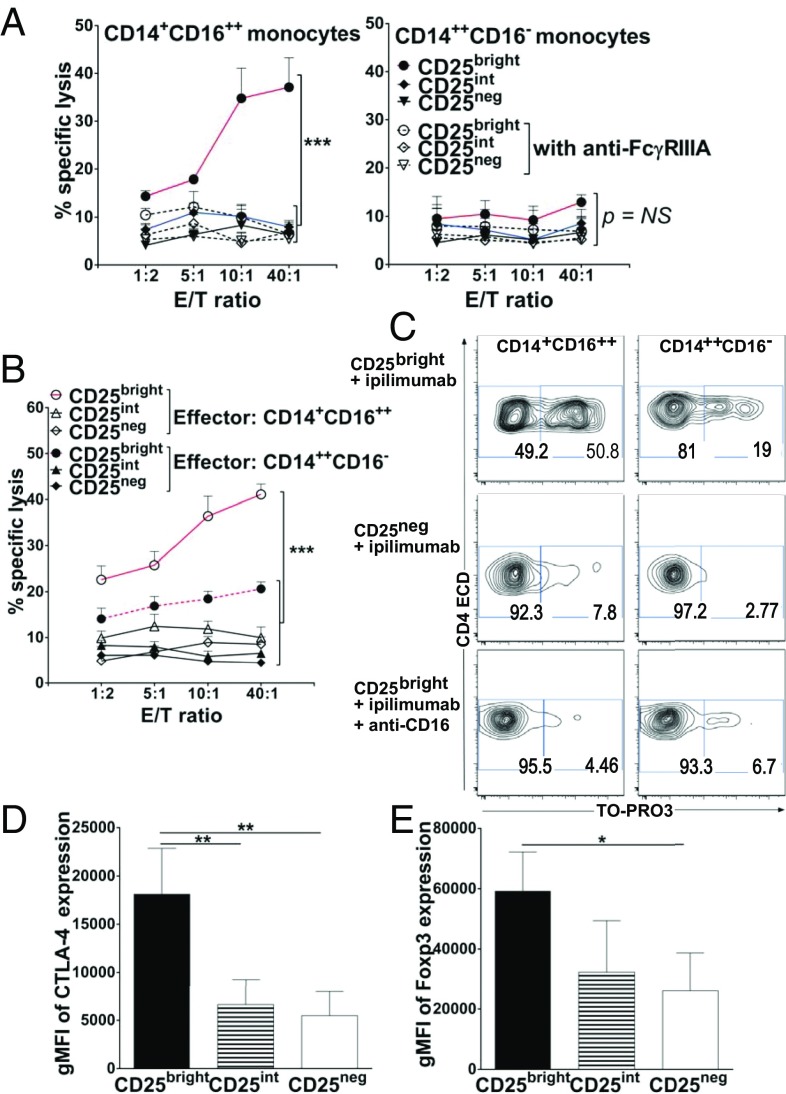
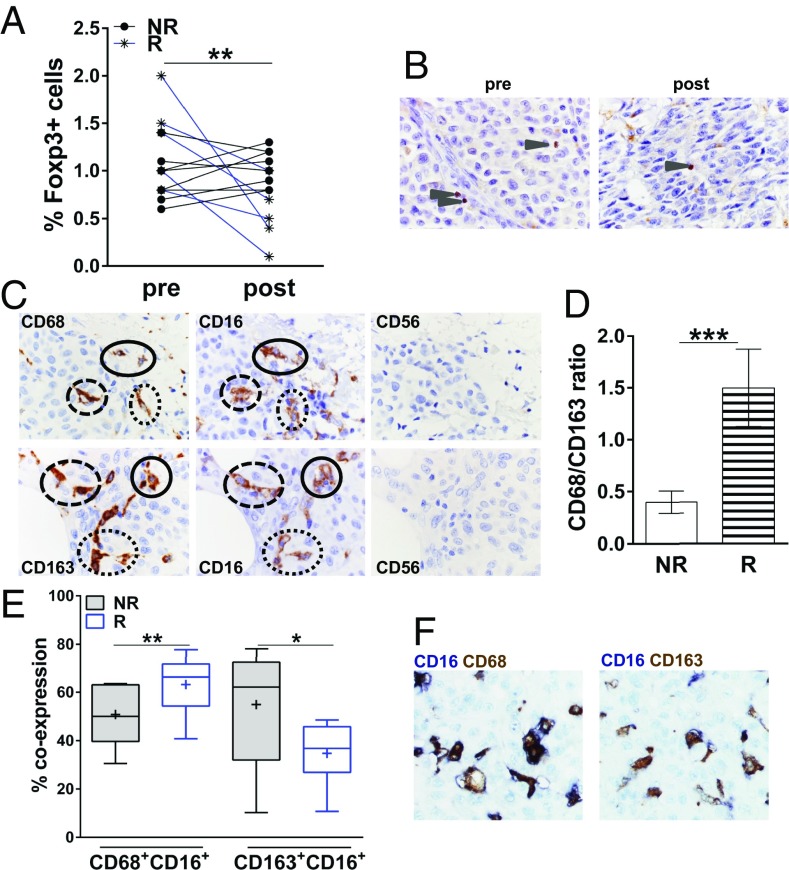
Enhancing immune responses with immune-modulatory monoclonal antibodies directed to inhibitory immune receptors is a promising modality in cancer therapy. Clinical efficacy has been demonstrated with antibodies blocking inhibitory immune checkpoints such as cytotoxic T lymphocyte-associated antigen 4 (CTLA-4) or PD-1/PD-L1. Treatment with ipilimumab, a fully human CTLA-4-specific mAb, showed durable clinical efficacy in metastatic melanoma; its mechanism of action is, however, only partially understood. This is a study of 29 patients with advanced cutaneous melanoma treated with ipilimumab. We analyzed peripheral blood mononuclear cells (PBMCs) and matched melanoma metastases from 15 patients responding and 14 not responding to ipilimumab by multicolor flow cytometry, antibody-dependent cell-mediated cytotoxicity (ADCC) assay, and immunohistochemistry. PBMCs and matched tumor biopsies were collected 24 h before (i.e., baseline) and up to 4 wk after ipilimumab. Our findings show, to our knowledge for the first time, that ipilimumab can engage ex vivo FcγRIIIA (CD16)-expressing, nonclassical monocytes resulting in ADCC-mediated lysis of regulatory T cells (Tregs). In contrast, classical CD14(++)CD16(-) monocytes are unable to do so. Moreover, we show that patients responding to ipilimumab display significantly higher baseline peripheral frequencies of nonclassical monocytes compared with nonresponder patients. In the tumor microenvironment, responders have higher CD68(+)/CD163(+) macrophage ratios at baseline and show decreased Treg infiltration after treatment. Together, our results suggest that anti-CTLA-4 therapy may target Tregs in vivo. Larger translational studies are, however, warranted to substantiate this mechanism of action of ipilimumab in patients.

Keywords: ADCC; Tregs; ipilimumab; macrophages; monocytes.


Conflict of interest statement

Conflict of interest statement: P.R. holds a consultant or advisory role with Immatics Biotechnologies and Formune. O.M. holds a consultant or advisory role with Bristol-Myers Squibb, Hoffmann-La Roche, MSD, and Glaxo-SmithKline. B.W. receives honoraria and research funding from Bristol-Myers Squibb.

This article is a PNAS Direct Submission.

Figures

Fig. 1.
Fig. 1.
Patients responding to ipilimumab have the highest frequencies of circulating nonclassical CD14+CD16++ monocytes at baseline. Human monocytes are contained within HLA-DR+ cells that do not express B-cell (CD19 or CD20), T-cell (CD3), NK cell (CD56), or granulocyte markers (CD15). One can distinguish three monocyte subsets, namely CD14++CD16, CD14++CD16+, and CD14+CD16++ monocytes and CD14CD16 dendritic cells. (A) Representative plots from ipilimumab responder (marked as “R”) and nonresponder (NR) patients with melanoma. (B and D) Pooled data from 15 responding and 14 nonresponding patients with melanoma: percentages and absolute counts of each monocyte subset at baseline. Error bars indicate the mean ± SD (**P < 0.01, unpaired two-tailed Student t test). (C and E) Phenotype and morphology of each monocyte subset.
Fig. 2.
Fig. 2.
Selective FcγRIIIA-dependent lysis ex vivo of Tregs (CD3+CD4+CD25brightCD127Foxp3++CTLA-4++ Tregs) by nonclassical CD14+CD16++ monocytes. (A) ADCC: killing of sorted CD3+CD4+CD25bright, CD25int, or CD25neg T cells (target) labeled with anti-CD4ECD from healthy donors by purified CD14+CD16++ (Left) or CD14++CD16 (Right) autologous monocytes (effector) at the indicated E:T ratios in the presence of ipilimumab with (open symbols) or without (filled symbols) anti-CD16 blocking Ab. (B) Similar assessment for ADCC of CD3+CD4+CD25bright, CD25int, or CD25neg T cells from patients with melanoma by purified CD14+CD16++ (open symbols) or CD14++CD16 (filled symbols) autologous monocytes. (AC) ADCC assessments used a flow cytometry-based assay whereby lysed target cells took up an otherwise membrane-impermeable DNA stain, TO-PRO3. Specific lysis was based on the frequency of CD4ECD+ TO-PRO3+ relative to CD4ECD+ TO-PRO3 events. With colorimetric labeling, specific lysis was plotted against the y axes with respect to the E:T ratio shown along the x axes. Data points are the averages ± SEM of triplicate means from three or four independent experiments in three different healthy donors and four different patients with melanoma (***P < 0.001 for pairwise comparisons between CD25bright vs. CD25int or CD25neg T cells targeted by CD14+CD16++ monocytes blocked or not with anti-CD16 for all E:T ratios tested; P value not significant for pairwise comparisons between CD25bright vs. CD25int or CD25neg T cells targeted by CD14++CD16 monocytes blocked or not with anti-CD16 for all E:T ratios tested; ANOVA). (C) Representative ADCC plots at the top E:T ratio for CD25bright and CD25neg T cells from one patient with melanoma and for CD25bright T cells from one normal donor with or without anti-CD16 blocking Ab. (D and E) gMFI of CTLA-4 and Foxp3 expression by sorted CD3+CD4+CD25bright, CD25int, or CD25neg T cells from healthy donors. Mean gMFI measurements of CTLA-4 are 18,100 ± 4,700, 6,600 ± 2,600, and 5,400 ± 2,500 in CD3+CD4+CD25bright, CD3+CD4+CD25int, and CD3+CD4+CD25neg T cells, respectively. Mean gMFI measurements of Foxp3 are 59,300 ± 13,000, 32,300 ± 17,000, and 26,100 ± 12,400 in CD3+CD4+CD25bright, CD3+CD4+CD25int, and in CD3+CD4+CD25neg T cells, respectively. Data represent the averages ± SD from three or four independent experiments (**P < 0.01 and ***P < 0.001, unpaired two-tailed Student t test).
Fig. 3.
Fig. 3.
Treg reduction in melanoma metastases from responder patients (marked as “R”) after ipilimumab dosing. (A) Quantitative IHC analysis of Foxp3+ cells per 100 melanoma cells in matched pre- and postipilimumab melanoma lesions from eight nonresponding patients (NR) and five responding patients, respectively (**P < 0.01, paired two-tailed Student t test). At baseline (pre), infiltration with Foxp3+ Tregs was similar in responders vs. nonresponders (P = 0.074, not significant, paired two-tailed Student t test). (B) IHC analysis from a representative responding patient (case G) with decreased tumor infiltration of Foxp3+ cells (arrowhead) after ipilimumab dosing (post) compared with baseline (pre). Foxp3 was developed by using DAB (DAB chromogen). (Magnification, 1,000×.) (C) Representative IHC staining of CD68, CD163, CD16, and CD56 on serial sections from patients B (Top) and F (Bottom) at baseline. Circles represent marker-expressing cells across subsequent sections. (Magnification, 1,000×.) (D) Quantitative IHC analysis of CD68+/CD163+ macrophage ratio in melanoma lesions at baseline from eight nonresponding patients and five responding patients, respectively. Error bars indicate mean ± SD (***P < 0.001, paired two-tailed Student t test). (E) Baseline density of colocalization, defined as percentage of CD16 and CD68 or CD163 expression of each of two markers in three representative tumor regions per sample. Box plots show the medians and interquartile ranges (25th to 75th percentiles), with whiskers approximating 95% of the data. The line in the middle of the box is plotted at the median; the plus sign represents the mean (Tukey method; **P < 0.01 and *P < 0.05 for CD16+CD68+ or CD16+CD163+ cellular density in responders vs. nonresponders, respectively, paired two-tailed Student t test). (F) Representative images of colocalization of CD16 with CD68 (Left) or CD163 (Right) on the same tissue section from case E at baseline. (Magnification, 1,000×.)

References

    1. Pardoll DM. The blockade of immune checkpoints in cancer immunotherapy. Nat Rev Cancer. 2012;12(4):252–264. - PMC - PubMed
    1. Hodi FS, et al. Improved survival with ipilimumab in patients with metastatic melanoma. N Engl J Med. 2010;363(8):711–723. - PMC - PubMed
    1. Robert C, et al. Ipilimumab plus dacarbazine for previously untreated metastatic melanoma. N Engl J Med. 2011;364(26):2517–2526. - PubMed
    1. Pardoll DM. Immunology beats cancer: A blueprint for successful translation. Nat Immunol. 2012;13(12):1129–1132. - PMC - PubMed
    1. Bachmann MF, Köhler G, Ecabert B, Mak TW, Kopf M. Cutting edge: Lymphoproliferative disease in the absence of CTLA-4 is not T cell autonomous. J Immunol. 1999;163(3):1128–1131. - PubMed

Publication types

MeSH terms