. 2015 May 12;112(19):6009-14.
doi: 10.1073/pnas.1506465112. Epub 2015 Apr 27.

How release of phosphate from mammalian F1-ATPase generates a rotary substep

Affiliations

How release of phosphate from mammalian F1-ATPase generates a rotary substep

John V Bason et al. Proc Natl Acad Sci U S A. .

Abstract

The rotation of the central stalk of F1-ATPase is driven by energy derived from the sequential binding of an ATP molecule to its three catalytic sites and the release of the products of hydrolysis. In human F1-ATPase, each 360° rotation consists of three 120° steps composed of substeps of about 65°, 25°, and 30°, with intervening ATP binding, phosphate release, and catalytic dwells, respectively. The F1-ATPase inhibitor protein, IF1, halts the rotary cycle at the catalytic dwell. The human and bovine enzymes are essentially identical, and the structure of bovine F1-ATPase inhibited by IF1 represents the catalytic dwell state. Another structure, described here, of bovine F1-ATPase inhibited by an ATP analog and the phosphate analog, thiophosphate, represents the phosphate binding dwell. Thiophosphate is bound to a site in the α(E)β(E)-catalytic interface, whereas in F1-ATPase inhibited with IF1, the equivalent site is changed subtly and the enzyme is incapable of binding thiophosphate. These two structures provide a molecular mechanism of how phosphate release generates a rotary substep as follows. In the active enzyme, phosphate release from the β(E)-subunit is accompanied by a rearrangement of the structure of its binding site that prevents released phosphate from rebinding. The associated extrusion of a loop in the β(E)-subunit disrupts interactions in the α(E)β(E-)catalytic interface and opens it to its fullest extent. Other rearrangements disrupt interactions between the γ-subunit and the C-terminal domain of the α(E)-subunit. To restore most of these interactions, and to make compensatory new ones, the γ-subunit rotates through 25°-30°.

Keywords: ATP synthase; mitochondria; phosphate release; rotary substep.


Conflict of interest statement

The authors declare no conflict of interest.

Figures
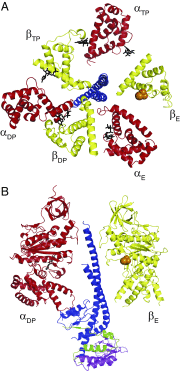
Fig. 1.
Fig. 1.
Structure of the bovine F1-ThioP complex. Cross-sectional views of the F1-ATPase from above and toward the membrane domain of the intact ATP synthase of the C-terminal domains of the α- and β-subunits (residues 380–510 and 364–474, respectively), arranged alternately around the γ-subunit (residues 1–47 and 206–270) (A) and from the side showing the αDP-subunit; the γ-, δ-, and ε-subunits; and the βE-subunit (B). The α-, β-, γ-, δ-, and ε-subunits are colored red, yellow, blue, magenta, and green, respectively. Bound nucleotides and a thiophosphate ion are colored black and orange, respectively.
Fig. 2.
Fig. 2.
Thiophosphate bound to the βE-subunit of the F1-ThioP complex. (A) Electron density of the 2FO-FC map of the thiophosphate binding site (contour level = 1.0 σ). The electron density (gray mesh) extends for a radius of 1.6 Å around the residues of the binding site. (B) Side chains of residues contributing to the thiophosphate binding site and their distances (in angstroms) from the bound thiophosphate. The side chains of residues of the βE-subunit and the thiophosphate are colored yellow and orange, respectively. Oxygen, nitrogen, and sulfur atoms are colored red, blue, and gold, respectively.
Fig. 3.
Fig. 3.
Comparison of the structures of the thiophosphate binding site in the F1-ThioP complex and of the equivalent sites in complexes of bovine F1-ATPase inhibited with the natural inhibitor protein, IF1. F1-ThioP (A) and F1-I3-ThioP (B) are shown. The residues of the surrounding βE-subunit, the Arg finger residue αER373, and the thiophosphate are colored yellow, pink, and orange, respectively. Oxygen, nitrogen, and sulfur atoms are colored red, blue, and gold, respectively. The distance of the salt bridge interaction between βE-E188 and βE-R260 is shown in angstroms.
Fig. 4.
Fig. 4.
Comparison of the structures of a loop region in the vicinity of the thiophosphate binding site in F1-ThioP with the equivalent loop in F1-I3-ThioP. The loop, residues 187–189 of the βE-subunit, contains residue βE-E188. The αE- and βE-subunits and their structural elements are depicted in cartoon representation in red and yellow, respectively. (A) View toward the interface between the αE- and βE-subunits with the bound thiophosphate shown in orange and, in the box, an expanded view of the thiophosphate binding site. (B) Equivalent expanded view of the site in F1-I3-ThioP. In A and B, residues βE-E188 and βE-R260 are shown in stick representation, with oxygen and nitrogen atoms shown in red and blue, respectively.
Fig. 5.
Fig. 5.
Comparison of interactions between the γ-subunit and the α- and β-subunits in the F1-ThioP and F1-I3-ThioP complexes. The blue α-helical regions are residues 1–41 and 211–253 of the γ-subunit. (AD) F1-ThioP and F1-I3-ThioP complexes, respectively; the residues in the γ- and αE-subunits involved in these contacts are shown as light blue and red spheres, respectively. Views from the side (A and B) and from below (C and D) are depicted.

References

    1. Walker JE, Lutter R, Dupuis A, Runswick MJ. Identification of the subunits of F1Fo-ATPase from bovine heart mitochondria. Biochemistry. 1991;30(22):5369–5378. - PubMed
    1. Walker JE. The ATP synthase: The understood, the uncertain and the unknown. Biochem Soc Trans. 2013;41(1):1–16. - PubMed
    1. Abrahams JP, Leslie AGW, Lutter R, Walker JE. Structure at 2.8 Å resolution of F1-ATPase from bovine heart mitochondria. Nature. 1994;370(6491):621–628. - PubMed
    1. Watt IN, Montgomery MG, Runswick MJ, Leslie AGW, Walker JE. Bioenergetic cost of making an adenosine triphosphate molecule in animal mitochondria. Proc Natl Acad Sci USA. 2010;107(39):16823–16827. - PMC - PubMed
    1. Bowler MW, Montgomery MG, Leslie AGW, Walker JE. How azide inhibits ATP hydrolysis by the F-ATPases. Proc Natl Acad Sci USA. 2006;103(23):8646–8649. - PMC - PubMed

Publication types

LinkOut - more resources